
Watch the video
This player shows only the Bitcoin chapter of the daily altii market briefing. Watch the full video on tube.altii.de.
Key Data Snapshot
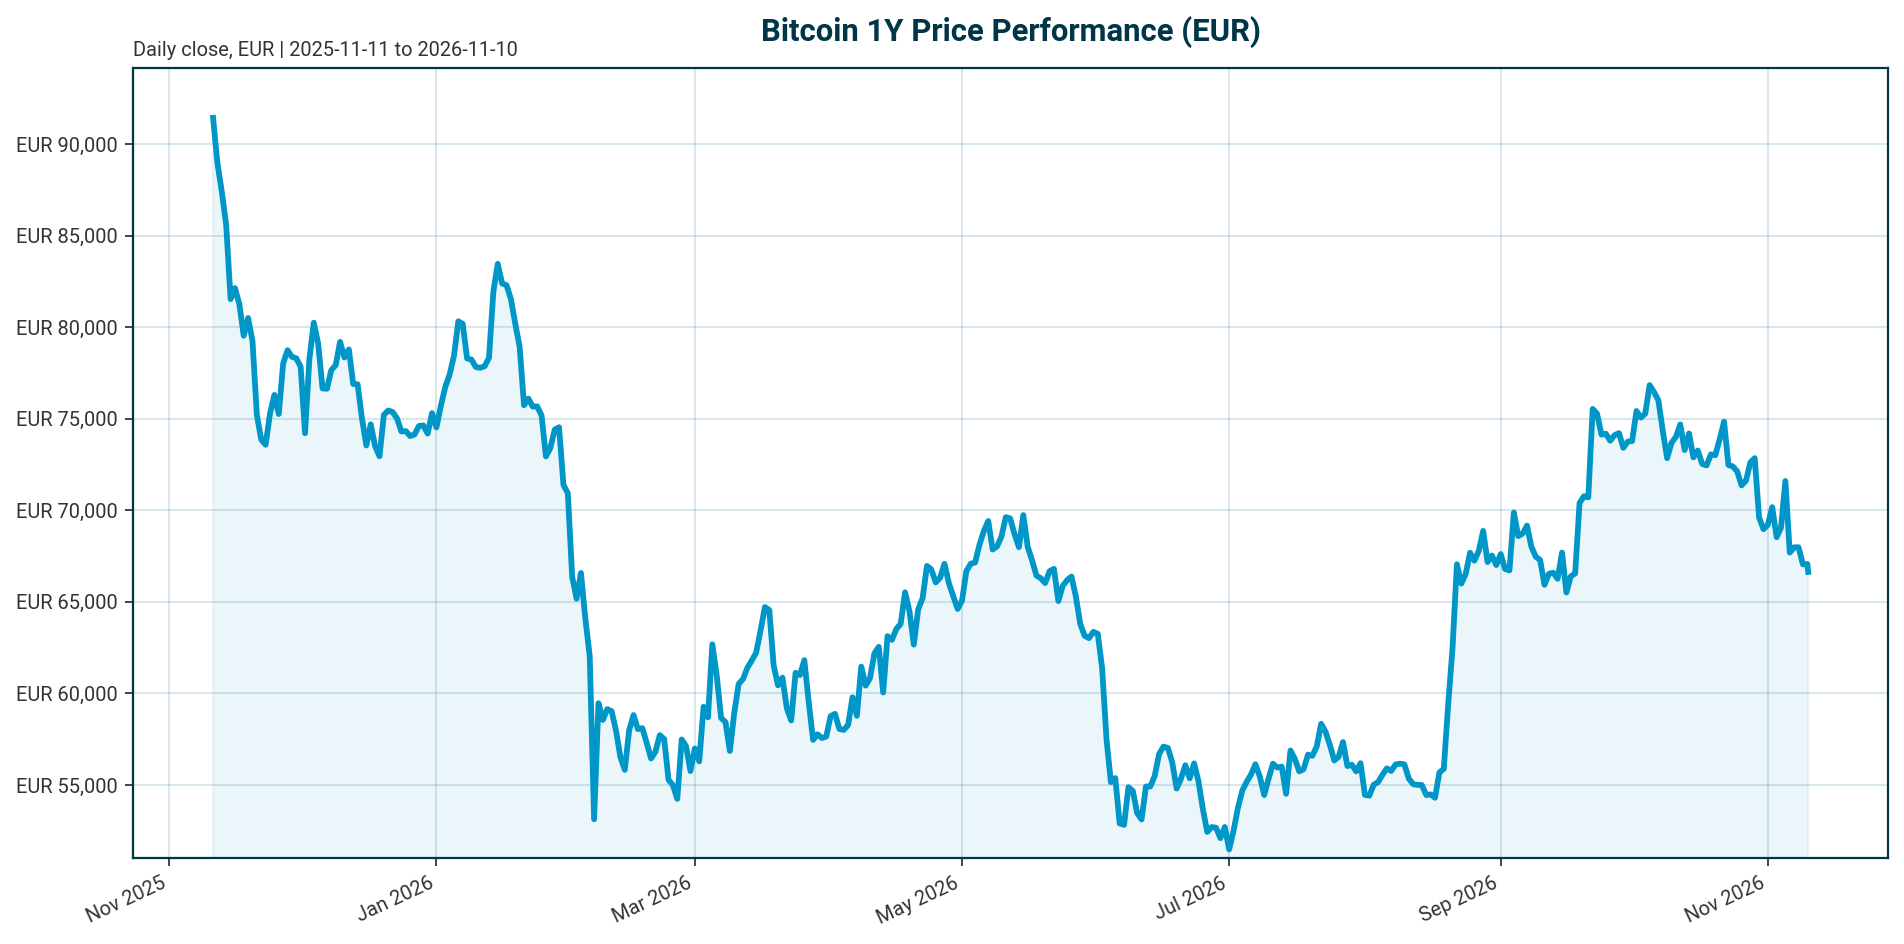
Bitcoin trades at EUR 66,601 as of 10 November 2026, down 0.33% over 24 hours and 38.14% below its all-time high of EUR 107,662 set on 6 October 2025. The market is in a corrective regime: negative across the 7-day, 14-day, 30-day and 1-year horizons, but only modestly negative on a 200-day basis, consistent with a prolonged digestion of the 2025 peak rather than a collapse.
| Metric | Value |
|---|---|
| Price (EUR) | 66,601 |
| 24h range (EUR) | 65,654 to 67,228 |
| 24h volume (EUR) | 25.18bn (approx. 1.88% of market cap) |
| Market cap (EUR) | 1.339tn (rank 1) |
| Fully diluted valuation (EUR) | 1.339tn (dilution premium negligible) |
| Performance 7d / 14d / 30d | -2.78% / -6.29% / -9.75% |
| Performance 200d / 1y | -3.93% / -29.63% |
| All-time high (EUR) | 107,662 on 2025-10-06; current price -38.14% below |
| BTC dominance | 59.61% |
| Supply | 20,110,078 of 21,000,000 max (95.76% issued) |
| Fed funds target range | 3.75% to 4.00% as of 2026-11-09; last change: hike of 25 bp effective 2026-09-17 |
| ECB deposit facility rate | 2.50% as of 2026-11-10; last change: hike of 25 bp effective 2026-09-16 |
Drawdown math: reclaiming the ATH requires a rally of 107,662 / 66,601 – 1 = +61.65% from current levels. Remaining issuance is approximately 889,922 BTC, and annual issuance growth runs below 1% [T1], so price is now almost entirely demand-driven.
Market Setup
The cross-asset backdrop is neutral in risk sentiment with moderately negative equity momentum. DACH equities outperform: DACH indicators average +2.08% over 5 days versus -0.32% for global equity indicators, with the ATX strongest at +2.60% over 5 days and the DAX leading on a 1-month basis at +4.70%. The Nikkei 225 is the weakest 5-day performer at -3.10%. US equities have weakened over the past month, with the Nasdaq Composite down 7.72% and the S&P 500 down 3.35% on a 1-month basis. This matters for Bitcoin because institutionalization has fused BTC into the machinery of global capital, tying its volatility profile to interest rates, equity rotations and margin demands rather than retail cycles [T3].
Rates and FX are mixed. The euro area AAA 10Y yield stands at 3.29%, down 4.1 bp over 5 days, with the AAA 10Y-2Y spread at 35.5 bp. EUR/USD trades at 1.1189, down 0.21% over 5 days. Policy is restrictive: the Fed funds target range is 3.75% to 4.00%, with the last decision a 25 bp hike effective 2026-09-17, and the ECB deposit facility rate is 2.50%, with the last decision a 25 bp hike effective 2026-09-16. With policy rates at restrictive levels and euro 10Y yields near 3.29%, BTC-EUR lacks a macro tailwind and remains range-bound, tracking equity liquidity conditions. Upside would require a shift in market expectations toward Fed easing; per T4, a decisive move toward $100,000 would likely require a stronger shift in Fed expectations toward lower rates. That is a market expectation, not a decision — the last actual Fed move was the September hike.
Investment Thesis
Bitcoin is an institutionalized liquidity asset in a corrective phase. The structural adoption story is intact: regulated custody platforms now hold an estimated 5% to 7% of all circulating Bitcoin [T3], wealth managers are embedding spot BTC ETFs into model portfolios [T3], and institutional participation has compressed volatility from historical levels of 60% to 80% toward roughly 30% [T1]. Against this stand restrictive policy rates on both sides of the Atlantic and two-sided ETF flows that currently send conflicting signals.
The flow evidence is genuinely mixed. Per T1 from late October 2026, US spot Bitcoin ETFs saw roughly $635 million of net outflows in a single session. Per T4, digital asset funds recorded a fifth consecutive week of inflows and US spot Bitcoin ETFs attracted around $853.5 million over the past week. These cannot be reconciled chronologically because the sources are undated; both should be treated as point-in-time observations. The correct analytical stance is that ETF flows are partly reactive amplifiers: the largest inflows cluster near local peaks and the largest outflows after declines [T4]. A DWF Labs analysis found that US spot BTC ETFs lost money in 7 of 8 market declines of at least 15% since their January 2024 launch, meaning institutions are not dependable buyers in stress [T8].
On the supply side, the picture is improving at the margin. Per T4, the largest holders have shifted from distributing roughly $40 billion of BTC since October 2025 to accumulation. With 95.76% of the 21 million cap issued and issuance growth below 1% annually [T1], any demand recovery meets thin new supply. For a EUR-based investor, the hurdle rate is set by the euro AAA 10Y yield of 3.29% and the ECB deposit rate of 2.50%, both offering positive risk-free returns that raise the required risk premium on a zero-cash-flow asset. Base case: BTC-EUR consolidates in the mid-60,000s EUR while the market awaits flow confirmation and regulatory clarity. Bear case: if ETF outflows resume and policy stays restrictive, the 1-year drawdown of -29.63% deepens.
Bullish Drivers
- Supply scarcity. Fixed code-based issuance growing below 1% annually, with 95.76% of the 21 million cap already issued. FDV equals market cap almost exactly, so future dilution is negligible.
- Demand runway. Per T1, institutions managing more than $140 trillion in assets could eventually allocate even a small single-digit percentage to digital assets, implying a large potential demand-supply gap.
- Whale accumulation. Per T4, the largest holders have shifted from selling roughly $40 billion of BTC since October 2025 to accumulation, removing a key source of supply pressure.
- Flow stabilization. Per T4, digital asset funds recorded a fifth consecutive week of inflows and US spot BTC ETFs attracted around $853.5 million over the past week.
- Regulatory milestones. The SEC’s March 2026 classification of Bitcoin as a digital commodity was a milestone [T1], and progress on US market-structure legislation could act as a further catalyst into late 2026 [T5].
- Potential liquidity rotation. Per T7 from February 2026, the Fed’s rate-cutting cycle was described as in early innings, with more than $10 trillion in lower-yielding money-market and fixed-income ETFs potentially poised to rotate into risk assets. This is a dated scenario assumption, not a current policy stance; the authoritative data show the last Fed decision was a 25 bp hike effective 2026-09-17, taking the target range to 3.75% to 4.00%.
- Short squeeze potential. Per T6, approximately $3.3 billion in short positions could face liquidation on a move higher. This is a positioning-driven, low-durability catalyst from a lower-authority source and should be weighted accordingly.
Bull scenario: passage of US market-structure legislation plus a dovish repricing of market expectations for Fed policy could trigger rotation from the money-market pool [T7] and push BTC-EUR back toward the EUR-equivalent of the $100,000 to $113,000 zone cited in T4 and T6. Any such easing is a market expectation, not a central bank decision.
Relative Positioning vs Gold and Ethereum
Versus Ethereum. Within crypto, BTC is the clear leader. Dominance of 59.61% and market cap rank 1 confirm outperformance, and the cross-check of BTC market cap over total crypto market cap yields approximately 59.90%, a minor definitional difference. Per T2, Bitcoin showed relative resilience while Ethereum and major altcoins remained weaker; Ether ETFs recorded $103.3 million of net outflows, a fourth consecutive session of withdrawals, while capital selectively favored institutional infrastructure, tokenization and stablecoin payment themes. Per T6, a bank raised its 12-month Bitcoin target to $113,000 from $82,000 while setting its Ether target at $3,028, implying higher expected returns for BTC than ETH. No current ETH price exists in the dataset, so ETH comparisons rest on these dated source figures.
Versus gold. No current gold price or performance data is present in the dataset, so the gold leg must remain qualitative. The competing store-of-value narrative favors gold in the current regime: BTC is down 29.63% over 1 year and 38.14% from its ATH, while gold’s performance, though unquantified here, has been driven by the same restrictive-rate and geopolitical hedging demand that BTC only partially captures. BTC’s advantage over gold is its fixed supply and higher beta to adoption; gold’s advantage is a multi-millennium monetary track record and lower correlation to equity liquidity cycles, which matters when BTC now trades as a Wall Street liquidity vehicle [T3]. A barbell of gold and BTC captures both, with BTC dominance above 59% favoring BTC over ETH as the crypto leg.
Rotation risk: if market-structure legislation passes and de-risks altcoin ETFs [T5], capital could rotate down the curve and erode BTC’s dominance.
Scenario Framework
Probabilities below are explicit assumptions, not model outputs. Anchor: BTC-EUR 66,601; ATH EUR 107,662; drawdown -38.14%. All USD figures from sources are converted at EUR/USD 1.1189 and labeled as approximations; source USD levels may reflect different snapshot dates. Policy backdrop for all scenarios: Fed funds target range 3.75% to 4.00% (last decision: 25 bp hike effective 2026-09-17) and ECB deposit facility rate 2.50% (last decision: 25 bp hike effective 2026-09-16); any easing referenced below is a market expectation, not a decision.
| Scenario | Assumed probability | Triggers | EUR implication (approx.) |
|---|---|---|---|
| Bull | 25% | Market-structure legislation advances; market expectations shift toward future Fed easing despite the current restrictive stance (expectation per T4, undated); bank 12-month target of $113,000 per T6 | $100,000 to $113,000 equals approx. EUR 89,373 to 100,992 |
| Base | 50% | Rates stay at current restrictive levels (Fed 3.75% to 4.00%; ECB 2.50%); ETF flows stay choppy; no confirmed trend change | Range of roughly EUR 60,000 to 75,000 |
| Bear | 25% | ETF outflows re-accelerate (approx. $635m single-session per T1; more than $700m weekly per T6); leverage unwinds; legislation stalls | Break below recent support; drawdown beyond -38.14% extends |
Technical reference levels quoted in USD by sources: support near $81,000 (approx. EUR 72,394) and resistance near $84,000 to $85,000 for a confirmed trend change, per T2 and T6. These levels are undated and possibly stale relative to the current EUR 66,601 price; treat them as approximate. Leverage fragility remains the swing factor: one year after the $19 billion liquidation event, excessive leverage can overwhelm fundamentals within hours [T6].
Valuation Discussion
Bitcoin has no cash flows, so no discounted-cash-flow valuation is possible. Valuation rests on scarcity, adoption and liquidity narratives, and any single-metric fair value claim would be false precision. The relevant math:
- Scarcity. 20,110,078 BTC circulating of 21,000,000 max (95.76% issued). FDV of EUR 1.339tn exceeds market cap by a negligible margin, confirming minimal dilution. Implied USD price of the bundle quote: EUR 66,601 x 1.1189 = approx. USD 74,522, which sits below the $81,000 to $83,000 levels quoted in T2 and T6; the gap reflects different snapshot dates and is disclosed here.
- Demand-side framing. ETF flows are coincident, not predictive [T4], so flow-based valuation must be treated as reactive. The long-run demand ceiling is framed by the $140tn-plus institutional AUM pool that could allocate low single digits to digital assets [T1]; a move from basis points toward low single digits would support a materially higher long-run EUR valuation, but this is an adoption assumption, not a forecast.
- Hurdle rate. Euro AAA 10Y at 3.29% gives EUR investors a positive risk-free benchmark; BTC-EUR must clear roughly 3.29% over 12 months just to justify the risk. With the ECB deposit rate at 2.50% and policy restrictive, the opportunity cost of a zero-cash-flow asset argues for a persistent risk premium discount in any scenario-weighted valuation.
- Volatility regime. Compressed volatility of roughly 30% versus historical 60% to 80% [T1] changes risk-budget math for allocators: smaller position sizes achieve the same portfolio risk contribution, which can broaden the institutional buyer base but also makes price action more dependent on macro flows.
- Positioning. A -38.14% drawdown from ATH and -29.63% over 1 year place BTC in a mature correction. Historical evidence that selloffs have become slower and less frequent as institutionalization deepens [T8] supports the view that drawdowns are less disorderly, without implying a floor.
Risks
- Policy risk. The Fed funds target range of 3.75% to 4.00%, following a 25 bp hike effective 2026-09-17, and the ECB deposit rate of 2.50%, following a 25 bp hike effective 2026-09-16, are restrictive. Further tightening would pressure a zero-yield, liquidity-sensitive asset; conversely, if markets price easing that fails to materialize, disappointment could hit positioning.
- Regulatory risk. Stalled market-structure legislation and uncertain banking and custody rules could delay institutional adoption despite the SEC’s March 2026 commodity classification [T1]; the CLARITY Act vote outcome remains a wildcard [T5].
- Flow and liquidity risk. US spot BTC ETFs lost money in 7 of 8 declines of at least 15% since January 2024, so institutions are not dependable buyers in stress [T8]. The approx. $635 million single-session outflow in late October 2026 [T1] shows how quickly demand can reverse.
- Leverage risk. The $19 billion liquidation event demonstrated that excessive leverage can overwhelm fundamentals within hours [T6]. A correlated liquidation cascade remains the primary tail scenario.
- Systemic correlation risk. BTC now trades as a liquidity vehicle tied to rates, equity rotations and margin demands [T3]. The Nasdaq’s -7.72% 1-month move transmits directly to BTC.
- FX risk for EUR investors. EUR/USD at 1.1189, down 4.77% YTD, means BTC-EUR returns embed USD translation risk in both directions. A stronger euro mechanically drags BTC-EUR even if USD-denominated BTC is flat.
- Data risk. News sources quote USD prices and undated flow figures; all USD levels here are converted at EUR/USD 1.1189 and labeled as approximations. Conflicting flow figures ($635m outflow per T1 versus $853.5m weekly inflow per T4) cannot be reconciled chronologically.
Appendix
Methodology and provenance. Market data retrieved 2026-11-10T05:15:08Z via CoinGecko. Market overview data from STOXX, Wiener Boerse, FMP, the ECB yield curve, Frankfurter FX and FRED. Policy rates are authoritative from the bundle: Fed funds target range from FRED as of 2026-11-09; ECB deposit facility rate from the ECB key rate as of 2026-11-10. All primary figures are in EUR. USD figures from news sources are converted at EUR/USD 1.1189 and labeled as approximations.
Source dating caveat. Tavily news items lack publication timestamps. All news figures are cited with their stated internal dates where available (for example, per T1 from late October 2026, per T7 from February 2026) and treated as point-in-time observations, not current state. Conflicting flow figures are presented side by side rather than reconciled.
Currency discrepancy note. Sources quote BTC around $81,000 to $83,000 [T2, T6] while the bundle price is EUR 66,601, approximately USD 74,522 at 1.1189. The discrepancy reflects different snapshot dates and is disclosed rather than adjusted.
Glossary. ETF creation/redemption: the mechanism by which Authorized Participants create or redeem ETF shares, transmitting flows to the underlying asset. BTC dominance: Bitcoin’s share of total crypto market capitalization. FDV: fully diluted valuation, price multiplied by maximum supply. CLARITY Act: proposed US market-structure legislation defining regulatory responsibilities for digital assets. Authorized Participants: institutions empowered to create and redeem ETF shares. Deposit facility rate: the ECB rate banks earn on overnight deposits at the central bank.
Sources
- [T1] MAXI ETF: Bitcoin Exposure with an Income Overlay in a Challenging Macro Backdrop (Tickeron)
- [T2] Bitcoin Holds the Line, Altcoins Falter as Crypto Enters a New Institutional Cycle (MarinaTimes NG)
- [T3] Bitcoin ETF Flows Remain a Key Market Driver (moomoo Community)
- [T4] Bitcoin Is Building a Bottom but Still Lags Wall Street (XTB)
- [T5] Crypto ETFs Enter a New Phase in September (Bitcoin Foundation)
- [T6] Bitcoin Faces Market Structure Problem Amid Volatility (LinkedIn, Viktor Kopylov)
- [T7] Bitcoin’s Evolving Institutional Role (ARK Invest, February 2026)
- [T8] Bitcoin ETFs sold through 7 of 8 crashes (CryptoSlate)
Disclaimer. This report is AI-generated, for informational purposes only, and does not constitute investment advice. It should not be relied upon for making investment decisions. Figures are point-in-time and may be inaccurate or outdated; readers should verify all data independently and consult a licensed financial advisor before acting.
Important Note / Wichtiger Hinweis:
EN: This report may have been generated using AI. It processes data from publicly available sources. The content is provided for informational purposes only.DE: Dieser Bericht kann mithilfe von KI erstellt worden sein. Dabei werden Daten aus öffentlich zugänglichen Quellen verarbeitet. Die Inhalte dienen ausschließlich Informationszwecken.
* DE: Die ergänzenden Inhalte können KI-generiert sein. EN: The additional content may be AI-generated.