
Listen to the summary
Key Data Snapshot
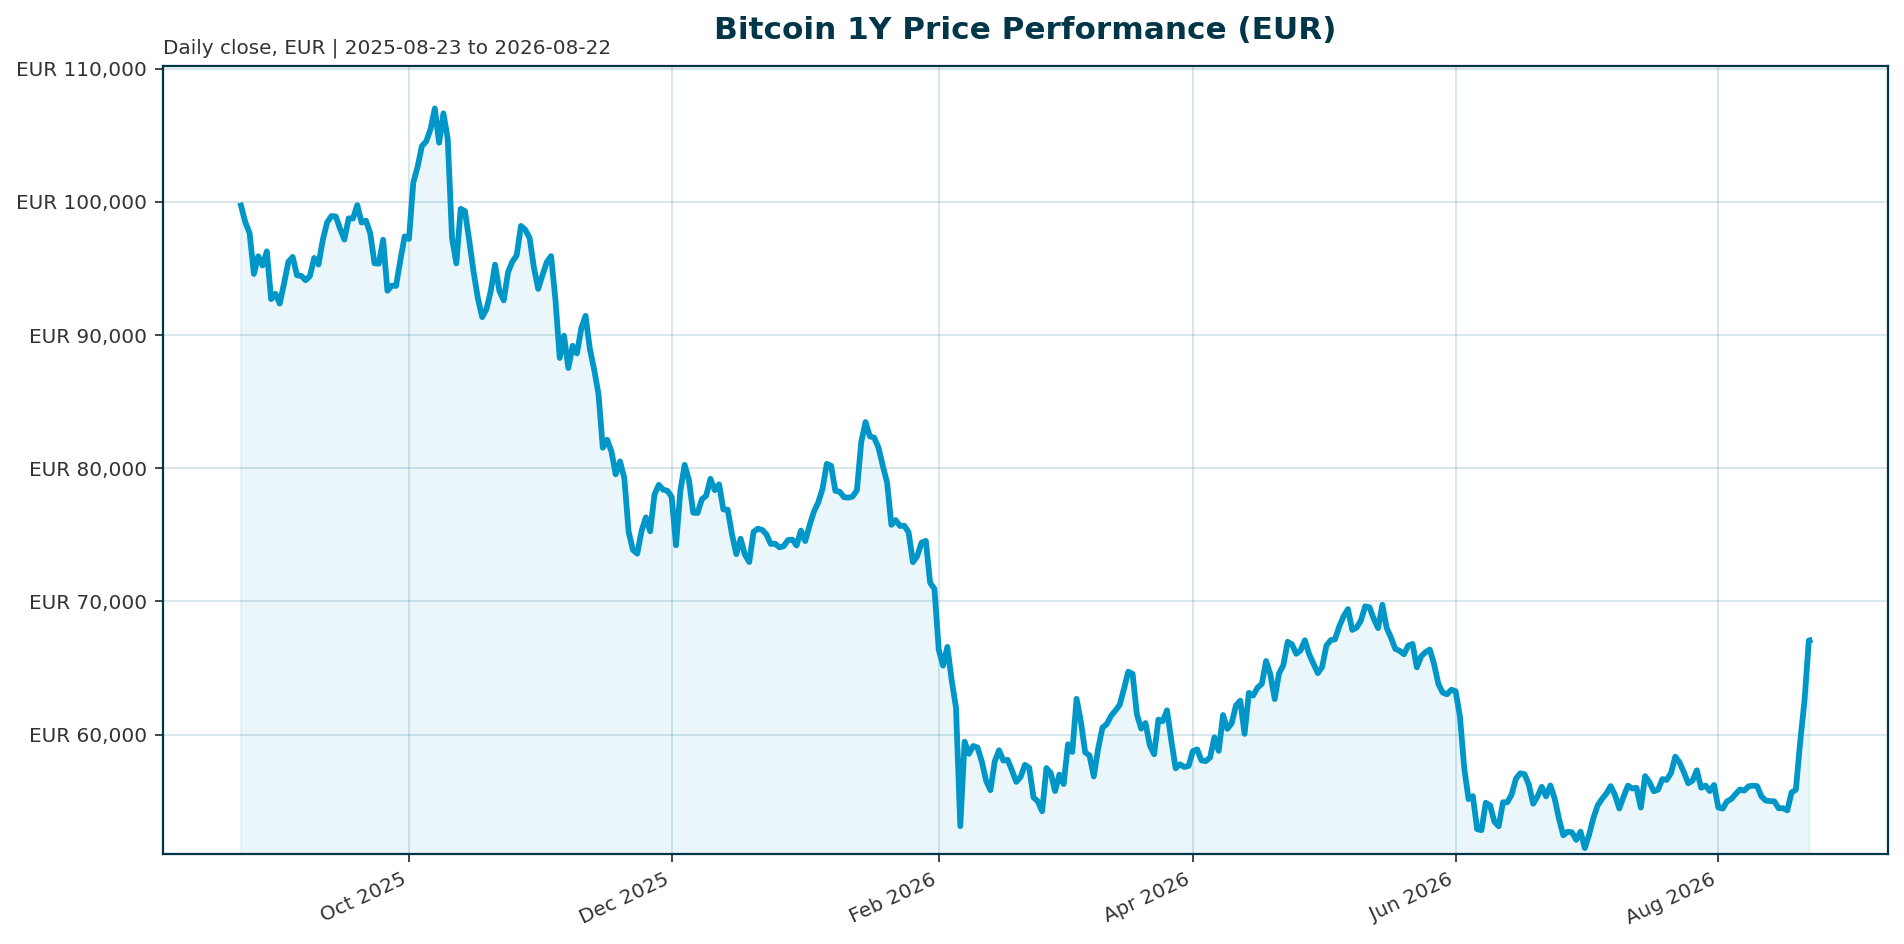
| Metric | Value |
|---|---|
| Price (EUR) | 67,098.00 |
| 24h Change | +5.40% |
| 7d Change | +24.40% |
| 1y Change | -30.70% |
| Market Cap (EUR) | 1,346,667,912,450.00 |
| BTC Dominance | 58.45% |
| All-Time High (ATH) | 107,662.00 (Oct 2025) |
| ATH Change | -37.68% |
Market Setup
Risk sentiment is neutral as global equity markets show divergent momentum with the Hang Seng leading on a 5-day basis at 2.19% while the Nikkei 225 lags at -4.63% [market_overview]. The Euro area AAA 10Y yield sits at 3.28% with mixed FX backdrop conditions [market_overview]. In this environment, Bitcoin ETF flows have effectively become the asset’s new macro indicator, replacing retail speculation as the primary driver of price action [T1].
Investment Thesis
The investment thesis for Bitcoin has evolved from speculative curiosity to a legitimate financial asset class. Institutional investors now recognize the long-term value of blockchain technology, with 94% of respondents viewing it favorably [T3]. The market structure has shifted decisively toward an “institutional supply era” where regulated investment vehicles and digital asset treasury structures (DATs) allow Bitcoin to function as an allocatable line item for traditional financial workflows [T1]. This structural shift implies that Bitcoin’s price action increasingly correlates with institutional capital allocation decisions rather than pure retail sentiment [T3].
Bullish Drivers
- Structural Demand Imbalance: Analysis from 2025 indicates institutional demand surpassed new supply by 5.6 times. Institutions accumulated 545,579 BTC while miners produced only 97,082 BTC during comparable timeframes, fundamentally altering the market structure [T6].
- ETF Dominance in Price Discovery: U.S.-listed Bitcoin ETFs now dominate price discovery approximately 85% of the time, acting as the primary transmission mechanism between institutional capital and spot markets [T6].
- Regulatory Catalysts: The potential passage of the CLARITY Act could establish a federal market-structure framework, unlocking broader institutional participation [T2].
- Institutional Targets: Major banks and funds project significant upside. JPMorgan Chase projects a $150,000 peak target using a flow-based valuation model with 72% confidence targeting Q4 2026, while Ark Invest maintains a 2026 milestone target of $200,000 [T3].
Relative Positioning vs Gold and Ethereum
Bitcoin maintains its position as the dominant digital asset with a market cap dominance of 58.45% [market_data]. It continues to compete directly with gold as a store of value, often viewed as “digital gold” by institutional allocators. Ethereum serves as the primary Layer 1 infrastructure competitor, with ETF flows driving capital rotation between the two assets [T5]. While pure Bitcoin ETF plays are smaller in Asia compared to North America, the structural role of BTC as a non-yielding store of value remains distinct from ETH’s utility-based positioning [T2].
Scenario Framework
- Base Case: The Federal Reserve holds rates through Q3 under Chair Warsh, and ETF flows normalize. Bitcoin consolidates between €60,000 and €80,000, supported by steady institutional accumulation.
- Bullish Case: Positive regulatory developments or macro easing allow ETF inflows to resume at levels exceeding mining supply (2-3x daily production). Bitcoin breaks above €82,000 resistance and targets the €140,000–€160,000 range by mid-2026 [T6].
- Bearish Case: US Treasury yields surge to new highs, increasing the opportunity cost of holding a non-yielding asset. This triggers forced liquidations and ETF outflows, pushing Bitcoin back toward the mid-€60,000 region [T8].
Valuation Discussion
Bitcoin currently trades at approximately 62% of its October 2025 all-time high, reflecting a -37.68% drawdown from the peak [market_data]. Despite the recent correction, the valuation remains supported by structural demand. JPMorgan’s flow-based model suggests the current market cap is undervalued relative to the structural demand created by ETFs and corporate treasuries [T3]. Ark Invest’s aggressive $200,000 target by 2026 implies a premium valuation phase driven by Bitcoin capturing market share from traditional stores of value like gold [T3].
Risks
- Rising Yield Headwinds: Rising US Treasury yields make government debt more attractive, raising the opportunity cost of holding volatile assets like Bitcoin. Analysts note that higher yields are acting as a clear macro headwind, making institutional buyers more selective [T8].
- ETF Redemption Risk: The ETF channel has become central to market structure. When flows reverse, they directly remove marginal demand and signal deteriorating institutional confidence, creating self-reinforcing selling pressure [T6].
- Geopolitical and Macro Uncertainty: Bitcoin remains a high-beta asset during periods of broader market stress. Geopolitical tensions and inflation fears can trigger volatility independent of on-chain fundamentals [T7].
Appendix
Sources
- Crypto Market 2025: Year-End Review & Expert Insights [T1]
- Q2 2026 Digital Asset Review [T2]
- Bitcoin Price Prediction 2026: Institutional Adoption & ETF Impact Analysis [T3]
- BlackRock Bitcoin ETF Achieves Staggering $935M Q1 Inflow Milestone [T4]
- Bitcoin and Ether ETF Inflows Rebound – Blockchain Council [T5]
- Yellow.com: Why Bitcoin ETF Demand Now Trails Daily Mining Supply [T6]
- Bitcoin Price Outlook: ETF Flows, Institutional Demand & Geopolitical Risks [T7]
- US Treasury yields surge to new highs as liquidity tightens, pushing Bitcoin back below $82,000 resistance [T8]
This report is AI-generated for informational purposes only and does not constitute investment advice. The views expressed herein are those of the author and do not reflect the official policy or position of any agency, employer, or company.
Important Note / Wichtiger Hinweis:
EN: This report may have been generated using AI. It processes data from publicly available sources. The content is provided for informational purposes only.DE: Dieser Bericht kann mithilfe von KI erstellt worden sein. Dabei werden Daten aus öffentlich zugänglichen Quellen verarbeitet. Die Inhalte dienen ausschließlich Informationszwecken.
* DE: Die ergänzenden Inhalte können KI-generiert sein. EN: The additional content may be AI-generated.