
Listen to the summary
Key Data Snapshot
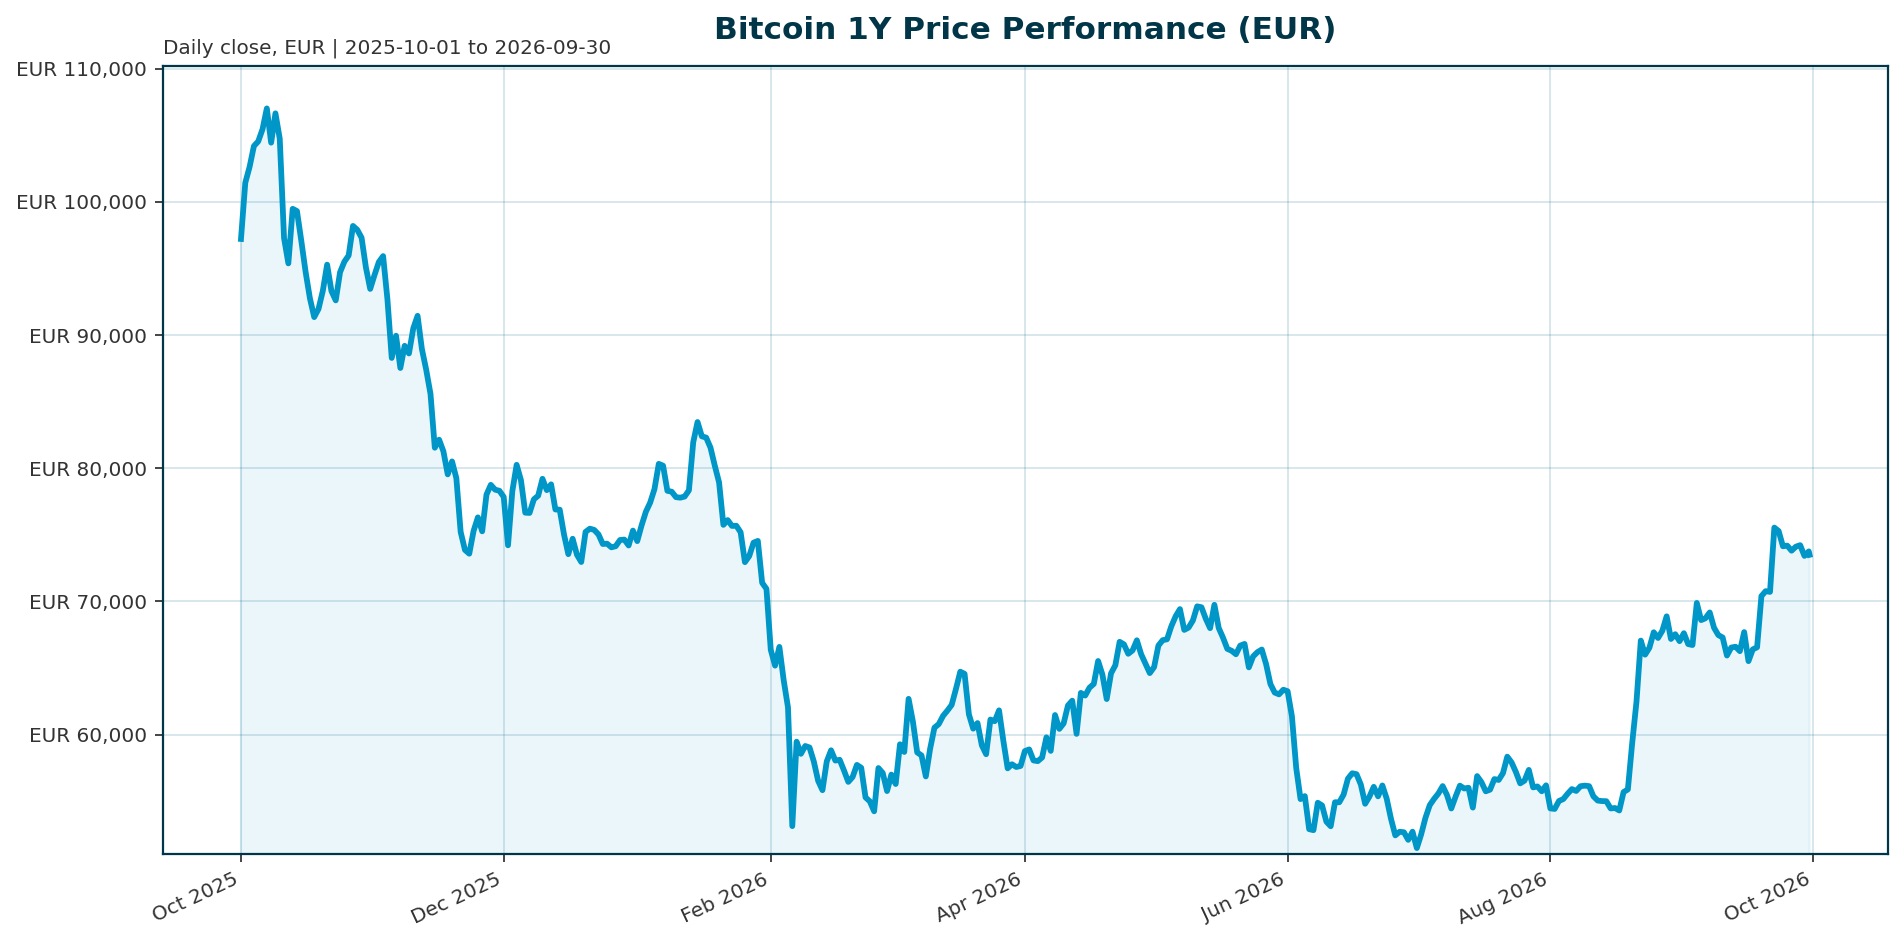
| Metric | Value |
|---|---|
| Price (EUR) | EUR 73,540 |
| 24h range (EUR) | EUR 73,170 – 74,560 |
| Market cap / rank | EUR 1.477tn / #1 |
| 24h volume | EUR 24.91bn |
| Change 24h / 7d | +0.53% / -3.78% |
| Change 14d / 30d | +9.79% / +7.49% |
| Change 200d / 1y | +17.49% / -27.28% |
| ATH / distance | $107,662 (6 Oct 2025) / -31.69% |
| Circulating supply | 20,090,909 BTC (95.67% of 21,000,000 cap) |
| Fully diluted valuation | EUR 1.477tn |
| BTC dominance | 58.28% of EUR 2.531tn total crypto cap |
| Data as of | 2026-09-30 04:15 UTC |
Supply issued: 20,090,909 / 21,000,000 = 95.67%, leaving 909,091 BTC (~4.33%) to be mined. Daily turnover (volume / market cap) is roughly 1.69%, a thin spot turnover consistent with commentary on subdued overall crypto trading volumes [T7].
Market Setup
Cross-asset conditions are neutral rather than supportive. Risk sentiment is neutral and equity momentum is mixed: DACH indicators average +0.17% over five days versus -0.13% for global equity indices, with the Nikkei 225 strongest at +1.65% and the Hang Seng weakest at -1.19%. The rates backdrop is the key constraint: the euro area AAA 10Y yield stands at 3.63%, up 17.9bp over five days, with a steepening curve (10Y-2Y spread at 39.8bp) and the 2Y yield up 112bp year to date at 3.23%. FX is mixed, with EUR/USD at 1.1366 (-0.29% over five days). This backdrop is clearly subordinate to the Bitcoin setup but materially shapes it: the US Federal Reserve under Chair Kevin Warsh is expected to hold rates through Q3 2026, leaving limited room for the policy easing that historically supported risk-asset recoveries [T2], and surging US Treasury yields have raised the opportunity cost of holding a volatile, non-yielding asset such as BTC [T4]. For an EUR-based investor, rising euro yields and a firm euro add a further hurdle on a currency-adjusted basis.
Investment Thesis
Bitcoin has transitioned from a halving-cycle speculative asset to an ETF- and macro-led allocatable asset. Three variables now govern value: market structure, institutional fund flows, and the macro environment, a shift away from the historically dominant four-year halving cycle [T5]. Glassnode described 2025 as Bitcoin’s “institutional supply era”, with 6.7 million BTC held across ETFs, exchanges, and corporate treasuries [T1]. With 95.67% of the 21 million cap already issued, valuation is almost entirely demand-driven, and ETF flows are the marginal price-setter. In Q4 2025 they functioned as Bitcoin’s de facto macro indicator: record outflows from US-listed BTC and ETH ETFs coincided with the break of support near $98,000 [T1].
The near-term picture is a fragile stabilization. BTC trades at EUR 73,540, 31.7% below its October 2025 ATH, with a -27.3% one-year return but positive 14-day (+9.79%) and 30-day (+7.49%) momentum against a -3.78% weekly pullback. Realized volatility has roughly halved, from 84% to 43% per the Glassnode x Fasanara report, supporting the institutionalization narrative, though the same period saw more than $1 trillion of crypto market value erased and BTC lag gold and bonds, a reminder that this remains a high-beta corner of global markets [T1].
Base case: BTC consolidates with ETF flow momentum as the primary swing variable while restrictive rates cap upside. Bull case: sustained inflows plus regulatory progress re-rate BTC toward cited analyst ranges [T3]. Bear case: an outflow regime plus sticky yields repeats the Q4 2025 pattern of support breaks and a 25-30% drawdown [T1].
Bullish Drivers
- ETF flow regime: Weekly inflows surged to $1.92bn in late August 2026, with BlackRock’s IBIT taking a significant share, indicating institutional rather than retail demand [T7]. Daily inflows exceeding $400m were recorded consistently in 2026, including $467m on 5 May, the fourth consecutive positive day [T3, T6].
- Deepening institutional footprint: 94% of institutional investors reportedly recognize the long-term value of blockchain technology, and corporate treasuries increasingly view BTC as a strategic reserve asset [T3].
- Regulatory optionality: The CLARITY Act would establish a federal market-structure framework and could unlock broader institutional participation if passed [T2].
- Forward positioning: Investors appear to be positioning ahead of potential upside rather than reacting to it, with inflows standing out against low broader-market volumes [T7].
- Supply scarcity: With 95.67% of the cap issued and only ~909k BTC left to mine, incremental demand must clear against a nearly fixed float.
Counterpoint: the inflow streak already broke once with a $202m pullback on 28 August, so flow durability is unproven [T8].
Relative Positioning vs Gold and Ethereum
Direct gold and Ethereum price data are unavailable in this bundle; positioning rests on qualitative evidence and dominance data. During the 2025 correction, BTC lagged traditional assets including gold and bonds while retaining high-beta character [T1]. That lag reflected the macro regime: government debt’s improved return profile raised the opportunity cost of non-yielding BTC [T4], and gold retained its diversification mandate at Bitcoin’s expense. If real rates and yield-seeking persist, that pattern can repeat.
Within crypto, BTC retains the core allocation. Its 58.28% dominance of the EUR 2.531tn total crypto market cap and deeper ETF liquidity mean renewed digital-asset inflows would express in BTC first before rotating down the cap curve [T7]. BTC and ETH share ETF-channel beta: the record Q4 2025 outflows came from both BTC and ETH funds, so a flow reversal transmits to both [T1]. Structurally, BTC’s fixed 21 million cap contrasts with gold’s elastic supply response, which argues for long-horizon relative re-rating if the flow regime turns positive [T5, T7]. One regional nuance: Asian institutional adoption is rotating toward tokenization and regulated stablecoins under frameworks such as Hong Kong’s Stablecoins Ordinance, reducing the strategic role of pure bitcoin ETF plays in that region [T2].
Scenario Framework
| Scenario | Triggers | Implication |
|---|---|---|
| Bull | ETF inflows sustain above the ~$400m/day run-rate through the September Treasury buyback launch; CLARITY Act advances [T3, T2, T7] | Re-rating toward the $100,000-$150,000 analyst range, above the prior ATH of $107,662; indicative EUR equivalent at EUR/USD 1.1366 is roughly EUR 88,000 to EUR 132,000 |
| Base | Rates stay restrictive through Q3 2026; flows oscillate around neutral; CLARITY Act remains procedural [T2, T8] | Range-bound trade around the mid-EUR-70,000s, anchored to the $80,000 support / $85,000-$90,000 resistance zone in USD terms [T6]; indicative EUR equivalent of $80,000-$90,000 is roughly EUR 70,400 to EUR 79,200 |
| Bear | Outflow regime returns, yields keep rising, Treasury buyback effects disappoint [T4, T7] | Break of $80,000 support and a repeat of the Q4 2025 pattern of ~25-30% peak-to-trough drawdown, which would reprice BTC toward the low-EUR-50,000s from current levels [T1] |
Note: USD-based levels are translated at the prevailing EUR/USD of 1.1366 for orientation only; actual EUR-denominated outcomes depend on the FX path.
Valuation Discussion
Bitcoin has no cash flows, so valuation rests on scarcity, flow, and comparative reference points. Fully diluted valuation equals market cap at EUR 1.477tn because 95.67% of supply is already circulating; remaining issuance of 909,091 BTC dilutes future holders by only ~4.33% at maximum.
Indicative upside math: cited 2026 analyst ranges run from a conservative $85,000-$132,000 to institutional paths of $100,000-$150,000 [T3]. Translated at EUR/USD 1.1366, the $85,000 floor sits roughly 15% above the indicative USD equivalent of the current EUR price (~$83,600), while the $132,000 upper bound implies roughly +58%. The $100,000-$150,000 band implies roughly +20% to +80%, all FX-translation-dependent. These are third-party promotional-character targets and carry limited reliability.
Risk-adjusted framing: pairing the cited 43% realized volatility [T1] with the -27.28% one-year return yields an approximate return/volatility ratio of about -0.63, a weak risk-adjusted record versus a 3.63% euro AAA 10Y yield that is now earned without drawdown risk. Downside math: a repeat of the Q4 2025 ~30% drawdown from EUR 73,540 lands near EUR 51,500, close to the -31.7% ATH drawdown already embedded. Mean reversion toward the mid-point of the conservative range is modest, arguing for flow confirmation before adding risk.
Risks
- Rates and liquidity: Rising US Treasury yields raise the opportunity cost of non-yielding BTC and have made institutional buyers more selective [T4]. Euro-area yields are also rising with a steepening curve (2Y AAA +112bp YTD), tightening financial conditions for EUR-based allocators.
- Policy constraint: The Fed is expected to hold rates through Q3 2026 under Chair Warsh, limiting the easing that historically supported recoveries [T2].
- Flow-regime reversal: The ETF channel transmits selling as efficiently as buying. The $202m outflow on 28 August ended the inflow streak, and the divergence between flows and spot price suggests other forces, including profit-taking and derivatives positioning, exert pressure [T8]. Concentration in IBIT amplifies single-product flow risk [T7].
- Regulatory uncertainty: The 15 September Senate vote was procedural only; final CLARITY Act passage still requires negotiation over contentious provisions [T8]. BlackRock’s Robert Mitchnick argued the bill matters less for Bitcoin than for altcoins and DeFi, so a stalled bill removes a catalyst without removing Bitcoin’s operational clarity [T8].
- Untested liquidity support: The Treasury’s bond buyback program, cited as a potential regime test, began in September and its liquidity effects are unverified [T7].
- Historical drawdown precedent: Q4 2025 erased more than $1 trillion in crypto market value with a ~30% BTC decline, demonstrating that institutionalization has not eliminated high-beta risk [T1].
Appendix
Data Provenance
Market data retrieved 2026-09-30T04:15:07Z from CoinGecko, quoted in EUR. Market overview data as of 2026-09-28/29, sourced from ECB yield curve data, Frankfurter FX, Yahoo Finance, Wiener Börse, and FMP. News sources retrieved 2026-09-30T04:15:10Z via Tavily.
Definitions and Reconciliations
- Market cap: circulating supply multiplied by price. Fully diluted valuation: max supply multiplied by price; both equal EUR 1.477tn here due to 95.67% issuance.
- ATH: highest historical price, $107,662 on 2025-10-06; ATL: $51.30 on 2013-07-04.
- Dominance cross-check: EUR 1,477.46bn / EUR 2,531.49bn = 58.34%, versus the reported 58.28%; the small gap reflects retrieval timing.
- Market cap 24h change of +EUR 3.98bn (+0.27%) versus price +0.53% reflects rounding and timestamp offsets.
- USD levels cited from news ($80,000-$150,000) are translated at EUR/USD 1.1366 for indicative comparison only. The -27.28% one-year EUR return partly embeds EUR strength (EUR/USD -3.27% YTD).
- Unavailable metrics: gold and Ethereum price data, current ETF flow figures for September 2026, on-chain valuation metrics (MVRV, realized price), and derivative funding data are not in this bundle.
- Volatility figures (84% to 43%) come from a single Glassnode x Fasanara citation without disclosed methodology; treat as indicative.
Sources
- [T1] Crypto Market 2025: Year-End Review & Expert Insights, TradingView: link
- [T2] Q2 2026 Digital Asset Review, CoinDesk Indices: link
- [T3] Bitcoin Price Prediction 2026: Institutional Adoption, Intellectia: link
- [T4] US Treasury yields surge to new highs as liquidity tightens, CryptoSlate: link
- [T5] Bitcoin Price Faces a Pivotal Shift: New Market Structure, Institutional Funds, and Macroeconomics Now Drive Value, CryptoRank: link
- [T6] Bitcoin Price Analysis May 2026, Intellectia: link
- [T7] Bitcoin ETF Inflows Surge to $1.92 Billion Last Week, Cryptonomist: link
- [T8] Bitcoin ETF Inflow Streak Ends With $202 Million Pullback as Senate Vote Looms, BigGo Finance: link
This report is AI-generated, is for informational purposes only, and does not constitute investment advice. Figures may contain errors; readers should verify all data independently before making any investment decision.
Important Note / Wichtiger Hinweis:
EN: This report may have been generated using AI. It processes data from publicly available sources. The content is provided for informational purposes only.DE: Dieser Bericht kann mithilfe von KI erstellt worden sein. Dabei werden Daten aus öffentlich zugänglichen Quellen verarbeitet. Die Inhalte dienen ausschließlich Informationszwecken.
* DE: Die ergänzenden Inhalte können KI-generiert sein. EN: The additional content may be AI-generated.