
Watch the video
This player shows only the Bitcoin chapter of the daily altii market briefing. Watch the full video on tube.altii.de.
Key Data Snapshot
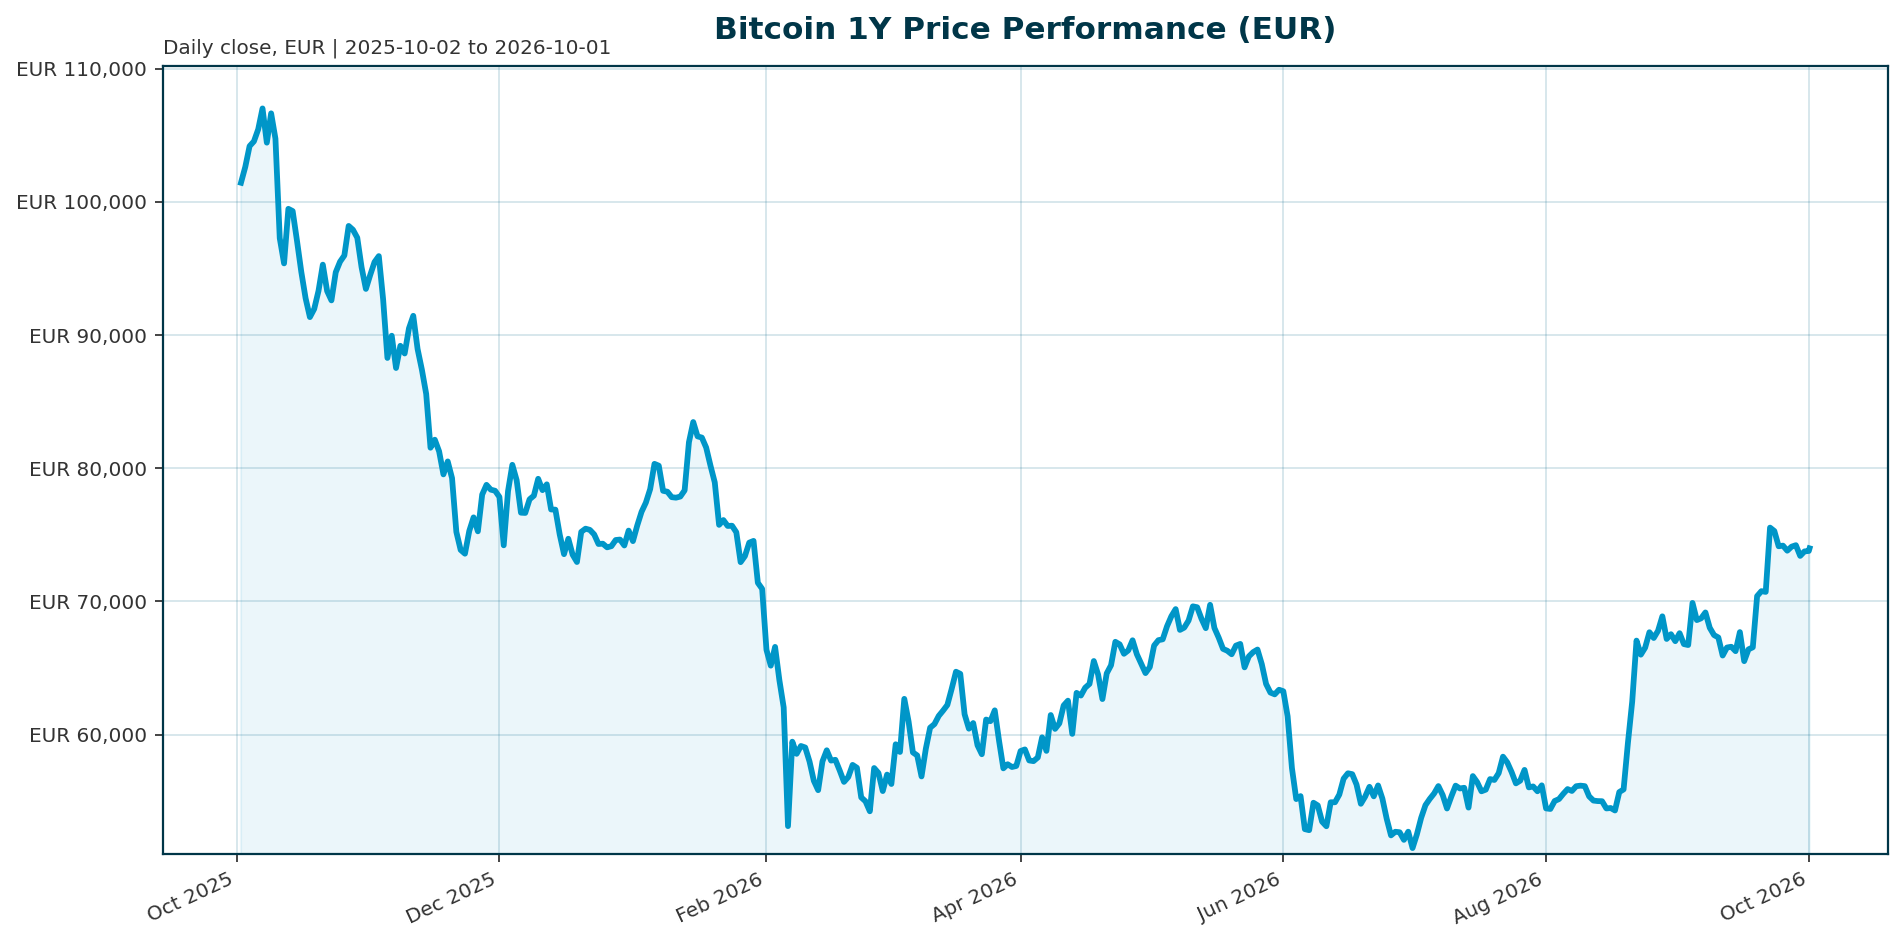
| Metric | Value |
|---|---|
| Price (EUR) | €74,010 |
| 24h Range (EUR) | €73,229 – €75,495 |
| 24h Change | +0.63% |
| 7d / 14d / 30d Change | -0.76% / +9.70% / +6.74% |
| 200d / 1y Change | +17.04% / -26.75% |
| Market Cap | €1,486.98bn (Rank 1) |
| 24h Volume | €31.29bn (2.10% of market cap) |
| Share of Total Crypto Volume | 35.12% (€31.29bn of €89.10bn) |
| BTC Dominance | 58.27% |
| Total Crypto Market Cap | €2,543.43bn |
| Circulating / Max Supply | 20,090,909 / 21,000,000 (95.67% issued) |
| Fully Diluted Valuation | €1,486.98bn (ratio to market cap: 1.00) |
| All-Time High (EUR) | €107,662 on 2025-10-06; current drawdown -31.26% |
| All-Time Low (EUR) | €51.30 on 2013-07-04 |
| Implied USD Price | ~$84,012 (€74,010 × 1.1352 EUR/USD, derived estimate) |
| Data Retrieved | 2026-10-01T04:15Z |
Calculation notes: daily turnover = €31.29bn / €1,486.98bn = 2.10%. Distance to ATH retest = (€107,662 − €74,010) / €74,010 = +45.47%. Remaining supply to mine = 909,091 BTC (4.33% of cap).
Market Setup
BTC trades in a neutral risk environment with mixed equity momentum: the Nikkei 225 leads global indices over five days at +3.27% while the Euro Stoxx 50 lags at -0.95%, and DACH indicators average -0.32% over five days versus +0.43% globally. The rates backdrop is the main macro constraint: euro area AAA yields are mixed with a steepening curve (10Y at 3.61%, +8.4bp over five days; the 2Y is up 110bp year to date; the 10Y-2Y spread sits at 39.7bp). FX is mixed, with EUR/USD at 1.1352 (-0.42% over five days, -3.39% YTD). This context is secondary to the crypto-specific regime: Bitcoin now trades in an ETF- and macro-led market where regulated flows and regulatory clarity dominate sentiment [T1][T5], and the Fed under Chair Kevin Warsh is expected to hold rates through Q3, limiting the policy-easing tailwind that historically supported risk-asset recoveries [T2]. Elevated Treasury yields continue to compete with speculative assets for capital [T3].
Investment Thesis
Bitcoin’s price is no longer governed primarily by the four-year halving cycle. Analysis now identifies three drivers: a new market structure built around regulated vehicles, institutional fund flows, and the macroeconomic environment [T5]. The structural evidence is substantial. Roughly 6.7 million BTC sit across ETFs, exchanges and treasuries, a level Glassnode describes as Bitcoin’s “institutional supply era” [T1]. Institutional entities hold approximately 18.5% of the 21 million coin cap [T8], and volatility has compressed from 84% to 43%, consistent with maturation into a more stable institutional asset [T1]. ETF flows have effectively become Bitcoin’s macro indicator: record Q4 2025 outflows coincided with the break of the $98,000 support and a retest of the low $90,000s [T1].
Against that structure, the current price of €74,010 sits 31.26% below the October 2025 ATH of €107,662, within the aftermath of a Q4 2025 episode that erased more than $1 trillion in market value on a nearly 30% peak-to-trough decline [T1]. The balance of evidence is constructive but conditional: after a difficult first half, 2026 year-to-date US spot ETF flows flipped positive, with an eight-day inflow streak signalling broad but measured institutional demand [T3]. The base case is consolidation with positive drift, contingent on flows staying positive and the CLARITY Act or monetary easing providing the next catalyst [T2][T3]. The bear case is a repeat of the Q4 2025 flow-reversal dynamic, which broke key supports despite structural adoption.
Bullish Drivers
- Regulated access channel. US spot ETFs, approved in early 2024, created a compliant pathway for traditional capital and demystified Bitcoin for institutional and retail investors who avoided crypto-native venues [T5].
- Positive flow momentum in 2026. Year-to-date ETF flows flipped from negative to positive, a meaningful milestone after a difficult H1. The inflow streak extended to eight days, with demand characterized as broad but not frantic, a pattern historically consistent with sustainable trends [T3].
- Institutional permanence. BlackRock’s $284m single-day inflow and Morgan Stanley’s market entry (single-source figures) indicate BTC is treated as a permanent portfolio line item [T4]. IBIT was the fastest ETF in history to reach $10bn AUM, in 49 trading days [T8].
- Flow-price causality. ETF inflows have typically preceded price appreciation by 24 to 48 hours; steady flows with contained funding rates and open interest indicate a market dominated by long-term capital rather than speculative excess [T4].
- Regulatory catalysts. The CLARITY Act would establish a federal market-structure framework and could unlock broader institutional participation [T2]. In Asia, adoption is shifting from pilots to targeted deployment via tokenization and stablecoin frameworks such as Hong Kong’s Stablecoins Ordinance [T2].
- Supply scarcity. 95.67% of the 21 million cap is issued, leaving roughly 909,091 BTC to mine, with about 18.5% of supply already in institutional hands [T8].
Relative Positioning vs Gold and Ethereum
Live gold and ethereum pricing was not available in the data bundle at generation time, so this comparison is qualitative. In 2025’s bearish correction, Bitcoin lagged traditional assets such as gold and bonds, a reminder that even in the institutional era it remains a high-beta corner of global markets [T1]. Its compressed volatility of 43%, down from 84%, is still far above gold’s typical profile, which anchors BTC in the risk-asset tier rather than the safe-haven tier [T1]. Within crypto, BTC remains the core allocation: 58.27% dominance of a €2,543.43bn complex and 35.12% of total crypto volume. Ethereum’s institutional treatment has been correlated with Bitcoin’s, as BTC and ETH ETFs saw joint record outflows in Q4 2025 [T1], supporting a core-satellite allocation framework in which BTC is the anchor and ETH the higher-beta satellite. One relative-demand consideration: Asia’s institutional adoption emphasizes tokenization and stablecoins over pure bitcoin ETFs [T2], a structural difference from North American and European channels. The base case positions BTC between gold (safe haven) and ETH (higher crypto beta); the bull case is continued volatility compression narrowing the risk gap with gold; the bear case is renewed risk-off correlation with high-beta assets rather than gold, as observed in 2025 [T1].
Scenario Framework
- Bull scenario. Explicit assumptions: the CLARITY Act passes or the Fed pivots to easing, and ETF flows accelerate from the current measured pace toward the record sessions seen earlier in 2026 [T2][T3]. With flows leading price by 24 to 48 hours [T4], BTC would first challenge the USD $85,000 to $90,000 zone referenced as the post-$80,000 breakout target in May 2026 [T7], then the €107,662 ATH, implying roughly +45% in EUR terms. April 2026’s $70,000 touch shows how quickly sentiment events can move price [T6].
- Base scenario. Explicit assumptions: the Fed holds through Q3 [T2], no regulatory shock occurs, and the eight-day inflow streak persists at a measured pace [T3]. BTC ranges with positive drift, extending the +9.70% 14-day recovery without breaking out. Note the 7-day change of -0.76% flags a recent-week stall within the recovery leg.
- Bear scenario. Explicit assumptions: the year-to-date flow flip proves temporary and the Q4 2025 pattern repeats, with record ETF outflows breaking key supports as they did at $98,000 and the low $90,000s [T1]. A macro or geopolitical shock on top of that would retest cycle lows near the $70,000 (USD) area touched in April 2026 [T6].
Valuation Discussion
Bitcoin has no cash-flow-based valuation; the framework rests on scarcity economics, flow sensitivity and drawdown positioning. Key metrics: market cap of €1,486.98bn equals fully diluted valuation because 95.67% of supply is issued, limiting dilution risk to about 4.3% of the cap. Price is 31.26% below the ATH versus +17.04% over 200 days and -26.75% over one year, characterizing a mid-cycle drawdown rather than capitulation. Daily turnover of 2.10% of market cap and a 35.12% share of crypto volume indicate deep relative liquidity, though the 1-year EUR figure conflates asset drawdown with FX moves and cannot be decomposed without a USD price series. Institutional holdings of roughly 18.5% of supply [T8] reduce free float available to new demand, which supports prices in accumulation phases and amplifies outflows in reversals. Volatility at 43% versus 84% historically [T1] improves risk-budget math for institutional allocation. The fair-value anchor in the base case is the current consolidation zone: without a flow inflection, pricing around €74,000 is broadly consistent with the current institutional demand run-rate. The bull case requires a regulatory or monetary catalyst to justify a re-rating toward the ATH region (+45.47%); the bear case repeats the Q4 2025 drawdown dynamic of roughly 30% from any renewed local high [T1].
Risks
- Rates headwind. Elevated Treasury yields compete for capital [T3]; euro area AAA 2Y yields are up 110bp year to date with a steepening curve, raising the opportunity cost of holding zero-yield assets.
- Policy constraint. The Fed is expected to hold through Q3 under Chair Warsh, removing the easing tailwind that historically supported risk-asset recoveries [T2].
- Flow-reversal risk. ETF dependence cuts both ways: record Q4 2025 outflows broke key supports [T1]. Concentration of roughly 18.5% of supply in institutional hands can amplify outflow dynamics [T8].
- Residual high-beta character. Despite institutionalization, BTC lagged gold and bonds in 2025 and returned -26.75% over one year in EUR terms [T1].
- Regulatory risk. The CLARITY Act may fail or be diluted; regulatory uncertainty continues to constrain short-term price growth [T2][T8].
- FX risk for EUR investors. EUR/USD at 1.1352 with -3.39% YTD moves means EUR-denominated returns differ materially from USD outcomes; EUR appreciation would erode USD-denominated BTC gains.
- Correlation risk. The strengthened correlation between spot price and ETF flows concentrates market sensitivity in a single channel [T4].
- Tail risk. A geopolitical shock, such as the April 2026 Iran ceasefire whipsaw [T6], combined with correlated BTC-ETH ETF outflows, would compound drawdowns beyond the base-case range. Mitigant: volatility compression and institutional absorption [T1][T4] could dampen single-trigger severity.
Appendix
Data Provenance
Market data retrieved 2026-10-01T04:15Z via CoinGecko; quote currency is EUR. Equities data as of 2026-09-30 (Yahoo, Wiener Boerse, FMP), ECB AAA yield curve as of 2026-09-29, FX via Frankfurter as of 2026-10-01. Benchmark assets are defined as gold and ethereum per the report profile; live benchmark pricing was unavailable in this bundle. News items were undated in their published_at fields; several describe April to May 2026 conditions and may be stale relative to the 2026-10-01 report date. Flow figures from single sources (for example the $467m May 5 inflow and the $284m BlackRock day) are labelled as single-source. The implied USD price of ~$84,012 is derived from the EUR quote and EUR/USD spot, not an independent USD feed, and FX timing mismatches could introduce small errors. Computed BTC dominance of 58.49% (€1,486.98bn / €2,543.43bn) differs slightly from the reported 58.27%, likely due to USD-converted caps in the source metric. No on-chain metrics (funding rates, open interest, hash rate, exchange balances) were available in the bundle; structure commentary relies on the flow narrative in the cited sources.
Definitions
- FDV: Fully diluted valuation, market cap if max supply were in circulation.
- BTC dominance: Bitcoin’s share of total crypto market capitalization.
- Halving cycle: The roughly four-year pattern of price surges 12 to 18 months after each halving, now potentially superseded by institutional flow dynamics [T5].
- ETF creation/redemption: The mechanism by which ETF shares are issued or withdrawn, transmitting institutional demand to spot markets.
- CLARITY Act: Pending US legislation that would establish a federal market-structure framework for digital assets [T2].
Sources
- [T1] Crypto Market 2025: Year-End Review & Expert Insights. tradingview.com
- [T2] Q2 2026 Digital Asset Review. coindesk.com
- [T3] Bitcoin ETF Inflows Signal Steady Demand Amid Market Headwinds. blog.e8markets.com
- [T4] Bitcoin Price Analysis April 2026. intellectia.ai
- [T5] Bitcoin Price Faces a Pivotal Shift: New Market Structure, Institutional Funds, and Macroeconomics Now Drive Value. cryptorank.io
- [T6] Bitcoin (BTC) price touches $70,000 as ETF inflows signal institutional interest: Crypto Daybook Americas. coindesk.com
- [T7] Bitcoin Price Analysis May 2026. intellectia.ai
- [T8] The End of Bitcoin’s Four-Year Cycle? How ETFs and Institutions Are Reshaping the Market. wolfandco.com
This report is AI-generated and provided for informational purposes only. It does not constitute investment advice, a recommendation, or an offer to buy or sell any financial instrument. Data may be incomplete or inaccurate, and readers should conduct their own due diligence before making any investment decision.
Important Note / Wichtiger Hinweis:
EN: This report may have been generated using AI. It processes data from publicly available sources. The content is provided for informational purposes only.DE: Dieser Bericht kann mithilfe von KI erstellt worden sein. Dabei werden Daten aus öffentlich zugänglichen Quellen verarbeitet. Die Inhalte dienen ausschließlich Informationszwecken.
* DE: Die ergänzenden Inhalte können KI-generiert sein. EN: The additional content may be AI-generated.