
Listen to the summary
Key Data Snapshot
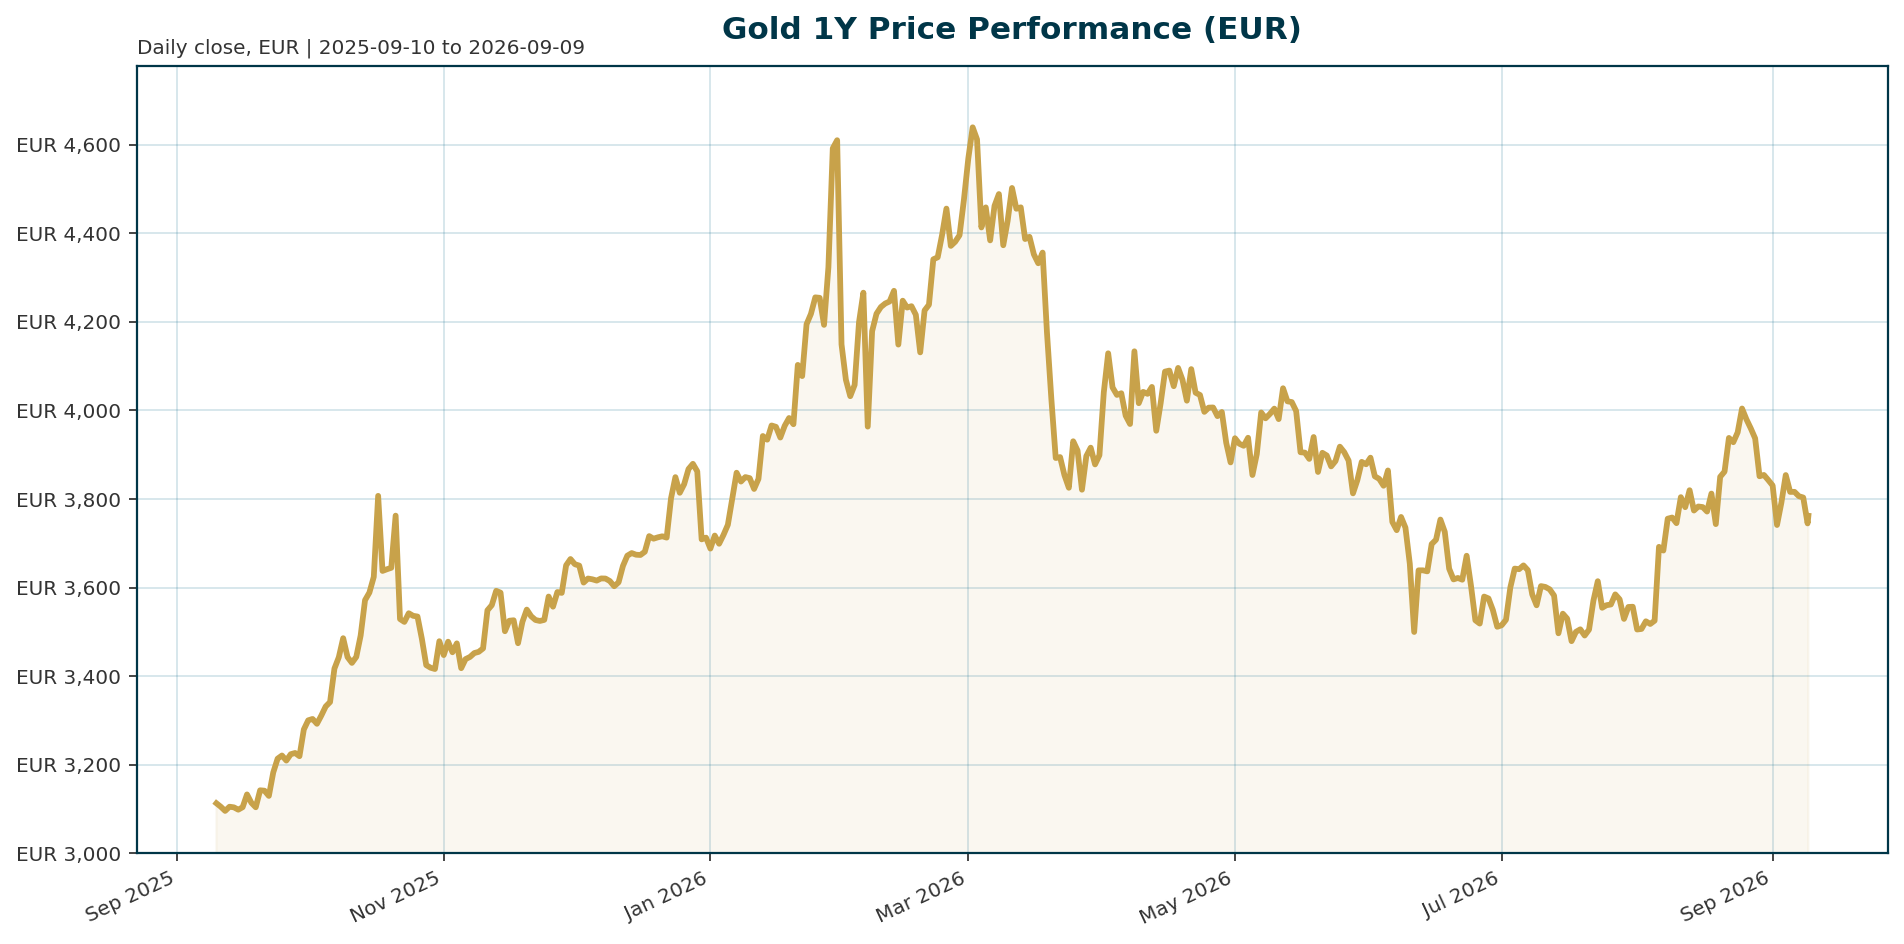
Gold trades at 3,761.02 EUR, reflecting a -1.51% pullback over the last 24 hours. Despite the recent dip, the metal remains up 19.7% year-to-date and is 19.8% below its January 2026 all-time high of 4,688.32 EUR. The market cap stands at approximately 1.63 billion EUR with a 24-hour volume of 115 million EUR. Bitcoin dominance is 58.41%, highlighting Gold’s continued status as the primary reserve asset.
| Metric | Value |
|---|---|
| Current Price (XAU/EUR) | 3,761.02 EUR |
| 24h Change | -1.51% |
| 1Y Change | +19.70% |
| ATH (Jan 2026) | 4,688.32 EUR (-19.78%) |
| BTC Dominance | 58.41% |
| Market Cap | 1.63B EUR |
Calculation: Distance to $5,000 target approx 32.8% based on current 3,761.02 EUR price.
Macro Backdrop
Risk sentiment is neutral while euro area yields remain mixed. The Euro Area AAA 10Y yield sits at 3.39%, moving 3.4 basis points over five days. FX markets are mixed with EUR/USD at 1.1625. Key observations show the ATX leading global equities with a 2.22% five-day move, while the Hang Seng lags at 0.21%. This complex backdrop suggests investors are cautious ahead of macro data.
Investment Thesis
Societe Generale remains “strategically bullish” on gold, citing a post-2022 regime shift where structural factors like dedollarization and geopolitical risk have created a higher price floor. This decouples gold from traditional real yield correlations, allowing the metal to trade near record highs despite persistently positive real yields [T3, T8]. The thesis posits that gold is no longer a purely cyclical play on interest rates but a structural reserve asset supported by sovereign demand.
Bullish Drivers
- Structural Central Bank Demand: A record 43% of 73 global monetary authorities plan to increase reserves over the next year. This is driven by geopolitical risks, sanctions vulnerability, and a desire to reduce dollar concentration [T8].
- Real Yield Resilience: Despite real yields on the 10-year TIPS sitting around 2%, SocGen notes this level is well inside the band where gold has historically compounded, limiting the downside impact of elevated rates [T2, T3].
- Hot Money Inflows: While ETF inflows have moderated, “hot money” is beginning to wake up, with analysts suggesting the market is not yet saturated with speculative capital [T2].
Relative Positioning vs Bitcoin and Ethereum
With Bitcoin dominance at 58.41%, BTC remains the dominant risk asset. However, gold maintains its status as the primary reserve asset. Amundi Investment Institute notes that traditional correlations are breaking down, offering gold portfolio diversification benefits that crypto assets may not provide in a risk-off environment [T4].
Scenario Framework
- Bullish Scenario: The Federal Reserve signals further cuts, real yields fall below 2%, and the EUR strengthens against the USD. This would likely trigger a rally to test the $5,000 psychological level or the January ATH of 4,688.32 EUR [T2, T7].
- Bearish Scenario: The Fed holds rates or hikes further, real yields spike above 2.5%, and the USD strengthens. This would increase the opportunity cost of holding gold, leading to consolidation or a deeper correction below 3,700 EUR [T1, T5].
Valuation Discussion
Gold is 19.8% below its January ATH of 4,688.32 EUR. However, the 6% year-to-date gain suggests the market is pricing in a “hot money” inflow phase. The macro backdrop looks more balanced this year as the easing cycle is priced in, making further explosive gains less likely than in 2025 but the structural floor remains intact [T5, T7].
Risks
- Real Yield Dynamics: A sharp reversal in monetary policy could lead to a rapid rise in real yields, placing immediate pressure on gold prices [T1].
- Inflation Persistence: Energy price shocks could keep inflation sticky, complicating the Fed’s path to easing and keeping real yields elevated for longer [T5].
- Profit Taking: Gold is up roughly 6% year-to-date, leaving the market vulnerable to bouts of profit-taking, particularly if short-term momentum stalls [T5].
Appendix
Sources
- Gold approaches macro inflection as PCE data tests Fed outlook [T1]
- Central Banks Are Snapping Up Gold, ETF Investors Are Just Waking Up [T2]
- It’s time to get bullish on gold again, says SocGen [T3]
- Gold suffers worst quarter in 13 years amid interest rate hike fears [T4]
- Geopolitics alone isn’t enough to lift gold [T5]
- Gold’s Dual Drivers: Central Bank Flows and Real Yields [T6]
- Gold 2026 Outlook: Fundamental XAU/USD analysis [T7]
- Is it a golden era for gold? [T8]
This report is AI-generated for informational purposes only and does not constitute investment advice. Please consult a qualified financial advisor before making investment decisions.
Important Note / Wichtiger Hinweis:
EN: This report may have been generated using AI. It processes data from publicly available sources. The content is provided for informational purposes only.DE: Dieser Bericht kann mithilfe von KI erstellt worden sein. Dabei werden Daten aus öffentlich zugänglichen Quellen verarbeitet. Die Inhalte dienen ausschließlich Informationszwecken.
* DE: Die ergänzenden Inhalte können KI-generiert sein. EN: The additional content may be AI-generated.