
Listen to the summary
Key Data Snapshot
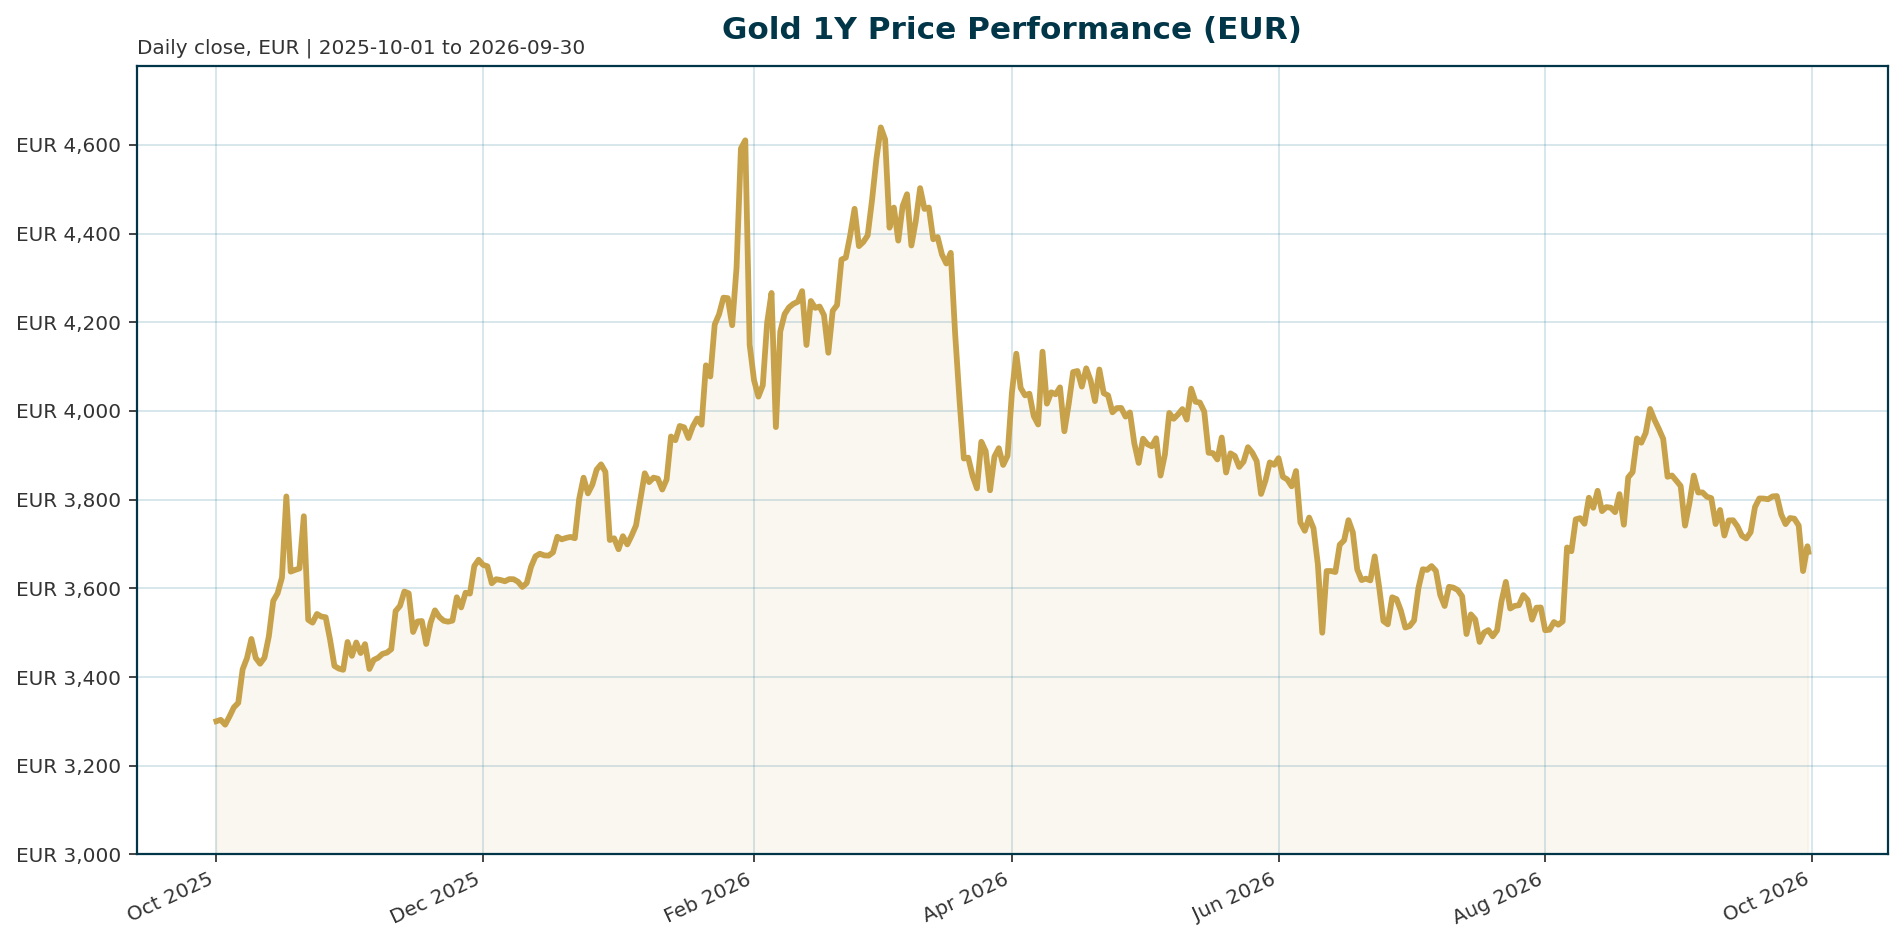
Data retrieved 2026-09-30 04:29 UTC. Asset: Gold (XAU), quoted in EUR. Note that instrument-level figures derive from a tokenized gold proxy (PAX Gold) and should not be read as metrics for the global physical gold market.
| Metric | Value | Note |
|---|---|---|
| Price | 3,694.22 EUR | Near 24h high of 3,699.51 |
| 24h change | +1.40% | 1h change: -0.18% |
| 7d / 14d / 30d change | -3.48% / -3.31% / -5.39% | Corrective trend on all horizons |
| 200d / 1y change | -16.96% / +8.27% | Positive YoY, deep multi-month drawdown |
| 24h range | 3,648.74 to 3,699.51 EUR | Range of 50.77 EUR, or 1.39% of the low |
| All-time high | 4,688.32 EUR (2026-01-28) | Drawdown of -21.20%; 994.10 EUR below peak |
| All-time low | 1,265.28 EUR (2019-11-17) | +191.97% above the low |
| Proxy market cap / 24h volume | 1.61bn EUR / 129.3m EUR | Volume-to-cap ratio: 8.04% |
| Circulating / total supply | 435,300.59 tokens each | Implied price: 1,608,081,638 / 435,300.59 = 3,694.22 EUR (consistent) |
| Euro AAA 2Y / 10Y / 30Y yield | 3.23% / 3.63% / 3.84% | 10Y up 17.9 bp over 5 days; 10Y-2Y spread 39.8 bp |
| EUR/USD | 1.1366 | -0.29% over 5 days; -3.27% YTD |
| BTC dominance / total crypto cap | 58.28% / 2.53 trillion EUR-equiv | Crypto context only; direct BTC/ETH data unavailable |
Calculation notes: upside required to regain the ATH is 4,688.32 / 3,694.22 – 1 = 26.91%. The 30d versus 1y performance gap is 8.27 – (-5.39) = 13.65 percentage points, showing how sharply momentum has deteriorated within a still-positive annual trend.
Macro Backdrop
Risk sentiment is neutral, equity momentum is mixed, and DACH indicators are broadly in line with global peers (DACH average +0.17% over five days versus -0.13% globally). Nikkei 225 leads the five-day board at +1.65% while Hang Seng lags at -1.19%. The rates backdrop is the dominant macro signal: euro yields are rising and the curve is steepening, with the Euro Area AAA 10Y yield at 3.63%, up 17.9 bp over five days, and the 10Y-2Y spread at 39.8 bp. The FX backdrop is mixed, with EUR/USD at 1.1366, down 0.29% over five days. For a EUR-based investor this means the opportunity cost of holding non-yielding gold has risen materially, and no strong safe-haven impulse is coming from risk appetite alone.
The gold-specific transmission is well documented in current research. Higher real yields raise the opportunity cost of holding an asset with no coupon or income, and a stronger dollar associated with higher US rates adds further pressure [T7]. Energy-price shocks linked to geopolitical tension complicate the inflation outlook and the path of monetary easing, so macro forces, not geopolitics alone, are driving gold prices [T1]. In the longer run, elevated public debt-to-GDP ratios in advanced economies raise the odds of financial repression, inflation, and currency depreciation, all regimes in which gold historically outperforms [T4].
Investment Thesis
The thesis is a structural tailwind against a tactical headwind. Structurally, gold remains anchored by reserve diversification: Societe Generale identifies central bank buying as a dominant and structural factor that provides a consistent floor under prices and reduces gold’s sensitivity to short-term rate expectations [T3]. A record 43% of 73 global monetary authorities expect their own gold reserves to increase over the next year [T5], and the macro context still favours real assets amid fiscal uncertainty and gradual erosion of purchasing power [T6].
Tactically, the picture is less friendly. Gold in EUR is down 5.39% over 30 days and 16.96% over 200 days, sitting 21.20% below its January 2026 high. Rising euro yields and a possibly higher-for-longer Fed keep real yields elevated [T1]. The market has also demonstrated regime change: despite US ten-year real yields rising from around -1.2% to +2.5% between 2022 and 2023, gold was little changed in 2022 and returned +13% in 2023, evidence that reserve flows can decouple gold from the simple real-yield relationship [T2][T5]. Base case: gold is a strategic diversifier with tactical yield headwinds, not a one-way momentum trade. Positioning should treat the current bounce as corrective within a consolidation, with direction determined by real yields and reserve-flow signals rather than headlines.
Bullish Drivers
- Real-yield relief. The bull case requires one of three triggers: a dovish central-bank pivot before inflation is fully controlled, inflation moderating without aggressive tightening, or real yields falling as economic weakness outpaces policy response [T8]. Any of these lowers the opportunity cost of bullion and invites capital rotation back into the asset.
- Structural official-sector demand. Central bank purchases, particularly from emerging economies diversifying away from the dollar, absorb supply and put a floor under prices [T3]. Nations facing sanctions risk and volatile inflation are increasing reserve allocations to gold [T5].
- Fiscal and repression risk. Sustained moves toward negative real rates in high-debt economies would be a powerful structural tailwind [T4]. A stagflationary mix of slower growth and persistent inflation is supportive for gold over the longer term [T1].
- EUR translation cushion. EUR/USD is down 0.29% over five days and 3.27% YTD. If USD gold is stable, euro-based investors record positive local-currency returns from FX alone.
- Buy-the-dip flow. Any deeper pullback would likely attract buyers, particularly from central banks and longer-term investors [T1].
Relative Positioning vs Bitcoin and Ethereum
The bundle provides crypto-market context but no direct BTC or ETH price, return, volatility or flow data; relative conclusions must remain qualitative. BTC dominance stands at 58.28%, and total crypto market capitalisation is approximately 2.53 trillion with 99.2 billion in 24h volume. Gold’s tokenized proxy carries a 1.61bn EUR market cap, which is an instrument-level figure and not comparable to aggregate crypto capitalisation.
Institutionally, gold holds a reserve-asset advantage. Its demand base includes central banks, which do not participate in crypto markets, and its pricing channel runs through real yields and reserve management rather than risk liquidity [T3][T5]. Bitcoin and Ethereum, by contrast, trade as risk-liquidity assets: with risk sentiment neutral and equity momentum mixed, there is no clear rotation impulse between the complex and bullion today. In a rising real-yield environment gold faces direct opportunity-cost pressure, while crypto performance cannot be quantified from this bundle. If policy credibility, sanctions risk, or reserve diversification dominate the agenda, gold’s institutional role strengthens relative to crypto; in a broad risk-on liquidity expansion, BTC and ETH would likely compete more aggressively for marginal capital. Direct BTC and ETH performance data are required before making any quantified relative-value call.
Scenario Framework
- Base case (consolidation). Gold trades sideways in EUR as structural reserve demand offsets rising euro yields and neutral risk sentiment. Euro Area 10Y yields near 3.63% cap upside, while official-sector buying limits downside. Range anchored by the 3,648-3,700 EUR zone near term and the 21.20% ATH drawdown as the broader context.
- Bull case. Real yields fall on a dovish pivot or growth weakness; EUR/USD extends its decline from 1.1366; central-bank accumulation stays visible; fiscal or repression fears intensify. Gold re-rates toward, and potentially beyond, the 4,688.32 EUR ATH, requiring 26.91% upside from the current level.
- Bear case. Energy-led inflation keeps the Fed, ECB and other major central banks restrictive [T8]; real yields rise further; the USD strengthens; ETF or physical demand deteriorates [T6]; official-sector buying moderates as higher prices inflate the value of existing reserves [T2]. Gold breaks below the 30d trend and extends the 200d drawdown of -16.96%.
- Tail risk. Sovereign reserve liquidation. The US, Germany and Italy held approximately 8,133, 3,350 and 2,451 tonnes of official gold reserves as of December 2025. Any major sovereign selling to stabilise public finances would create a supply shock and undermine the central-bank demand floor [T8].
Valuation Discussion
Gold offers no cash flows, so valuation rests on opportunity cost, flow support and regime framing rather than discounted income. The current drawdown of 21.20% from the 4,688.32 EUR ATH resets the entry point but is not by itself a valuation signal; if real yields stay elevated, a cheaper price does not make a non-yielding asset cheap. The Euro Area AAA 10Y yield of 3.63% serves as the EUR opportunity-cost benchmark, and its 17.9 bp five-day rise has coincided with gold’s -3.48% weekly decline.
Two valuation offsets deserve weight. First, the real-yield model has understated gold before: in 2022-2023, real yields surged to post-2008 highs yet gold returned +13% in 2023, because reserve diversification decoupled price from opportunity cost [T5]. If official demand remains persistent, traditional real-yield fair-value estimates likely understate the price. Second, the same mechanism carries a valuation cap: as gold prices rise, the value of existing central-bank reserves increases, which could eventually moderate official buying and compress the structural premium embedded in the price [T2]. On balance, valuation looks neutral: a meaningful drawdown with intact structural support, but no positive carry and a rising yield hurdle for EUR holders.
Risks
- Higher-for-longer real yields. A restrictive Fed keeping real yields elevated is the primary headwind; a slower-than-expected easing cycle would cap upside [T1][T6].
- Oil-driven inflation persistence. Energy shocks that keep central banks tight raise the opportunity cost of bullion; in the current cycle the tightening signal has dominated the geopolitical haven signal [T7][T8].
- Stronger USD and risk-on rotation. A broad risk-on environment reduces hedging demand, and a stronger dollar adds direct pressure [T2].
- Official-demand moderation. Central-bank buying may slow as rising prices inflate reserve values [T2]; a prolonged decline in ETF demand or weaker physical demand such as jewellery would not be fully offset [T6].
- Reserve liquidation tail. Sovereign sales from the roughly 8,133-tonne US, 3,350-tonne German, or 2,451-tonne Italian stockpiles would weaken the structural floor [T8].
- Trend and positioning risk. Negative 30d and 200d performance suggests momentum and positioning are already working against longs; the +1.40% daily bounce is unconfirmed by weekly trends.
- FX ambiguity. The FX backdrop is mixed; a EUR recovery versus USD would subtract from EUR-denominated gold returns even if USD gold holds steady.
Appendix
Methodology and Caveats
The market data in this report refers to a tokenized gold proxy (coingecko_id: pax-gold), not the global physical gold market. Market cap, supply, rank and volume figures describe the instrument only and were used solely as liquidity context. Market data retrieved 2026-09-30T04:29:37Z; market overview generated 2026-09-30T04:29:45Z with an empty errors array. The news query was “Gold central banks reserves real yields inflation monetary policy macro backdrop”. All Tavily source publication dates are null, so timing precision on source claims is limited. No direct real-yield time series, inflation-expectation series, central-bank purchase tonnage, ETF flow, jewellery demand, futures positioning, oil price, or USD gold spot data were provided; the real-yield analysis is therefore qualitative and based on cited source summaries. EUR-denominated performance mixes bullion and FX effects, which cannot be decomposed without USD gold spot. Direct BTC and ETH performance metrics are unavailable, so relative positioning remains qualitative.
Calculations
- Distance to ATH: 4,688.32 – 3,694.22 = 994.10 EUR; drawdown 3,694.22 / 4,688.32 – 1 = -21.20%.
- Upside to regain ATH: 4,688.32 / 3,694.22 – 1 = +26.91%.
- 24h range: 3,699.51 – 3,648.74 = 50.77 EUR, equal to 1.39% of the low.
- Proxy consistency check: 1,608,081,638 / 435,300.59 = 3,694.22 EUR per token (matches spot).
- Volume-to-market-cap: 129,341,009 / 1,608,081,638 = 8.04%.
- Euro 10Y-2Y spread: 3.6313 – 3.2330 = 39.83 bp; Euro 30Y-2Y spread: 3.8430 – 3.2330 = 61.00 bp.
- 30d vs 1y performance gap: 8.27 – (-5.39) = 13.65 percentage points.
Sources
- [T1] Geopolitics alone isn’t enough to lift gold, ING THINK: https://www.ing.com/articles/geopolitics-alone-isnt-enough-to-lift-gold
- [T2] Gold in review from pure macro trade to cornerstone asset, Saxo: https://www.home.saxo/content/articles/commodities/gold-in-review-from-pure-macro-trade-to-cornerstone-asset-17122025
- [T3] Gold’s Dual Drivers: Central Bank Flows and Real Yields, According to Societe Generale, CryptoRank: https://cryptorank.io/news/feed/e43c1-gold-central-bank-flows-real-yields-societe-generale
- [T4] Report: Central Banks Now Hold More Gold Than Treasuries, CEOWORLD magazine: https://ceoworld.biz/2026/06/15/report-central-banks-now-hold-more-gold-than-treasuries-what-that-means-for-global-capital-and-currencies
- [T5] Is it a golden era for gold?, J.P. Morgan Private Bank U.S.: https://privatebank.jpmorgan.com/nam/en/insights/markets-and-investing/is-it-a-golden-era-for-gold
- [T6] Gold’s slowdown doesn’t signal a reversal, Lombard Odier: https://www.lombardodier.com/insights/2026/may/gold-s-slowdown.html
- [T7] Global monetary tightening: Energy shocks put inflation back in focus, LSEG: https://www.lseg.com/en/insights/data-analytics/global-monetary-tightening-energy-shocks-put-inflation-back-in-focus
- [T8] Gold Declined 10% Over Two Weeks on Rising Oil Prices and Interest Rate Pressure, Crux Investor: https://www.cruxinvestor.com/posts/gold-declined-10-over-two-weeks-on-rising-oil-prices-and-interest-rate-pressure-is-the-safe-haven-case-still-valid
Disclaimer: This report is AI-generated and for informational purposes only. It does not constitute investment advice, a recommendation, or an offer to buy or sell any security or asset. Readers should conduct their own research and consult a licensed financial advisor before making investment decisions.
Important Note / Wichtiger Hinweis:
EN: This report may have been generated using AI. It processes data from publicly available sources. The content is provided for informational purposes only.DE: Dieser Bericht kann mithilfe von KI erstellt worden sein. Dabei werden Daten aus öffentlich zugänglichen Quellen verarbeitet. Die Inhalte dienen ausschließlich Informationszwecken.
* DE: Die ergänzenden Inhalte können KI-generiert sein. EN: The additional content may be AI-generated.