
Listen to the summary
Key Data Snapshot
| Metric | Value | Change |
|---|---|---|
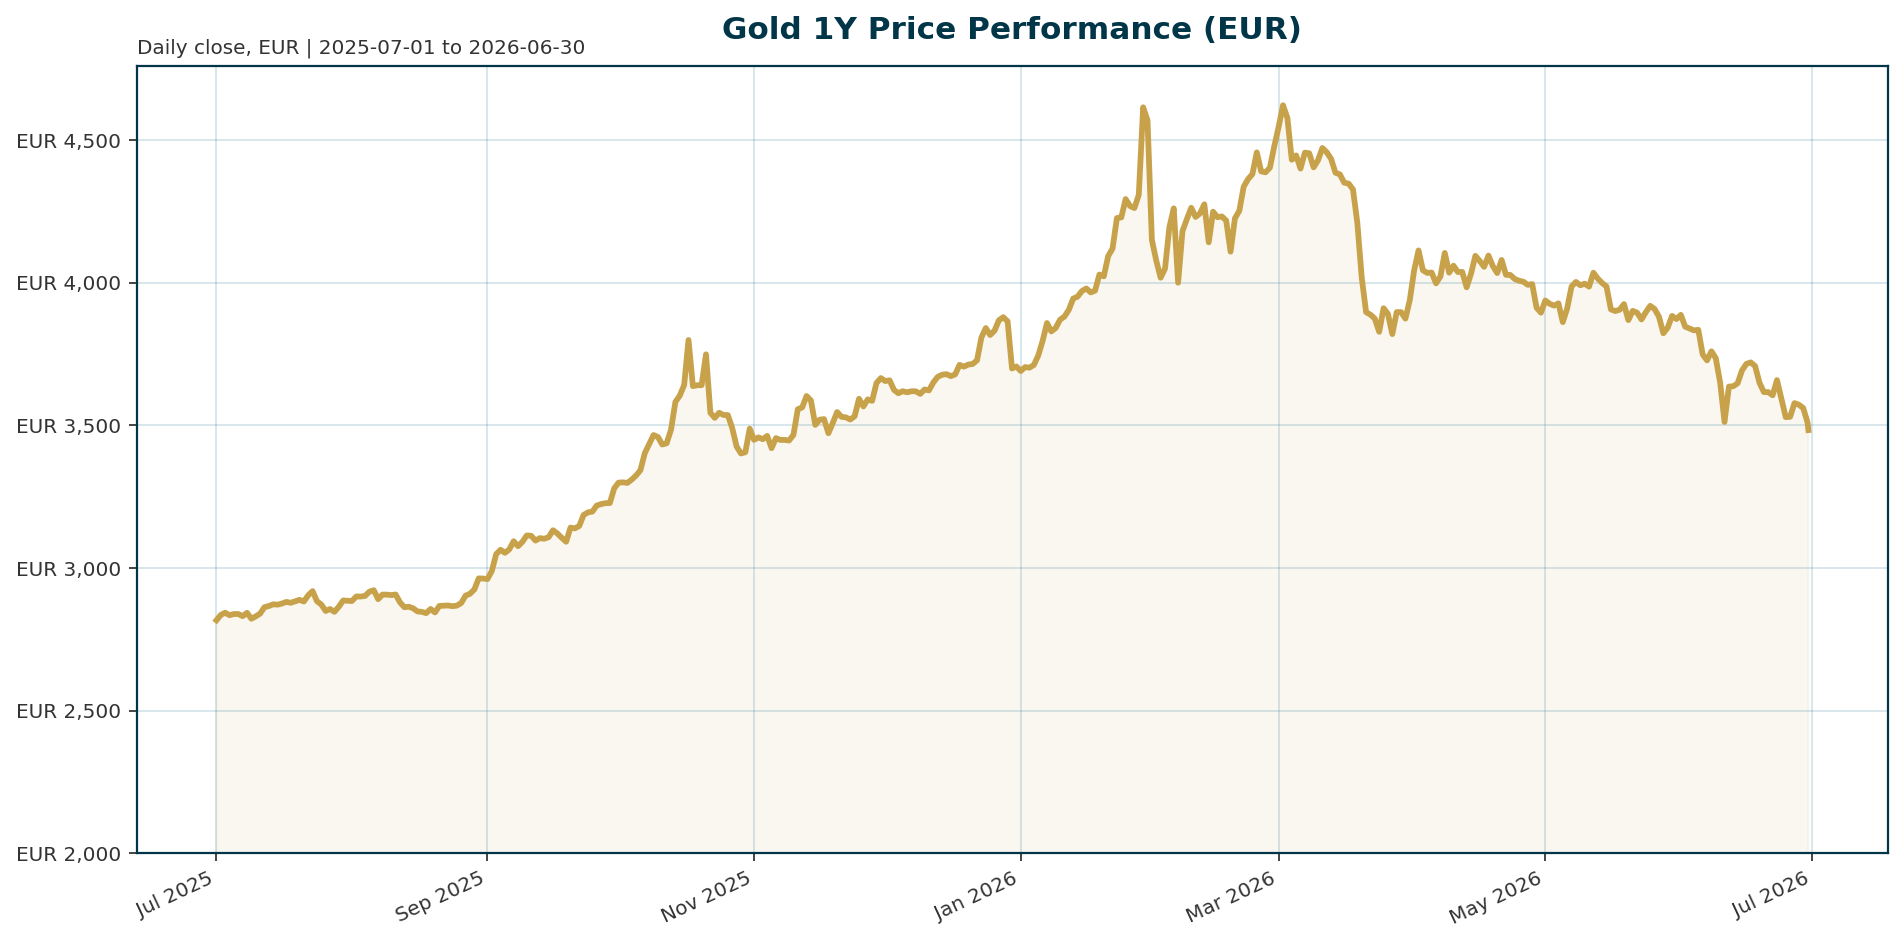
| Price (XAU/EUR) | 3,481.30 | -2.27% (24h) |
| 30-Day Change | -10.10% | -10.10% |
| 200-Day Change | -4.63% | -4.63% |
| 1-Year Change | +23.93% | +23.93% |
| All-Time High | 4,688.32 | -25.76% |
| Market Cap | 1.57B EUR | -2.27% |
| BTC Dominance | 55.54% | N/A |
Macro Backdrop
Risk sentiment is neutral with equity momentum mixed. The Euro area AAA 10Y yield sits at 2.92% and is moving -8.7 bp over 5 days. FX is mixed, with EUR/USD at 1.1419 and moving 0.25% over 5 days. Key observations include Nikkei 225 leading on a 1-month basis at 5.93% while DACH indicators average -2.02% over 5 days versus 0.14% for global equity indicators. This divergence highlights a rotation away from traditional safe havens or a divergence driven by the specific USD strength narrative.
Investment Thesis
Gold is undergoing a “reset within a larger secular uptrend” [T1]. The fundamental drivers remain structural de-dollarization and persistent inflation [T1]. The market is currently pricing in a hawkish Federal Reserve stance, with Chair Kevin Warsh signaling that inflation control comes first, which removes the hope of immediate rate cuts [T5]. This creates a conflict where the long-term thesis for gold is supported by central bank diversification away from the dollar, while the short-term cycle is weighed down by rate-sensitive demand and a strong dollar [T2, T4].
Bullish Drivers
- Central Bank Diversification: A record 45% of 76 surveyed central banks between February and May expect to increase their own gold reserves over the next 12 months [T2]. Societe Generale analysts note that central bank demand remains resilient despite geopolitical uncertainty [T3].
- Structural Inflation: Analysts expect inflation to remain structurally higher than pre-pandemic levels as reshoring and supply-chain realignment reverse decades of globalization-driven disinflation [T1].
- De-dollarization: The “weaponization of the dollar” is a major catalyst behind central-bank gold buying and is unlikely to reverse [T1].
- Oil Price Dynamics: Falling oil prices could soon begin to benefit precious metals as inflation expectations moderate and bond yields drop, while developments on the Pacific Rim suggest the gold market’s center of gravity may be shifting East [T8].
Relative Positioning vs Bitcoin and Ethereum
Gold is currently underperforming relative to global equities, specifically the Nikkei 225, which leads on a 1-month basis at 5.93% [market_overview]. Meanwhile, Bitcoin dominance remains high at 55.54% [market_data]. This suggests that current capital flows are favoring risk-on assets and cryptocurrencies over traditional safe havens like gold, driven by the current macro backdrop of a stronger dollar and hawkish Fed policy [T5, T8].
Scenario Framework
- Base Case: The Fed holds rates steady through Q3, with 10Y US real yields remaining above 2% as SocGen forecasts [T3]. Gold consolidates between 3,400 and 3,800 EUR.
- Bull Case: If the dollar weakens and the Fed delays an easing cycle, gold could target $4,900 per ounce as Goldman Sachs predicts [T2].
- Bear Case: If the Fed hikes rates further due to sticky inflation, gold could test the $3,800 level, which CPM Group warns could open the way toward $3,800 [T7].
Valuation Discussion
Gold is currently trading 25.76% below its January 2026 all-time high of 4,688.32 EUR [market_data]. At current price levels, more than 200 tons of gold in exchange-traded funds are in loss-making territory, suggesting that retail and ETF investors are facing significant opportunity costs [T4]. While this creates an attractive entry point for long-term holders and central banks, the valuation remains expensive for rate-sensitive investors as long as real yields remain elevated.
Risks
- Hawkish Fed Policy: The market prices in three rate hikes this year, with a 60% probability of a September move and an 80% probability of a December move [T5].
- Strong Dollar: The US Dollar Index has risen to its strongest level since May 2025, making gold more expensive for non-dollar buyers [T8].
- Geopolitical Uncertainty: While the Middle East conflict has not acted as a traditional safe-haven driver for gold recently, ongoing uncertainty creates headwinds for central bank reserve managers [T3, T5].
- ETF Outflows: Gold-backed ETFs recorded net outflows of 16 metric tons in May and continued to see outflows in the first half of June, indicating continued selling pressure [T4].
Appendix
Sources
- Gold’s pullback creates attractive entry as de-dollarization turns structural – KITCO [T1]
- Gold is not done: Goldman Sachs predicts a rise to $4,900 – Yahoo Finance [T2]
- Gold’s biggest buyers aren’t slowing down, but SocGen sees a more measured pace ahead – KITCO [T3]
- Gold ETFs could see fresh outflows on rising bets on Fed monetary tightening – Reuters [T4]
- The war came back. Gold fell anyway. – KITCO [T5]
- Gold & silver market update: Silver below $60, gold $4,100 test, ETF selling, Comex inventories, and Treasury gold rumors – KITCO [T6]
- Gold and Silver Face Fresh Warning Signs as New Market Risks Build Fast – Qoo Media [T7]
- Precious metals should benefit from falling oil, as gold market continues shift toward Asia – KITCO [T8]
This report is AI-generated for informational purposes only and does not constitute investment advice. Please consult a qualified financial advisor before making investment decisions.
Important Note / Wichtiger Hinweis:
EN: This report may have been generated using AI. It processes data from publicly available sources. The content is provided for informational purposes only.DE: Dieser Bericht kann mithilfe von KI erstellt worden sein. Dabei werden Daten aus öffentlich zugänglichen Quellen verarbeitet. Die Inhalte dienen ausschließlich Informationszwecken.
* DE: Die ergänzenden Inhalte können KI-generiert sein. EN: The additional content may be AI-generated.