
Listen to the summary
Key Data Snapshot
| Asset | Price (EUR) | Market Cap (EUR) | 24h Volume (EUR) | 1Y Return | ATH Drawdown |
|---|---|---|---|---|---|
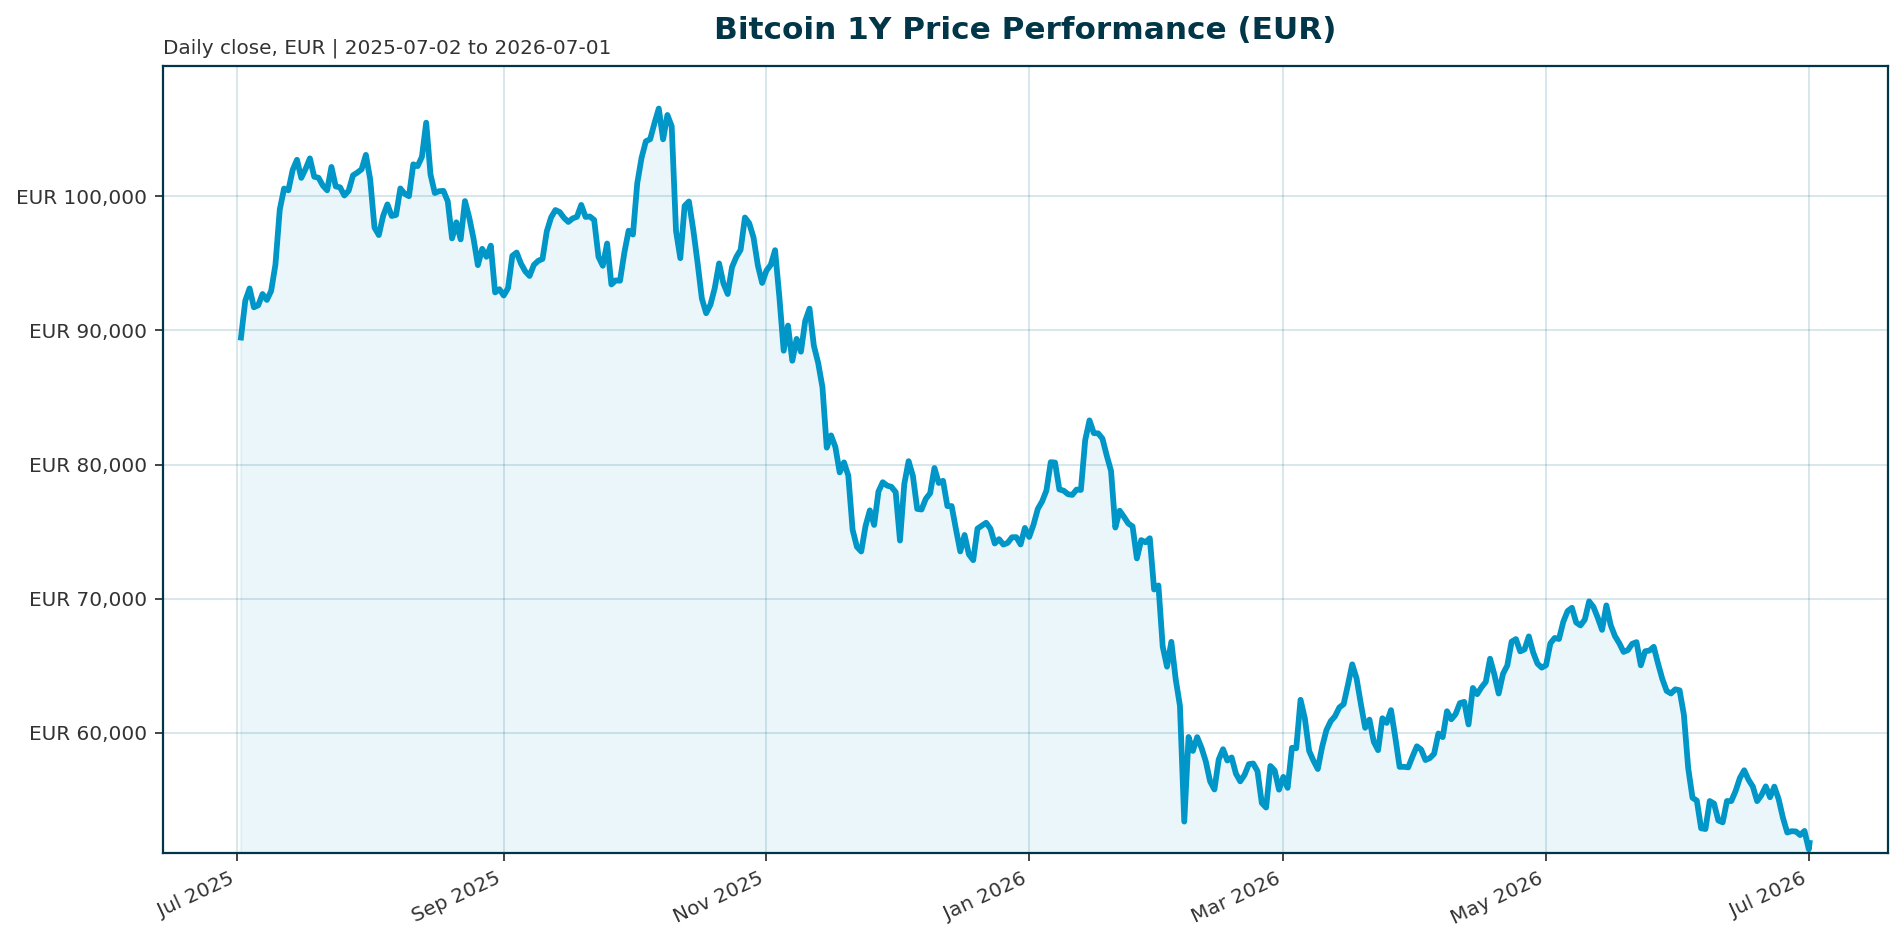
| Bitcoin (BTC) | 51,768.00 | 1,037.98 B | 30.68 B | -43.04% | -51.92% |
Market Cap / 24h Volume Ratio: 33.8x (High valuation relative to liquidity)
Market Setup
Risk sentiment remains neutral as global equity markets show mixed momentum with the Nasdaq Composite leading gains at 2.89% over five days while the Nikkei 225 lags at -2.44% [market_overview]. The Euro area presents a mixed backdrop with the 10-year yield at 2.92% and the 2-year yield at 2.48%, suggesting a complex rates environment that favors income strategies over pure growth [market_overview]. The FX market is also mixed, with EUR/USD holding at 1.1412, complicating cross-asset flows for European investors [market_overview].
Investment Thesis
The investment thesis for Bitcoin remains anchored on digital scarcity and the establishment of a non-sovereign monetary asset class. Despite current volatility, the asset continues to absorb a disproportionate amount of crypto capital, evidenced by a 55.37% dominance metric, suggesting investors are rotating within the digital asset space rather than exiting entirely [market_data]. The long-term narrative persists that Bitcoin serves as a hedge against inflation and fiat debasement, particularly as traditional fixed income markets face yield compression and regulatory scrutiny [T6].
Bullish Drivers
- Regulatory Clarity Catalyst: The bipartisan Clarity Act represents a pivotal potential catalyst. A signature by the President would remove a significant regulatory overhang that has deterred institutional capital, as noted by sFox CEO Javier Martinez who argued that waiting for clarity becomes a liability [T2].
- Capital Rotation: Robust flows into U.S. bond ETFs, up 60% year-over-year, indicate investors are aggressively hunting for yield. This rotation could eventually flow into risk assets like Bitcoin, which offers uncorrelated returns [T6].
- Technical Support: A reported accumulation of buy orders in the $59,000 to $60,000 range provides a critical technical floor. Failure to hold this level could trigger a cascade to lower support zones, but the presence of liquidity here offers a potential rebound point [T1].
- Strategy Buybacks: MicroStrategy has initiated buybacks and a bitcoin monetization program, signaling that the entity sees value below current market prices despite recent preferred equity distress [T4].
Relative Positioning vs Gold and Ethereum
Bitcoin currently holds a commanding 55.37% dominance over the broader crypto market, indicating a flight to safety within the digital asset class despite the overall downtrend [market_data]. Ethereum is trading significantly lower than Bitcoin, currently under $1,570, suggesting a relative underperformance that could present a buying opportunity for risk-takers seeking leverage to Bitcoin’s strength [T1]. While Gold is not explicitly priced in this report, the current macro environment of softening labor markets and rising inflation expectations (PCE at 4.1% YoY) supports the continued narrative of Bitcoin as a non-correlated store of value [T7].
Scenario Framework
- Bullish Rebound: If the Clarity Act passes or technical support at $59k-60k holds, Bitcoin could reclaim the 60k resistance level, targeting the 70k range as institutional flows re-enter.
- Base Case Consolidation: The market trades in a choppy range between 50k and 60k. This scenario is likely if the Fed maintains a hawkish stance (30% probability of a July hike) and ETF outflows persist [T3][T7].
- Bearish Cascade: Failure to hold the $59k support triggers forced liquidations. With Grayscale planning a $3B sale and ETF outflows totaling $6.4B in 30 days, a breakdown below 50k could see Bitcoin test the 40k support level [T3][T5].
Valuation Discussion
Bitcoin is currently trading at a significant discount to its October 2025 all-time high of 107,662 EUR, down 51.9% from that peak [market_data]. The current market cap of 1.04 trillion EUR is supported by a 24-hour volume of 30.68 billion EUR, resulting in a market cap-to-volume ratio of 33.8x. This high ratio suggests the asset is priced for liquidity but remains vulnerable to rapid selling pressure if macro catalysts turn negative.
Risks
- Regulatory Impasse: The stalled Clarity Act and the President’s refusal to sign related legislation pose a structural risk to market recovery, potentially driving capital to more regulated jurisdictions [T2].
- ETF Outflows: Spot Bitcoin ETFs have recorded record outflows of $6.4B over the last 30 days, with BlackRock’s IBIT leading withdrawals, indicating a lack of new institutional demand [T3].
- MSTR Distress: MicroStrategy’s preferred equity trading at 80 cents on the dollar and stock collapsing below $100 has revived fears of a “ponzi scheme” collapse, creating a contagion risk for the broader market [T2].
- Macro Hawkishness: The Fed has signaled a higher probability of rate hikes in July, with PCE inflation remaining above target at 4.1% YoY. Higher rates typically pressure risk assets like Bitcoin [T7].
Appendix
Sources
- 5 Market Signals Reveal How AI Stocks, Oil and Bitcoin Shook Wall Street – Bitcoin News [T1]
- The ‘Ponzi Scheme’ Is Collapsing—Bitcoin Suddenly Braced For A Massive Price Crash – Forbes [T2]
- Bitcoin crashes, odds turn darker as MSTR, APLD lead crypto-stocks bloodbath – Seeking Alpha [T3]
- Bitcoin remains below key onchain and technical levels, leaving it in no man’s land – CoinDesk [T4]
- Grayscale strategy team to sell $3B in Bitcoin to meet cash obligations – Crypto Briefing [T5]
- Bond ETF flows surge in hunt for yield: ‘Market sniffing out something here,’ says BlackRock exec – CNBC [T6]
- ETFs lead growth in loan fund AUM as outlook on lending rates shifts – PitchBook [T7]
- Billionaire Jeremy Grantham Dismisses Bitcoin, Says Crypto Will Fade ‘With a Whimper’ – Decrypt [T8]
This report is AI-generated for informational purposes only and does not constitute investment advice. The views expressed herein are those of the model and do not reflect the official positions of any financial institution.
Important Note / Wichtiger Hinweis:
EN: This report may have been generated using AI. It processes data from publicly available sources. The content is provided for informational purposes only.DE: Dieser Bericht kann mithilfe von KI erstellt worden sein. Dabei werden Daten aus öffentlich zugänglichen Quellen verarbeitet. Die Inhalte dienen ausschließlich Informationszwecken.
* DE: Die ergänzenden Inhalte können KI-generiert sein. EN: The additional content may be AI-generated.