
Listen to the summary
Key Data Snapshot
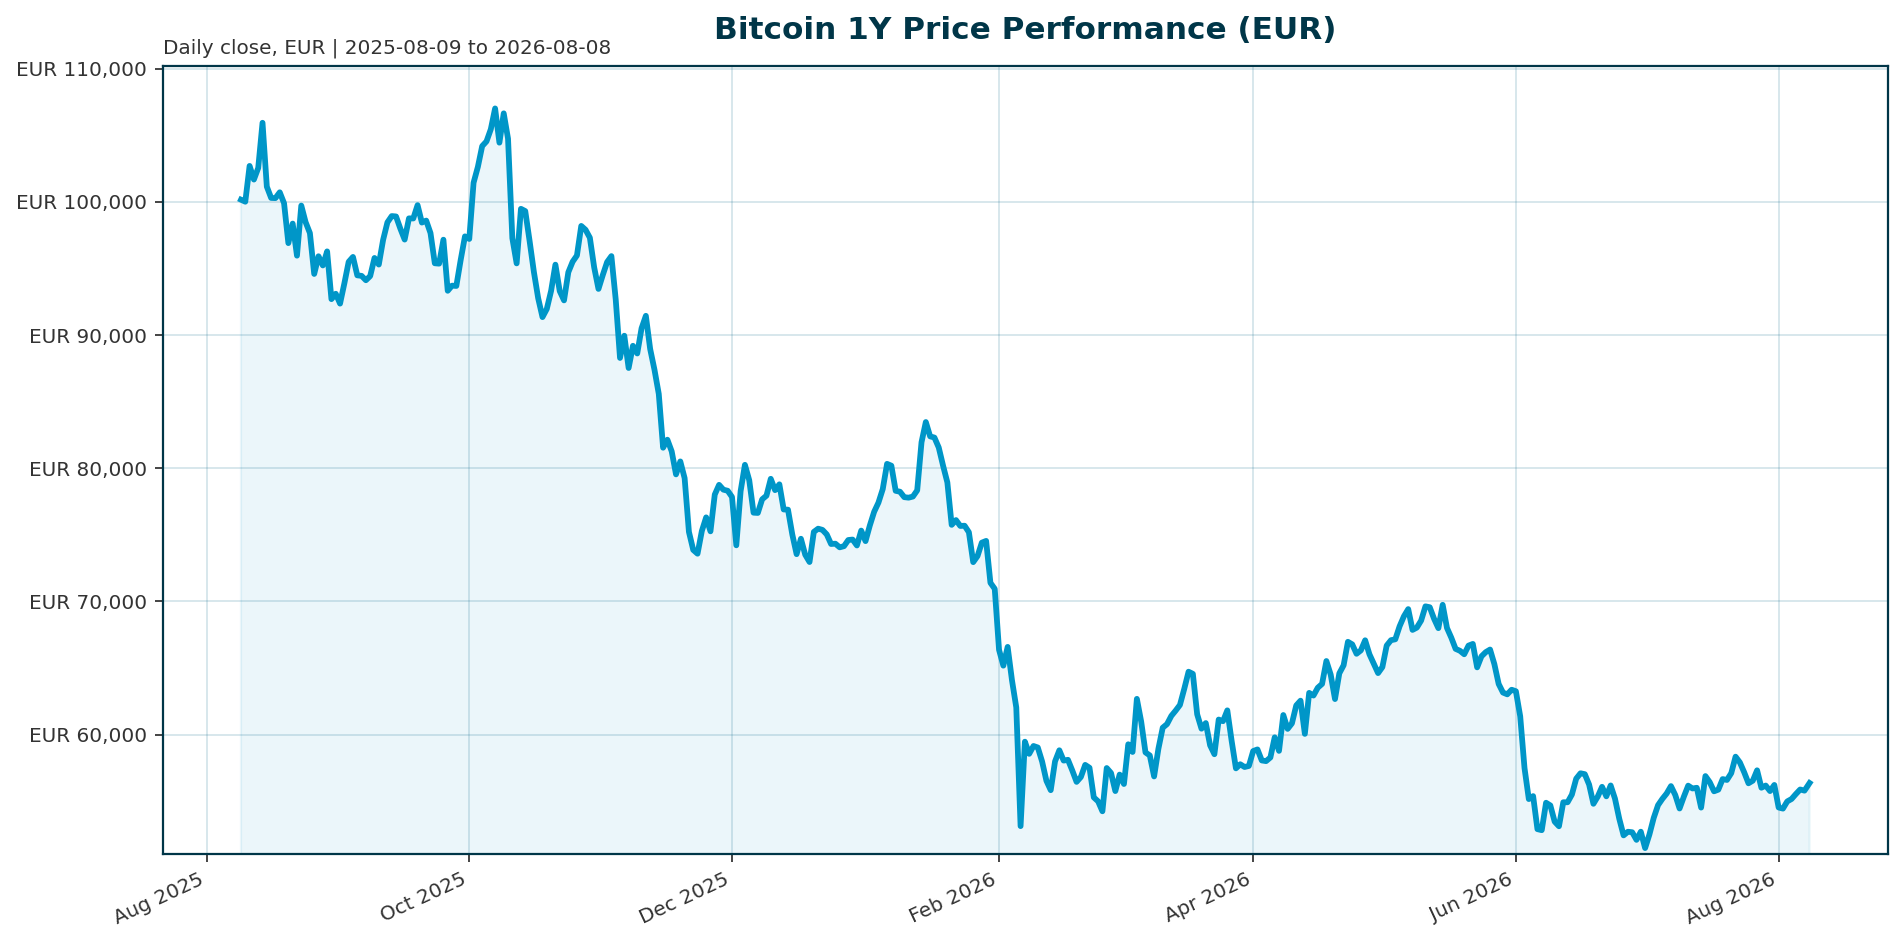
| Metric | Value |
|---|---|
| Current Price | 56,173.00 EUR |
| 24h Change | +1.1% |
| 1Y Change | -44.3% |
| Market Cap | 1.127T EUR |
| 24h Volume | 18.67B EUR |
| All-Time High | 107,662.00 EUR (Oct 2025) |
| ATH Drawdown | -47.8% |
| BTC Dominance | 56.75% |
Market Setup
Risk sentiment is positive with European equities showing momentum, specifically the Nasdaq Composite (+3.00% 5d). The Euro area 10Y yield sits at 3.15%, moving slightly lower, creating a mixed backdrop. Key observations include the DAX outperforming global peers on a 5-day basis and the Euro Area 10Y-2Y spread narrowing to 47.4 bp. In crypto, the asset has entered an “institutional supply era” where ETF flows and macro policy are the primary price drivers, replacing pure retail speculation [T1][T2]. The ETF channel has become central to Bitcoin’s market structure, providing institutions with a regulated, liquid way to add exposure [T8].Investment Thesis
Bitcoin has transitioned from a speculative curiosity to a legitimate financial asset that deserves consideration in diversified portfolios. The convergence of institutional adoption through ETFs, corporate treasuries, and regulatory clarity creates a favorable backdrop for potential appreciation toward the $100,000 to $150,000 range [T5]. With 94% of institutional investors now recognizing the long-term value of blockchain technology and daily ETF inflows consistently exceeding $400 million, the foundation for continued growth appears solid [T5]. Spot ETFs, corporate treasuries, and regulated investment vehicles have made Bitcoin easier to integrate into existing financial workflows, effectively turning BTC into an allocatable line item for registered investment advisors and institutions [T1].Bullish Drivers
ETF inflows have revived confidence, with BlackRock commanding over 80% of daily flows recently, signaling stronger adoption supported by Ethereum and Layer-2 developer activity [T6]. The potential passage of the CLARITY Act could establish a federal market-structure framework, unlocking broader institutional participation if passed [T2]. Additionally, Bitcoin has become less volatile, with volatility decreasing from 84% to 43%, indicating it is evolving into a more stable, institutional asset [T1]. Institutional demand is visible again, and the regulatory backdrop may be improving, suggesting buyers are responding to structural adoption rather than just easy-money expectations [T3].Relative Positioning vs Gold and Ethereum
Bitcoin maintains its dominance as the largest cryptocurrency with a 56.75% share of the total crypto market cap of 1.98T EUR [T1]. While specific Gold and Ethereum prices are not provided in this dataset, the structural shift toward ETF-based allocation positions Bitcoin as a distinct asset class alongside traditional safe havens. The concentration of assets in a single issuer like BlackRock highlights the maturation of the market structure, though it raises questions about market concentration [T6]. The Nasdaq Composite has the strongest 5-day move at 3.00%, indicating a broader risk-on environment that could support digital assets [T2].Scenario Framework
Bull Case: If ETF flows sustain above $400 million daily and the CLARITY Act passes, Bitcoin could test the $100,000 to $150,000 range [T5]. The market’s bullish structure is reasserting itself if Bitcoin can hold the $80,000 floor and break convincingly through the next resistance zone [T3]. Bear Case: Rising US Treasury yields act as a clear macro headwind, making government debt more attractive and raising the opportunity cost of holding a non-yielding asset like BTC [T8]. A regulatory shock or reversal in flows could trigger a retest of support levels below $50,000 if the macro backdrop does not improve.Valuation Discussion
Current valuation sits approximately 47.8% below the October 2025 all-time high of 107,662 EUR. Despite this drawdown, the market cap of 1.127T EUR reflects the transition to an institutional supply era [T1]. The current price of 56,173 EUR suggests a recovery phase is underway, supported by structural supply constraints and growing institutional demand rather than pure speculative retail activity [T5]. Current price predictions from major analytics platforms range conservatively from $85,000 to $132,000 for 2026, contingent on favorable regulatory developments and continued institutional adoption [T5].Risks
Concentration risk is a primary concern, as BlackRock controls over 80% of ETF flows, giving it outsized influence over the spot market [T6]. The regulatory backdrop remains unsettled, with banks attempting to derail a landmark crypto bill, which could slow the next wave of institutional onboarding if legislation stalls [T6]. Furthermore, rising US Treasury yields create a macro headwind by improving the relative appeal of government debt [T8]. A sudden shift in macro conditions, a further legal challenge to spot ETFs, or a reversal in Grayscale’s discount compression could quickly change the flow picture [T6].Appendix
Sources
- Crypto Market 2025: Year-End Review & Expert Insights [T1]
- Q2 2026 Digital Asset Review [T2]
- Bitcoin Holds Near $80K–$81K as ETF Inflows Revive Bullish Sentiment [T3]
- Bitcoin Breaks Out to $66.6K, Closing the Gap with Equities as ETF Flows Flip Positive [T4]
- Bitcoin Price Prediction 2026: Institutional Adoption [T5]
- BlackRock Commands $305M ETF Inflows as Institutional Bitcoin and Ether Demand Holds [T6]
- BlackRock Bitcoin ETF Achieves Staggering $935M Q1 Inflow Milestone [T7]
- US Treasury yields surge to new highs as liquidity tightens, pushing Bitcoin back below $82,000 resistance [T8]
This report is AI-generated for informational purposes only and does not constitute investment advice. The views expressed are those of the model and should not be taken as financial guidance.
Important Note / Wichtiger Hinweis:
EN: This report may have been generated using AI. It processes data from publicly available sources. The content is provided for informational purposes only.DE: Dieser Bericht kann mithilfe von KI erstellt worden sein. Dabei werden Daten aus öffentlich zugänglichen Quellen verarbeitet. Die Inhalte dienen ausschließlich Informationszwecken.
* DE: Die ergänzenden Inhalte können KI-generiert sein. EN: The additional content may be AI-generated.