
Listen to the summary
Key Data Snapshot
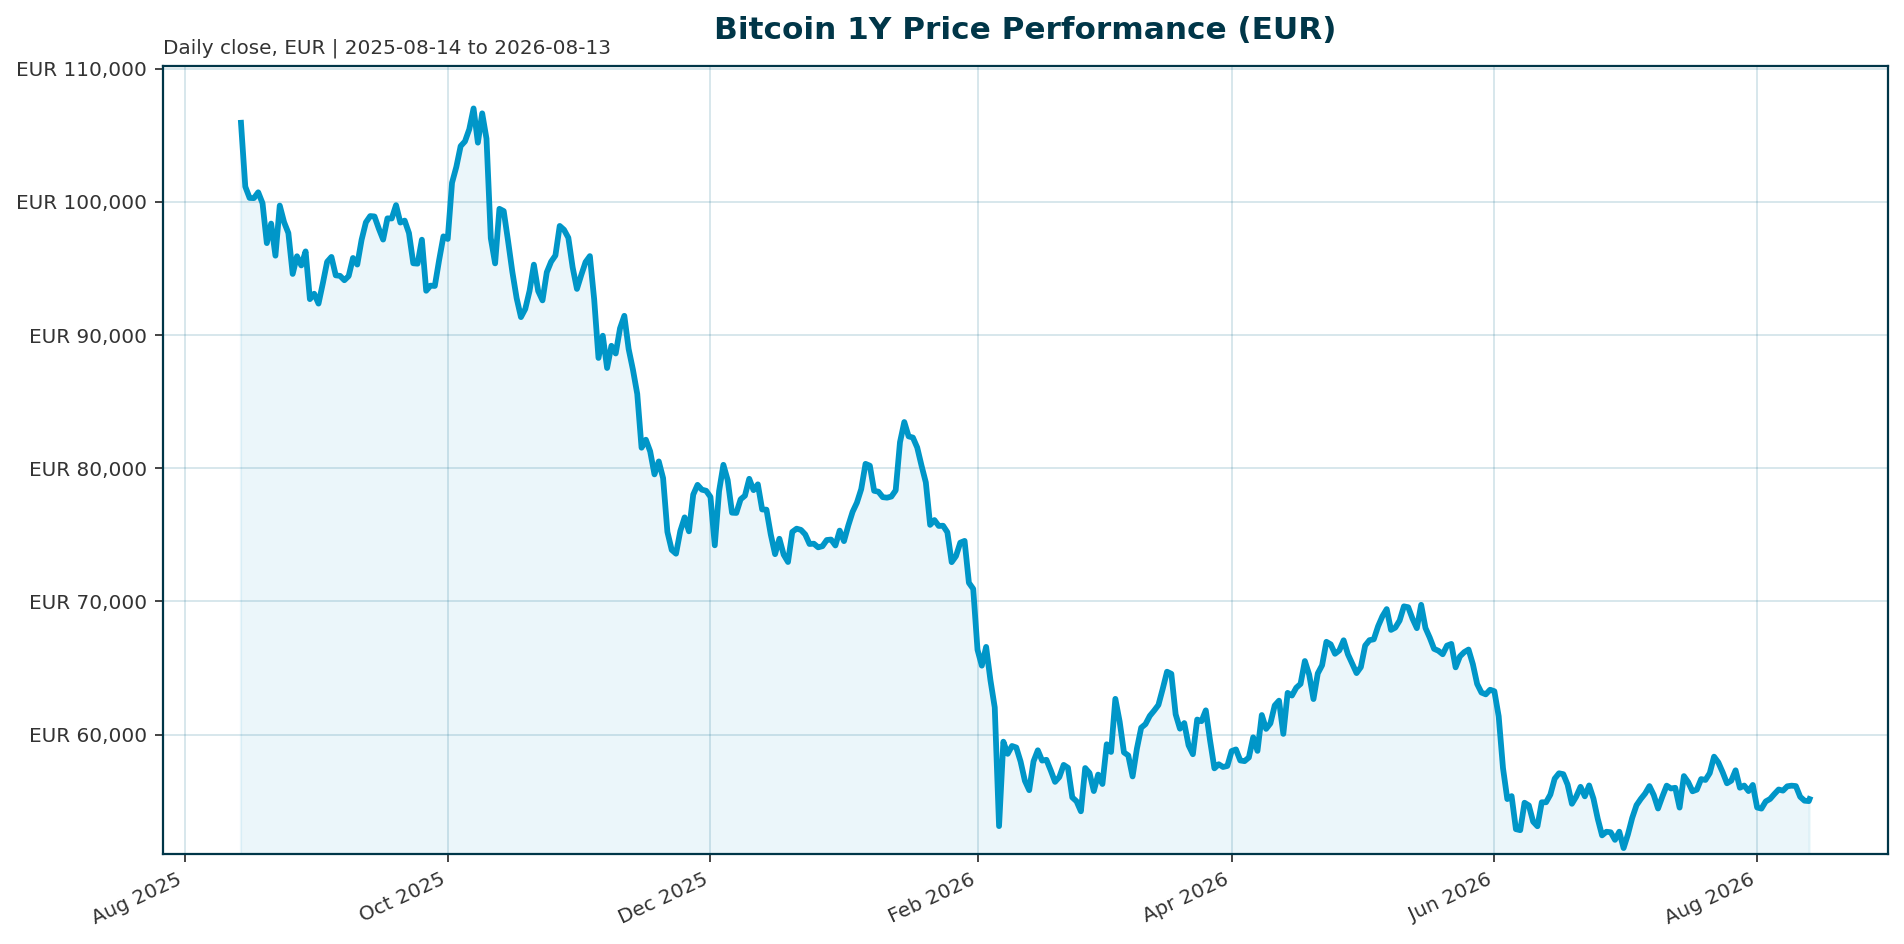
| Metric | Value |
|---|---|
| Current Price (EUR) | €55,189.00 |
| 24h Change | -0.20% |
| Market Cap | €1.11 Trillion |
| Circulating Supply | 20.07 Million BTC |
| All-Time High | €107,662.00 (Oct 2025) |
| ATH Change | -48.74% |
| BTC Dominance | 56.26% |
| Volatility (vs 2024) | 43% (down from 84%) |
| ETF Price Discovery Share | ~85% |
Market Setup
Risk sentiment remains positive while equity momentum is moderately positive, though DACH markets lag global peers with the DAX up 0.73% over five days versus the Nikkei 225’s 4.57% gain [market_overview]. The Euro area presents a mixed backdrop with the AAA 10Y yield at 3.18% and EUR/USD flat at 1.1546 [market_overview]. The macro environment remains the primary variable, as the Fed under Chair Kevin Warsh is expected to hold rates through Q3, limiting room for traditional easing that has historically supported risk assets [T1]. Inflation concerns and geopolitical tensions continue to influence risk asset performance, creating a complex environment for Bitcoin valuation [T2].
Investment Thesis
Bitcoin has transitioned from a speculative asset driven by halving cycles to a macro indicator dominated by ETF flows and institutional capital [T3][T6]. The market structure has fundamentally shifted, with ETFs now accounting for approximately 85% of price discovery [T5]. This institutionalization, evidenced by the “institutional supply era,” has reduced Bitcoin’s volatility from 84% to 43%, signaling maturation into a more stable asset class [T3]. The core thesis posits that Bitcoin’s value is now determined by three variables: a new market structure, institutional fund flows, and the macroeconomic environment, rather than solely by on-chain supply dynamics [T6].
Bullish Drivers
- ETF Inflows and Sentiment: Revived institutional demand has reclaimed the $80,000 psychological level, with ETF inflows serving as the most tangible leading indicator for short-term direction [T2][T7].
- Structural Demand Imbalance: Institutional demand has surpassed new mining supply by 5.6 times, creating a persistent buying pressure that absorbs sell flows and supports prices [T5].
- Regulatory Catalysts: The potential passage of the CLARITY Act could establish a federal market-structure framework, unlocking broader institutional participation [T1].
- Market Structure: The dominance of ETFs in price discovery provides a floor under prices, as sustained flows from regulated vehicles like BlackRock’s ETFs signal long-term capital commitment [T4][T7].
Relative Positioning vs Gold and Ethereum
Bitcoin maintains a dominant position within the cryptocurrency ecosystem, commanding 56.26% of the total crypto market cap of €1.97 trillion [market_data]. While direct price comparisons to Gold and Ethereum are unavailable in this dataset, the current market structure suggests Bitcoin is increasingly viewed as a distinct asset class rather than a pure speculative play. The resilience of BTC dominance against a backdrop of global equity strength indicates that institutional capital rotation is favoring Bitcoin over other risk assets, including traditional equities and other cryptocurrencies.
Scenario Framework
- Bull Scenario: If ETF inflows resume at levels exceeding daily mining supply (2-3x), Bitcoin could break above $125,000 resistance and extend to new ATHs in the $140,000-$160,000 range by mid-2026 [T5].
- Base Scenario: Price action stabilizes between €55,000 and €80,000, supported by steady institutional accumulation and a holding pattern by the Fed [T2][T8].
- Bear Scenario: A deterioration in macro conditions, such as a reversal in Fed policy or a sudden stop in ETF inflows, could trigger a breakdown below €50,000 as the ETF-driven market structure removes primary demand [T2][T5].
Valuation Discussion
Bitcoin is currently trading at a significant discount to its October 2025 ATH, down 48.74% from €107,662 [market_data]. However, this valuation is supported by a structural shift in supply-demand dynamics. The influx of institutional capital via ETFs has effectively replaced speculative spot trading as the primary driver of value. The current market cap of €1.11 trillion reflects a market that has absorbed significant sell-side pressure while maintaining a floor through regulated capital flows [T5]. The reduction in volatility to 43% suggests the asset is pricing in the new reality of institutional holding periods rather than immediate speculative gains.
Risks
- Macro Headwinds: The Fed’s expected rate hold through Q3 leaves limited room for the liquidity-driven rallies of the past. Inflation and geopolitical tensions remain persistent risks that could pressure risk assets [T1][T2].
- Regulatory Uncertainty: The passage of the CLARITY Act is not guaranteed. A failure to pass federal market-structure legislation could stifle institutional adoption [T1].
- Liquidity Dependence: Because ETFs dominate 85% of price discovery, a reversal in flows could lead to rapid price dislocation, as seen in Q4 2025 when outflows coincided with support breakdowns [T3][T5].
Appendix
Sources
- Q2 2026 Digital Asset Review [T1]
- Bitcoin Holds Near $80K–$81K as ETF Inflows Revive Bullish Sentiment [T2]
- Crypto Market 2025: Year-End Review & Expert Insights [T3]
- BlackRock Bitcoin ETF Achieves Staggering $935M Q1 Inflow Milestone [T4]
- Why Bitcoin ETF Demand Now Trails Daily Mining Supply [T5]
- Bitcoin Price Faces a Pivotal Shift: New Market Structure, Institutional Funds, and Macroeconomics Now Drive Value [T6]
- Bitcoin Price Analysis April 2026 [T7]
- Bitcoin Price Analysis May 2026 [T8]
Disclaimer: This report is AI-generated for informational purposes only and does not constitute investment advice. The analysis is based on data available as of August 13, 2026. Readers should conduct their own due diligence before making investment decisions.
Important Note / Wichtiger Hinweis:
EN: This report may have been generated using AI. It processes data from publicly available sources. The content is provided for informational purposes only.DE: Dieser Bericht kann mithilfe von KI erstellt worden sein. Dabei werden Daten aus öffentlich zugänglichen Quellen verarbeitet. Die Inhalte dienen ausschließlich Informationszwecken.
* DE: Die ergänzenden Inhalte können KI-generiert sein. EN: The additional content may be AI-generated.