
Listen to the summary
Key Data Snapshot
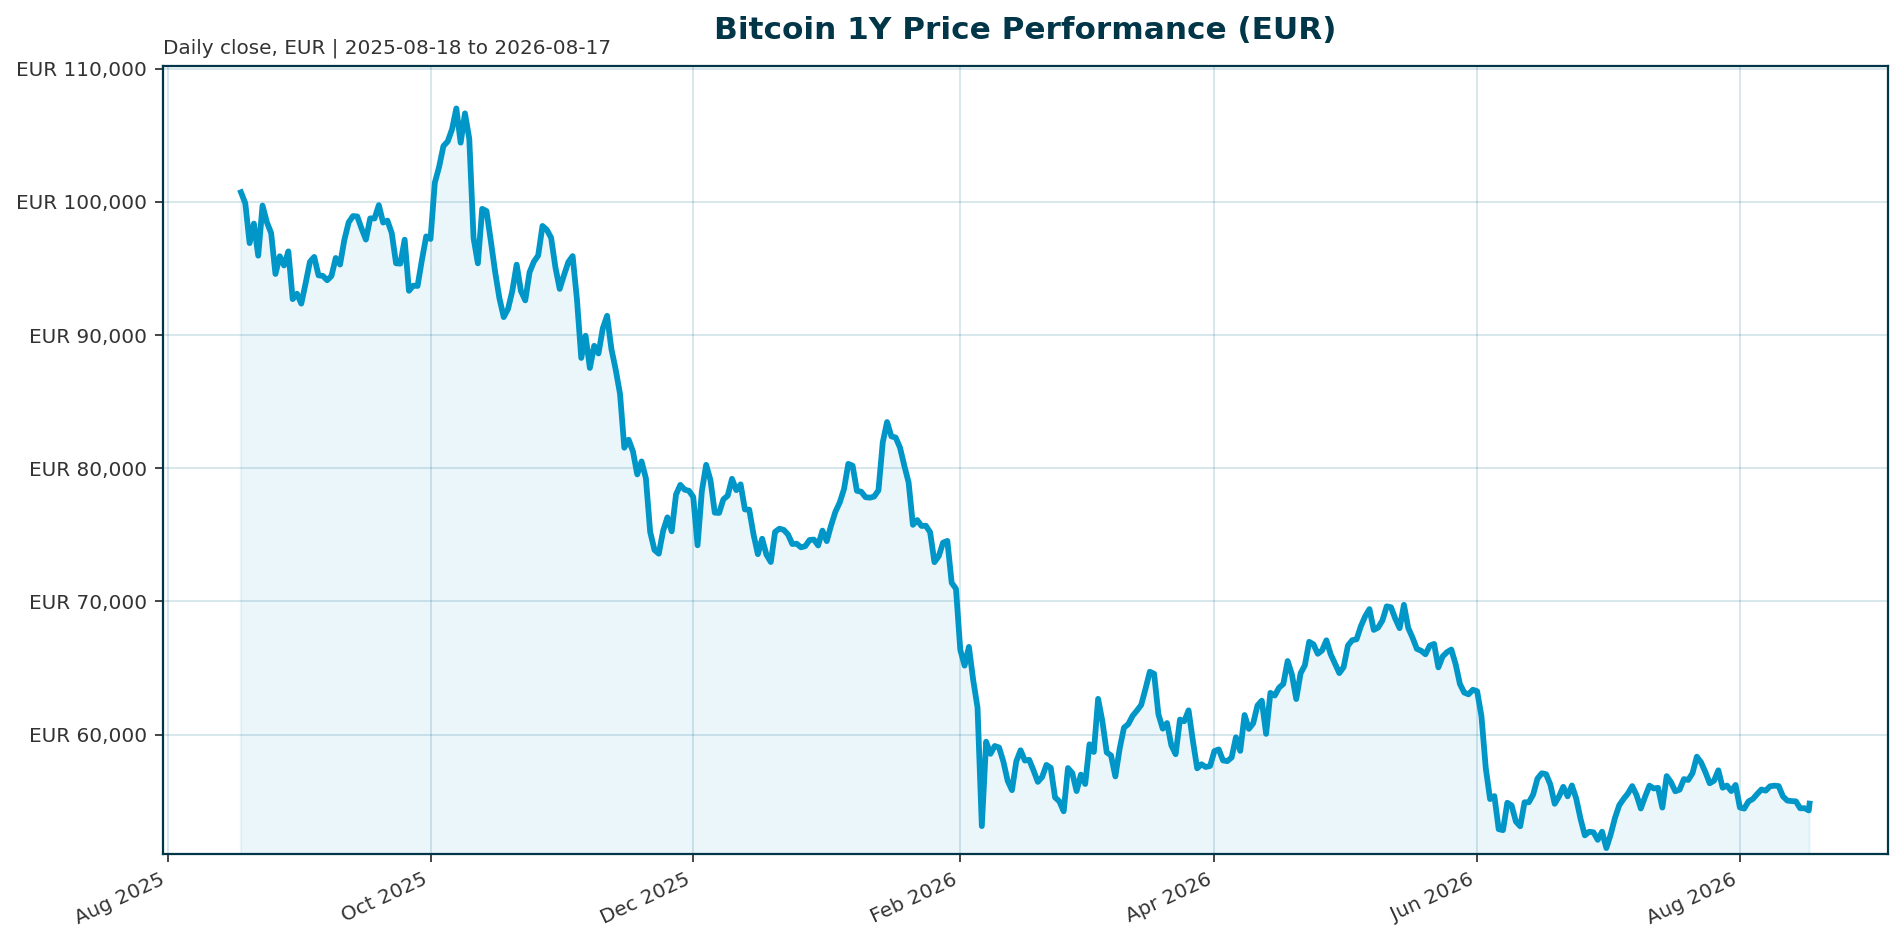
| Metric | Value |
|---|---|
| Price (EUR) | 54,768.00 |
| 24h Change | +0.50% |
| 200-Day Change | -27.80% |
| 1-Year Change | -46.10% |
| All-Time High (ATH) | 107,662.00 EUR (Oct 2025) |
| Market Capitalization | 1.099T EUR |
| Circulating Supply | 20.07M BTC |
| BTC Dominance | 56.21% |
Market Setup
Risk sentiment is positive with broadly positive equity momentum, led by the Nikkei 225 (+7.34% 1M) and DAX (+5.76% 1M) [T5]. The Euro area 10Y yield is 3.16% with mixed yields across the curve, while FX is mixed, with EUR/USD at 1.1558. Key observations include the Nikkei 225 leading on a 1-month basis and the Hang Seng being the weakest 5-day performer. Bitcoin currently trades as a macro-sensitive risk asset, with ETF flows acting as the primary price driver rather than retail speculation alone [T3][T4].Investment Thesis
The core investment thesis is the structural transition of Bitcoin from a speculative asset to a legitimate portfolio allocation. 94% of institutional investors now recognize the long-term value of blockchain technology, validating the asset class [T1]. ETFs have provided the necessary regulated access, with daily inflows consistently exceeding $400 million historically [T1]. This shift implies Bitcoin should trade with lower correlation to traditional equities. However, the thesis faces challenges as ETF flows are highly tactical and sensitive to macro conditions, suggesting that recent adoption may be driven by yield-seeking arbitrage rather than permanent capital [T3][T6].Bullish Drivers
- Institutional Inflows: Spot Bitcoin ETFs have been the primary catalyst, with recent weekly inflows reaching approximately $1.2 billion and cumulative flows topping $35 billion [T5].
- Diversification Utility: Bitcoin’s 30-day correlation with the S&P 500 dropped to 0.15, its lowest level in six months, supporting its role as a non-correlated hedge against sticky inflation [T5].
- Corporate Adoption: Large pension funds and endowments are allocating 1% to 3% of their portfolios to Bitcoin via ETFs, following the lead of state pension funds [T5].
- Supply Constraints: The 2024 halving cycle is in full effect, constraining supply while institutional demand grows.
Relative Positioning vs Gold and Ethereum
Bitcoin maintains its dominance as the primary institutional vehicle within the crypto ecosystem, holding a 56.21% share of the total crypto market capitalization. Ethereum is gaining traction in fund flows, adding nearly $120 million in weekly inflows, while Bitcoin dominated weekly inflows with more than $880 million [T7]. While Gold remains the traditional store of value benchmark, Bitcoin is increasingly competing for capital as a digital alternative, particularly as its correlation with equities decouples. The competition for capital is intensifying, with Solana ETFs also showing positive flows, indicating a broader institutional appetite for digital assets beyond just Bitcoin [T7].Scenario Framework
- Bullish Scenario: A dovish pivot by the Federal Reserve combined with sustained ETF inflows exceeding $400 million daily could trigger a re-rating. Analysts project price appreciation toward the $100,000 to $150,000 range [T1].
- Base Case: Macroeconomic uncertainty persists, leading to choppy ETF flows. Bitcoin consolidates between $50,000 and $60,000, trading as a tactical risk asset rather than a safe haven.
- Bearish Scenario: Hawkish central bank policy or geopolitical stress triggers a reversal in risk sentiment. If ETF outflows exceed $2 billion and the basis trade unwinds, Bitcoin could test the $50,000 psychological support level [T4][T6].
Valuation Discussion
Bitcoin is currently trading at a significant discount to its October 2025 all-time high of 107,662 EUR, down 49.13% [T5]. This drawdown reflects a reversion from peak speculative euphoria to a valuation based on current institutional flows. Despite the decline, current price targets for 2026 range conservatively from $85,000 to $132,000, contingent on continued regulatory clarity and sustained inflows [T1]. It is critical to note that a significant portion of recent ETF inflows may have been driven by cash-and-carry basis trades offering high yields, which are currently unwinding, potentially impacting the sustainability of current valuations [T6].Risks
- Invisible Margin Call: A significant structural risk is the unwinding of ETF basis trades. Analysis suggests a correlation coefficient of 0.878 between basis compression and ETF outflows. When basis yields evaporated, $4 billion in ETF redemptions followed [T6].
- Macro Sensitivity: ETF flows have proven highly sensitive to inflation data and Fed expectations. When liquidity tightens or risk appetite wanes, flows can reverse rapidly, placing Bitcoin in direct competition with high-growth themes like AI [T3][T4].
- Regulatory Hurdles: While approval of spot ETFs was a watershed moment, the SEC has shown a willingness to move slowly on new products, creating uncertainty for future adoption [T8].
Appendix
Sources
- Bitcoin Price Prediction 2026: Institutional Adoption [T1]
- BlackRock Bitcoin ETF Achieves Staggering $935M Q1 Inflow Milestone [T2]
- Bitcoin ETF Flows Lose Momentum After April Surge [T3]
- Bitcoin Opens June Under Pressure as ETF Outflows Cross $2B [T4]
- Bitcoin Clears $65,000 as Institutional ETF Inflows Drive Rally [T5]
- The Invisible Margin Call: Why Bitcoin’s $114 Billion Institutional Floor Is a Trapdoor [T6]
- Solana News: SOL Rallies as Fund Flows Flip Positive, Apps Gain Traction [T7]
- BlackRock vs Fidelity: Who Controls the Future of Bitcoin ETFs? [T8]
This report is AI-generated by GLM 4.7 Flash for informational purposes only and does not constitute investment advice. The views expressed are those of the model and should not be taken as financial guidance. Always conduct your own research before making investment decisions.
Important Note / Wichtiger Hinweis:
EN: This report may have been generated using AI. It processes data from publicly available sources. The content is provided for informational purposes only.DE: Dieser Bericht kann mithilfe von KI erstellt worden sein. Dabei werden Daten aus öffentlich zugänglichen Quellen verarbeitet. Die Inhalte dienen ausschließlich Informationszwecken.
* DE: Die ergänzenden Inhalte können KI-generiert sein. EN: The additional content may be AI-generated.