
Listen to the summary
Key Data Snapshot
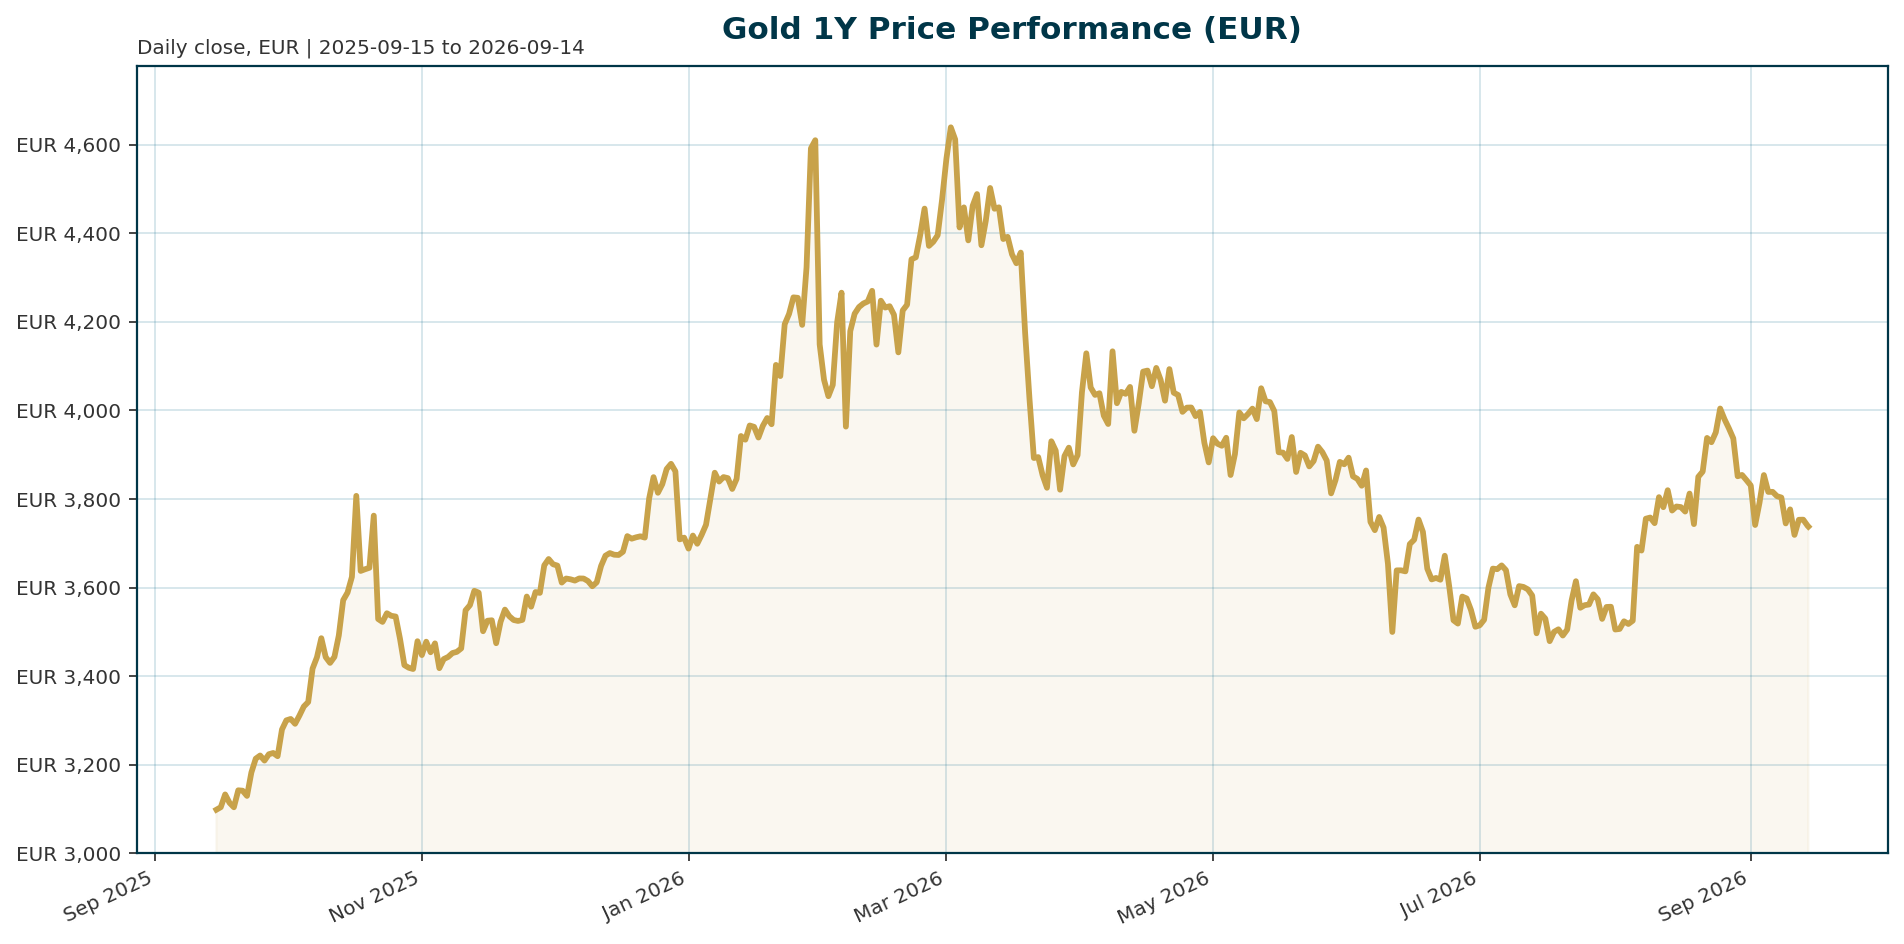
| Metric | Value | Note |
|---|---|---|
| Price (XAU/EUR, tracked via PAX Gold) | 3,745.44 EUR | Retrieved 2026-09-14 04:21 UTC |
| 24h change | -0.23% | High 3,767.36 / Low 3,743.73 EUR |
| 7d / 14d / 30d change | -1.6% / -1.9% / -0.9% | Stabilisation, no acceleration |
| 200d change | -16.6% | Drawdown since January peak |
| 1y change | +19.1% | Positive 12-month window despite 200d decline |
| All-time high | 4,688.32 EUR (2026-01-28) | Current price -20.11%: (3,745.44 – 4,688.32) / 4,688.32 |
| All-time low | 1,265.28 EUR (2019-11-17) | Current price +196.02% above ATL |
| PAXG market cap | 1.621 bn EUR | Token market cap, not the physical gold market |
| PAXG circulating supply | 432,906.6 oz | 1,621,497,332 / 432,906.6 = ~3,746 EUR/oz, confirming spot tracking with negligible wrapper premium |
| 24h volume (PAXG) | 61.0 m EUR | Market cap rank 47 |
| BTC dominance | 58.87% | Total crypto market cap 2.28 trn USD |
The tension between a -16.6% 200-day return and a +19.1% one-year return resolves through timing: the 4,688.32 EUR all-time high printed on 28 January 2026 sits inside the positive 12-month window. This is a cyclical correction within a structurally elevated regime, not a regime break.
Macro Backdrop
Market overview: Risk sentiment is neutral to negative, with moderately negative equity momentum. DACH indicators average -0.99% over five days versus -1.56% for global peers, so European markets are broadly in line with, and marginally better than, the global tape. The ATX is the strongest 5-day performer at -0.29% while the Nikkei 225 is the weakest at -2.92%. The rates backdrop features rising euro-area yields with a flattening curve: the AAA 10Y yield stands at 3.50%, up 15.7bp over five days, and the 10Y-2Y spread sits at 40.3bp. FX is mixed, with EUR/USD at 1.1611 (-0.22% over five days) and EUR/CHF showing the strongest 5-day move at +0.29%. For the EUR-quoted gold view, rising euro-area nominal yields are a direct headwind on opportunity cost, independent of the US real-yield narrative.
The dominant macro variable for gold remains the Federal Reserve path. The narrative has evolved through 2026: tariffs fed into production costs and inflation expectations, lifting higher-for-longer odds and pushing real Treasury yields and the dollar higher [T4]. Rising energy prices tied to Middle East tensions complicate the inflation outlook, and Chair Powell has stressed that further easing requires clearer progress on inflation, although ING’s US economist still expects two 25bp cuts in September and December [T5]. More recent data point the other way: July US retail sales fell 0.6%, the first decline in nine months, Goldman Sachs’ Hatzius called a September hike very unlikely, and the Bloomberg Dollar Index has begun to roll over [T2]. August CPI is seen up 0.4% m/m as gasoline rebounds, which keeps hike odds alive [T2]. UBS judges that if recent inflation pressure does not trigger broad second-round effects, the Fed is likely to resume easing later in the year, with falling real yields the key catalyst for gold [T3]. Lombard Odier sees the Fed on hold for much of 2026 with any cut more likely toward year-end [T8].
Scenario statements: Base case: the Fed stays on hold near term, euro-area yields remain elevated, and gold consolidates with a structural floor from official-sector demand. Upside: inflation fades without second-round effects and the Fed resumes easing, turning falling real yields into the primary tailwind [T3][T8]. Downside: renewed inflation or employment acceleration revives real yields and the dollar together, the most challenging backdrop for gold [T2].
Investment Thesis
The analytical frame is dual-driver. On the structural side, central-bank purchases have become a dominant, persistent support: emerging-market reserve managers are diversifying away from the US dollar, and SocGen describes a clear post-2022 regime shift in which gold trades near record highs despite positive real yields, breaking away from historical models that would imply significantly lower prices [T1][T6]. Quantified evidence: Saxo flags 289 tonnes of central-bank demand [T2], and a record 43% of 73 surveyed monetary authorities expect their own gold reserves to increase over the next year [T7].
On the cyclical side, the real-yield relationship has re-asserted itself in recent months after the 2022 to 2024 breakdown [T8]. Rising energy prices and tariff-driven inflation pushed Fed cut expectations out of the curve, lifting real yields and raising the opportunity cost of a non-yielding asset [T3][T4][T5]. SocGen remains strategically bullish, viewing gold as a hedge against monetary and policy uncertainty, and notes ETF inflows have moderated sharply but remain positive, with lower volatility improving gold’s appeal to longer-term reserve managers [T1]. UBS expects higher gold prices over the medium term on systematic central-bank diversification despite near-term real-yield pressure [T3]. MOFSL identifies the H2 2026 key variables as the inflation trajectory, Fed communication, global liquidity, central-bank demand and investment flows [T4].
Scenario statements: Bull: official-sector buying plus Fed easing compresses real yields and opens a renewed bull leg; a sustained break above $4,500 (the 200-day moving average in USD terms) would draw further momentum and ETF demand [T2]. Bear: a sharp monetary-policy reversal rapidly lifts real yields, a headwind central-bank buying only partially offsets [T6][T8]. Stagflation: slower growth with persistent inflation keeps gold structurally supported longer term [T5].
Bullish Drivers
- Central-bank demand: 289 tonnes of official-sector buying flagged by Saxo [T2]; a record 43% of 73 surveyed central banks expect to add gold [T7]. SocGen calls this a structural backstop that shows no signs of abating [T6].
- ETF flows turning: Inflows moderated sharply this year but remain positive [T1]; Saxo reports flows returning to gold [T2].
- Softening US data: July retail sales fell 0.6%, the first decline in nine months, reducing pressure on the Fed to tighten [T2]. Hatzius calls a September hike very unlikely [T2]; ING expects cuts in September and December [T5].
- Dollar rolling over: The Bloomberg Dollar Index has begun to reverse after earlier strength, removing a second headwind [T2].
- Inflation-risk underpricing: SocGen argues even priced-in tightening would not align policy with the Atlanta Fed’s Taylor Rule, implying inflation risks remain underpriced, a medium-term upside catalyst [T1].
- Real-asset regime: Fiscal uncertainty and gradual erosion of purchasing power favour real assets [T8]. Lower volatility improves gold’s appeal to reserve managers [T1].
Counterweight: ING warns central-bank buying may slow, in which case private flows must carry the price [T5].
Relative Positioning vs Bitcoin and Ethereum
Cross-asset context from the bundle: BTC dominance sits at 58.87% and total crypto market capitalisation at 2.28 trn USD with 51.6 bn USD of 24h volume. In a neutral-to-negative risk-sentiment regime with moderately negative equity momentum, the digital-asset complex carries high-beta, equity-like exposure while gold’s role is a devaluation and policy hedge with low volatility, the latter quality explicitly cited as improving its appeal to longer-term reserve managers rather than momentum traders [T1]. ING notes gold is up roughly 6% year-to-date in USD terms, a modest figure that leaves the market vulnerable to profit-taking but also means gold has not priced in the froth that higher-beta assets carry [T5]. In a risk-on liquidity improvement, crypto would likely outperform gold on momentum, though gold retains its hedge value. In a risk-off or stagflation turn, gold’s correlation profile is favoured over crypto’s beta for reserve-style allocations [T5].
Analytical judgement: The bundle contains no ETH or BTC price series, only dominance and aggregate market-cap data, so the Ethereum comparison stays qualitative: ETH represents the higher-beta end of the benchmark set, and its expected drawdown profile in the current risk environment is deeper than gold’s. EUR-quoted gold offers diversification rather than return maximisation here.
Scenario Framework
Base case (consolidation with floor): Fed on hold for much of 2026, cuts only late in the year [T8]; real yields elevated but not rising; central-bank floor intact [T6]. ING notes deeper pullbacks would likely attract central-bank and long-term buyers [T5]. XAU/EUR ranges sideways to higher. Signpost in USD terms: holding above $4,200 keeps the market in consolidation rather than a fresh bull leg [T2]; at EUR/USD 1.1611, $4,200 approximates 3,617 EUR and $4,500 approximates 3,874 EUR (conversions are approximate and ignore FX moves since publication). Cross-check: the current 3,745.44 EUR price implies roughly 4,349 USD-equivalent per ounce, sitting between those thresholds.
Hawkish case (real-yield and dollar squeeze): August CPI at +0.4% m/m or stronger revives hike odds [T2]; renewed inflation or employment acceleration revives real yields and the dollar together, the combination Saxo’s Hansen calls the most challenging macro backdrop gold could face [T2]. EUR-quoted gold underperforms via both real-yield lift and translation effects. A drop back below $4,200 signals continued consolidation; an ATH retest moves off the table.
Easing case (renewed bull leg): Inflation pressure fades without second-round effects, the Fed adopts a more moderate tone and resumes easing; UBS identifies falling real yields as the catalyst [T3]. Dollar softness compounds the tailwind [T2]. The 4,688.32 EUR January high becomes the reference target. A secondary relief channel: recovery of trade flows through the Strait of Hormuz under a possible agreement would ease energy-driven inflation [T3].
Stagflation overlay: ING notes slower growth alongside persistent inflation would remain supportive for gold over the longer term [T5], and a Taylor-Rule gap implies inflation-risk repricing favors gold [T1]. Watch Bank of Japan policy normalisation, which MOFSL flags as a global liquidity tightening channel [T4].
Valuation Discussion
Valuation splits between two lenses. Under a pure real-yield model, gold looks rich: SocGen states gold is trading above levels historical models would imply given positive real yields [T1], and Lombard Odier confirms the real-yield link has re-asserted itself [T8]. Under the regime-shift view, the structural floor from central-bank purchases, dedollarisation, geopolitical uncertainty and sovereign-debt concerns justifies the premium, and the gap can persist or widen as long as reserve diversification continues [T1][T6]. This report presents both and does not adjudicate.
Mean-reversion anchors: the price sits 20.11% below the January 2026 ATH of 4,688.32 EUR and 196.02% above the 2019 ATL of 1,265.28 EUR. The EUR-quoted one-year return of +19.1% versus roughly +6% year-to-date in USD terms [T5] reflects different measurement windows plus an FX component; the bundle lacks the series needed for a clean decomposition, so no split is attempted.
Wrapper considerations: PAXG is fully backed, with 432,906.6 oz circulating against a 1.621 bn EUR market cap and a fully diluted valuation equal to market cap (no maximum supply). The implied 3,746 EUR/oz NAV confirms the token tracks spot XAU/EUR with negligible premium or discount, so valuation reduces to the macro valuation of gold itself. Downside to the structural premium: a prolonged ETF-demand decline or weaker physical and jewellery demand would compress it [T8].
Risks
- Hawkish repricing: Hot August CPI (+0.4% m/m expected) boosting Fed hike odds [T2]; a sharp policy reversal rapidly lifting real yields [T6][T8].
- Real-yield and dollar squeeze: The combined revival of real yields and the dollar is the most challenging backdrop [T2]; higher real yields directly raise the opportunity cost of a non-yielding asset [T3].
- Energy-driven inflation: Rising energy prices complicate the easing path [T5]; tariffs feeding into costs sustain higher-for-longer pricing [T4].
- Demand decay: Prolonged ETF-demand decline or lower physical and jewellery demand [T8]; central-bank buying may slow [T5].
- Global liquidity: Gradual Bank of Japan normalisation could tighten global liquidity [T4].
- Profit-taking: With gold up roughly 6% YTD in USD terms, the market is vulnerable to bouts of profit-taking [T5].
- EUR-quote risk (analytical judgement): Euro-area yields are rising (AAA 10Y at 3.50%, +15.7bp over five days). If EUR strength follows, XAU/EUR would mechanically depress even if USD gold holds.
Bearish framing in full: the cyclical driver (real yields) currently has the wheel, the structural buyer may slow, and both USD and EUR rate backdrops are unhelpful. Bullish framing in full: the January drawdown has reset positioning, the dollar is rolling over, US data are softening, ETF flows have returned, and the official sector has absorbed supply at every meaningful dip since 2022 [T1][T2][T6].
Appendix
Data Provenance
All market data retrieved 2026-09-14 04:21 UTC via the daily report pipeline (version 1.0, profile gold_macro). The price series tracks PAX Gold (PAXG), a tokenized gold wrapper, quoted in EUR; token market cap and volume refer to the wrapper, not the physical gold market.
Euro-Area Yield Curve (AAA, ECB)
- 2Y: 3.10%, +22.4bp 5d, +39.2bp 1m, +99.2bp YTD
- 5Y: 3.21%, +19.6bp 5d, +36.8bp 1m, +76.9bp YTD
- 10Y: 3.50%, +15.7bp 5d, +32.7bp 1m, +55.5bp YTD
- 30Y: 3.83%, +7.2bp 5d, +19.5bp 1m, +34.8bp YTD
FX Panel
- EUR/USD 1.1611 (-0.22% 5d, -1.20% YTD)
- EUR/CHF 0.9448 (+0.29% 5d, +1.53% YTD)
- EUR/JPY 178.85 (-0.11% 5d, -2.73% YTD)
- EUR/GBP 0.8582 (-0.05% 5d, -1.56% YTD)
Equity Panel (5d / 1m / YTD)
- DAX 25,568.56 (-1.68% / -2.90% / +4.40%)
- ATX 6,885.23 (-0.29% / +2.61% / +29.52%)
- Euro Stoxx 50 6,310.50 (-1.45% / -3.68% / +8.87%)
- S&P 500 7,656.98 (-0.80% / -1.18% / +11.85%)
- Nasdaq Composite 26,333.04 (-0.66% / -0.96% / +13.30%)
- Nikkei 225 63,366.16 (-2.92% / -7.78% / +25.88%)
- Hang Seng 24,847.00 (-1.86% / -1.07% / -3.06%)
Caveats
- News items lack publication dates; claims are date-stamped only where the source states them (UBS article June 2026, Lombard Odier May 2026, SocGen September 2026). Some content may be stale relative to 2026-09-14.
- The 289-tonne central-bank demand figure is attributed to Saxo via a single secondary source; the 43%-of-73 survey figure is J.P. Morgan-cited survey data. Neither is verified official data.
- USD technical levels ($4,200 / $4,500) are converted to EUR at the current 1.1611 spot and do not capture FX moves since publication.
- The ING “~6% YTD in USD” figure and the bundle’s +19.1% 1y EUR return use different windows and cannot be fully reconciled from available data.
- Euro-area real yields are unavailable in the bundle; only nominal AAA yields are provided, so EUR real-rate analysis is framed qualitatively.
- Conflicting Fed narratives across sources reflect different publication dates within an evolving expectations cycle, not a factual contradiction.
Sources
- [T1] It’s time to get bullish on gold again, says SocGen | Kitco News. https://www.kitco.com/news/article/2026-09-03/its-time-get-bullish-gold-again-says-socgen
- [T2] ICYMI: ETF flows return to gold as Saxo flags 289-tonne central bank demand. https://investinglive.com/commodities/etf-flows-return-to-gold-as-saxo-flags-289-tonne-central-bank-demand
- [T3] Gold: Between inflation fears and diversification of reserves | UBS Global. https://www.ubs.com/global/en/wealthmanagement/insights/marketnews/article.3447284.html
- [T4] Gold looks beyond war as inflation, monetary policy steer prices: Report | Business Standard. https://www.business-standard.com/markets/commodities/gold-looks-beyond-war-as-inflation-monetary-policy-steer-prices-report-126081000233_1.html
- [T5] Geopolitics alone isn’t enough to lift gold | ING THINK. https:/.ing.com/articles/geopolitics-alone-isnt-enough-to-lift-gold
- [T6] Gold’s Dual Drivers: Central Bank Flows and Real Yields, According to Societe Generale | CryptoRank.io. https://cryptorank.io/news/feed/e43c1-gold-central-bank-flows-real-yields-societe-generale
- [T7] Is it a golden era for gold? | J.P. Morgan Private Bank U.S. https://privatebank.jpmorgan.com/nam/en/insights/markets-and-investing/is-it-a-golden-era-for-gold
- [T8] Gold’s slowdown doesn’t signal a reversal | Lombard Odier. https://www.lombardodier.com/insights/2026/may/gold-s-slowdown.html
Compliance Notice
This report is AI-generated and for informational purposes only. It does not constitute investment advice, a recommendation, or an offer to buy or sell any financial instrument. Market data may be delayed or imperfect, and scenario statements are analytical constructions rather than forecasts. Readers should conduct their own due diligence and consult a licensed advisor before making investment decisions.
Important Note / Wichtiger Hinweis:
EN: This report may have been generated using AI. It processes data from publicly available sources. The content is provided for informational purposes only.DE: Dieser Bericht kann mithilfe von KI erstellt worden sein. Dabei werden Daten aus öffentlich zugänglichen Quellen verarbeitet. Die Inhalte dienen ausschließlich Informationszwecken.
* DE: Die ergänzenden Inhalte können KI-generiert sein. EN: The additional content may be AI-generated.