
Listen to the summary
Key Data Snapshot
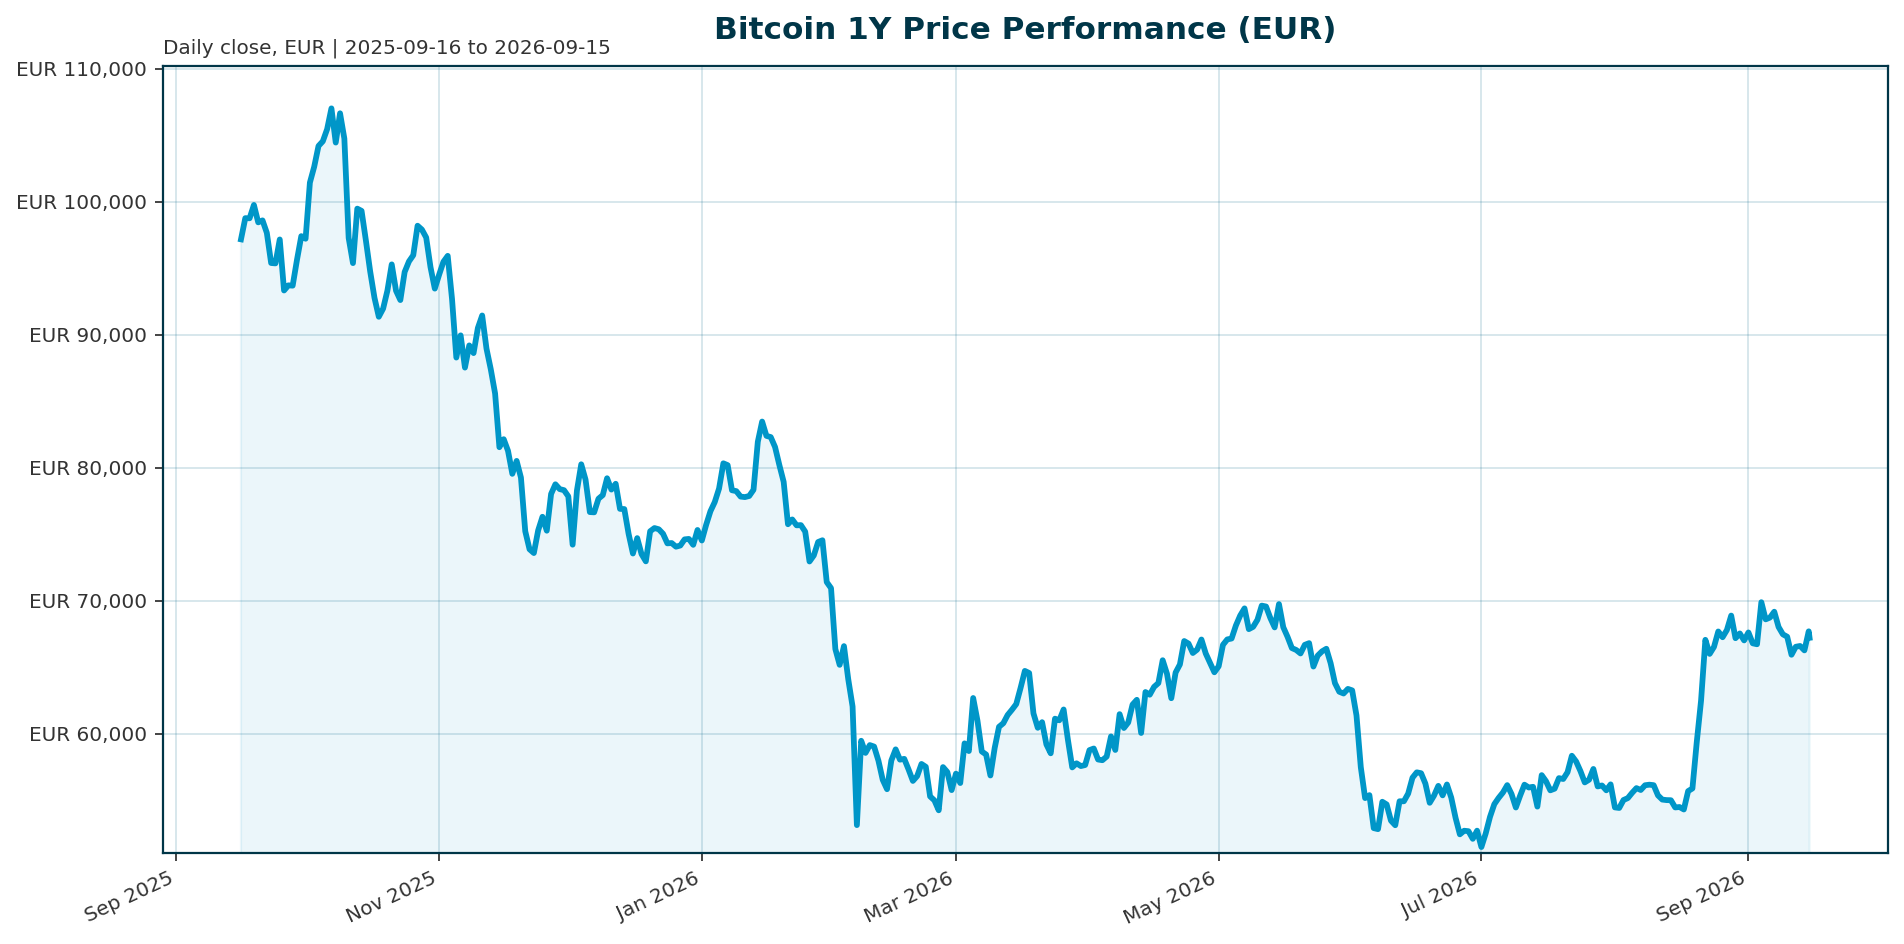
Bitcoin (BTC) trades at EUR 67,286 as of 2026-09-15 (market data retrieved 04:15 UTC). The 30-day return of +23.1% contrasts sharply with a 1-year return of -32.7%, describing a market in tactical recovery within a still-damaged longer trend. BTC remains the largest crypto asset by market capitalization with a dominance of 58.39%.
| Metric | Value (EUR unless noted) |
|---|---|
| Price | 67,286 |
| 24h change / 1h change | +0.36% / -0.30% |
| 7d / 14d / 30d change | -1.6% / -1.0% / +23.1% |
| 200d / 1y change | +15.4% / -32.7% |
| 24h range (high / low) | 68,935 / 67,085 |
| Market cap (rank 1) | 1,351,380,239,599 |
| Fully diluted valuation | 1,351,381,719,863 |
| 24h volume | 26,686,928,283 |
| Volume / market cap | 1.97% |
| Circulating supply | 20,084,496 BTC (95.64% of 21,000,000 max) |
| ATH (2025-10-06) / distance | 107,662 / -37.50% |
| BTC dominance | 58.39% |
| Total crypto market cap | 2,308,105,062,288 |
Positioning within the 24-hour range: (67,286 − 67,085) / (68,935 − 67,085) = 10.9%. BTC sits near the bottom of its intraday range, so the positive 24-hour print does not yet confirm intraday upside momentum. Upside to the all-time high: 107,662 / 67,286 − 1 = +60.0%.
Market Setup
The broader market backdrop is risk-negative and not currently tailored to support a non-yielding, high-beta asset. Risk sentiment is negative and equity momentum is moderately negative: the S&P 500 posts the strongest 5-day move at -0.70%, the Nikkei 225 the weakest at -2.25%, and DACH indicators average -2.12% over 5 days versus -1.41% for global equities, broadly in line with the global picture. The rates backdrop is the key constraint: euro area AAA 10Y yield stands at 3.52%, up 13.3 bp over 5 days, with the curve flattening (10Y-2Y spread at 39.5 bp, consistent with 3.5227% minus 3.1276%). The FX backdrop is mixed, with EUR/USD at 1.1576, down 0.34% over 5 days; a softer euro modestly supports USD-linked crypto translation into EUR terms. These observations are context, not BTC-specific signals, but they matter because Bitcoin’s price action is now tightly linked to liquidity conditions and regulated capital movement [T2]. Rising yields raise the opportunity cost of holding a volatile, non-yielding asset, which has made institutional buyers more selective [T5], and ETF flows have become the most tangible leading indicator of institutional rotation back into digital assets [T2].
Investment Thesis
Bitcoin has transitioned from a halving-cycle-driven speculative asset to an institutionally wrapped, macro-sensitive scarce asset. Spot ETFs approved in the United States in early 2024 created a regulated, familiar conduit for traditional capital [T7], and by end-2025 roughly 6.7 million BTC sat across ETFs, exchanges and treasuries, a phase Glassnode described as Bitcoin’s “institutional supply era” [T1]. Reported volatility declined from 84% to 43%, signalling maturation, though the asset remains a high-beta corner of global markets [T1].
The current setup is deliberately framed as conflicted. On the supportive side: 95.64% of the 21 million maximum supply is already circulating, dominance of 58.39% reinforces BTC’s role as the institutional entry point, and the 30-day rally of +23.1% shows demand responds quickly when conditions improve. On the negative side: the 1-year return of -32.7% and a price 37.50% below the October 2025 high show that institutional wrappers do not immunize the asset against macro de-risking. The same ETF wrapper that legitimizes BTC also makes it more legible to traditional risk-budget behaviour; allocators remain price-sensitive and macro-sensitive, and flows can reverse when inflation data or Fed expectations turn [T6]. Base case: BTC merits institutional attention as a scarce, liquid, high-beta macro asset, with near-term direction set primarily by ETF flow momentum and the rates backdrop [T2].
Bullish Drivers
- Recent momentum: +23.1% over 30 days in EUR terms, the strongest observed return window in the dataset.
- Supply scarcity: only 915,504 BTC (4.36% of maximum supply) remain to be mined; the 21 million cap is structurally fixed.
- ETF flow revival: inflows were described as reviving confidence and making institutional demand visible again, with one source citing roughly USD 467 million of net inflows on May 5 and four consecutive positive days [T8]; another cited daily inflows consistently exceeding USD 400 million [T4]. Note these are dated observations, not live data for the report date.
- Regulatory optionality: the CLARITY Act would establish a federal market-structure framework and could unlock broader institutional participation if passed [T2].
- New market structure: continuous ETF and institutional capital flows now supplement the historical halving cycle, potentially stabilizing demand [T7].
- Scenario references (third-party, not altii forecasts): source-cited 2026 ranges span USD 85,000 to USD 132,000, with some paths toward USD 150,000 contingent on regulation and adoption [T4].
Balanced caveat: if flows remain tactical rather than strategic, bullish catalysts can still produce sharp rallies without a durable re-rating [T6].
Relative Positioning vs Gold and Ethereum
Current gold and Ethereum prices, returns and cross-ratios are not supplied in the data bundle, so this comparison remains qualitative and is explicitly caveated. Structurally, BTC occupies a hybrid position: it carries gold-like scarcity (fixed 21 million cap, 95.64% already circulating) but behaves with technology-sector beta, not defensive-asset behaviour. Evidence for the latter: in the Q4 2025 correction Bitcoin lagged traditional assets including gold and bonds as roughly USD 1 trillion in crypto market value was erased [T1], and record outflows hit both BTC and ETH ETFs, tying both assets to the same regulated capital channel [T1].
Versus Ethereum, BTC’s 58.39% dominance supports its role as the simpler, monetary-asset exposure and the default institutional entry point. If allocators prefer concentrated monetary scarcity over network-beta exposure, BTC outperforms ETH; both, however, share the ETF-flow transmission channel. Versus gold, the trade-off is opportunity cost: with the euro area AAA 10Y at 3.52% and rising, both non-yielding assets face a higher hurdle, but gold typically carries lower beta in defensive regimes while BTC remains macro-sensitive [T5]. One further nuance: in Asia, institutional adoption centres on tokenization and regulated stablecoins rather than pure bitcoin ETF exposure, implying BTC’s relative strategic role is strongest in North America and Europe [T2].
Scenario Framework
Conversions use EUR/USD 1.1576 (EUR value = USD value / 1.1576). Scenario levels are reference points from cited sources, not altii forecasts.
| Scenario | Key assumptions | EUR reference | Return vs spot |
|---|---|---|---|
| Bull | ETF inflows reaccelerate, CLARITY Act passes, dominance holds near 58%+ | 86,389 (USD 100,000) to 114,034 (USD 132,000); stretch 129,584 (USD 150,000) | +28.4% to +69.5%; stretch +92.7% |
| Base | Consolidation near current levels; adoption offsets but does not overwhelm negative risk sentiment and rising yields | 60,000 to 75,000 band; ATH recovery requires +60.0% move to 107,662 | -10.8% to +11.5% |
| Bear | Yields rise further, ETF flows weaken, risk budgets contract | 60,472 (USD 70,000) | -10.1% |
| Stress | High-beta de-risking; ETF outflows amplify price pressure as in Q4 2025 [T1] | 51,838 (USD 60,000) | -22.9% |
Trigger framework: watch daily ETF flow prints as the primary leading indicator [T2], the euro area AAA 10Y yield path (currently 3.52%, +13.3 bp over 5 days), and whether BTC holds implied support. Note that in USD terms the current price is roughly USD 77,890 (67,286 x 1.1576), which sits below the USD 80,000 support level cited in May 2026 sources [T8]; that level converts to EUR 69,105, now functioning closer to resistance than support.
Valuation Discussion
Bitcoin lacks cash flows, so institutional valuation relies on scarcity, adoption, liquidity and relative anchors rather than discounted earnings. The anchors available here:
- Capitalization anchors: market cap of EUR 1.351 trillion versus fully diluted valuation of EUR 1.351 trillion. The near-identical figures (FDV premium of only ~0.0001%) reflect the fact that 95.64% of supply already circulates; scarcity is largely in the market price already.
- Cycle anchor: the price is 37.50% below the EUR 107,662 ATH of October 2025, meaning a full recovery requires +60.0%. The 1-year return of -32.7% confirms the drawdown phase, while the +23.1% 30-day return signals the repair phase is underway.
- Share-of-market anchor: BTC’s market cap is 58.55% of the EUR 2.308 trillion total crypto market cap, consistent with the supplied 58.39% dominance figure.
- Source-linked reference levels (EUR-converted at 1.1576): USD 85,000 / 90,000 resistance zone becomes EUR 73,424 / 77,744; USD 100,000 becomes EUR 86,389; USD 132,000 becomes EUR 114,034; USD 150,000 becomes EUR 129,584. On the downside, USD 80,000 becomes EUR 69,105, USD 70,000 becomes EUR 60,472, USD 60,000 becomes EUR 51,838.
On-chain valuation metrics such as realized cap, MVRV, exchange balances or long-term-holder supply are unavailable in this bundle and are therefore not used. The honest conclusion: at EUR 67,286 the asset trades at a deep discount to its own cycle high but above its 200-day trend (+15.4%), a configuration that historically implies neither cheap nor expensive in cycle terms; the marginal driver is flow, not valuation.
Risks
- Macro liquidity risk: risk sentiment is negative and euro yields are rising; higher yields raise the opportunity cost of holding a non-yielding asset and make institutional buyers selective [T5].
- ETF flow reversal: record Q4 2025 outflows coincided with BTC breaking support near USD 98,000 and retesting the low USD 90,000 range [T1]. Flows can reverse on inflation data, Fed expectations or market stress [T6]. The Fed under Chair Warsh is expected to hold rates through Q3, limiting the easing that historically supported risk-asset recoveries [T2].
- Regulatory disappointment: the CLARITY Act is a potential catalyst but is not passed; failure or delay removes a key bullish trigger [T2].
- Volatility risk: even with reported volatility down from 84% to 43% [T1], BTC remains a high-beta asset; the institutional era still carries old-fashioned crypto volatility [T3].
- Relative underperformance: BTC lagged gold and bonds in the Q4 2025 correction [T1] and could lag Ethereum or tokenization themes if institutional adoption shifts toward broader digital-asset infrastructure [T2].
- Data risk: no live ETF-flow series, gold data, Ethereum data or on-chain metrics are available for the report date; the framework above depends on dated qualitative sources.
Appendix
Calculations
- 24h range position: (67,286 − 67,085) / (68,935 − 67,085) = 10.9%.
- Volume/market cap: 26,686,928,283 / 1,351,380,239,599 = 1.97%.
- Circulating share of max supply: 20,084,496 / 21,000,000 = 95.64%; remaining supply 915,504 BTC (4.36%).
- Dominance check: 1,351,380,239,599 / 2,308,105,062,288 = 58.55%, vs supplied 58.39%.
- Upside to ATH: 107,662 / 67,286 − 1 = +60.0%.
- 10Y-2Y spread: 3.5227% − 3.1276% = 39.5 bp, matching the market-overview observation.
- Implied USD price: 67,286 x 1.1576 = USD 77,890.
- EUR conversions at EUR/USD 1.1576: USD 80,000 = EUR 69,105; USD 85,000 = EUR 73,424; USD 90,000 = EUR 77,744; USD 100,000 = EUR 86,389; USD 132,000 = EUR 114,034; USD 150,000 = EUR 129,584; USD 70,000 = EUR 60,472; USD 60,000 = EUR 51,838.
Data Notes and Limitations
Market data retrieved 2026-09-15T04:15:06Z; report generated 2026-09-15T04:15:21Z; quote currency EUR. The market-overview module provides equities, rates and FX context and is not a BTC-specific valuation input. No live ETF-flow time series, current gold price, current Ethereum price, ETH/BTC or gold/BTC ratios are supplied; relative positioning is therefore qualitative. Several cited price levels are USD-denominated and were converted at the supplied EUR/USD rate of 1.1576 dated 2026-09-15; intraday FX moves may create small discrepancies. Source-cited forward-looking price ranges are third-party scenario references, not altii forecasts.
Sources
- [T1] Crypto Market 2025: Year-End Review & Expert Insights, tradingview.com
- [T2] Q2 2026 Digital Asset Review, coindesk.com
- [T3] Bitcoin Holds Near $80K-$81K as ETF Inflows Revive Bullish Sentiment, hedgeco.net
- [T4] Bitcoin Price Prediction 2026: Institutional Adoption, intellectia.ai
- [T5] US Treasury Yields Surge to New Highs as Liquidity Tightens, cryptoslate.com
- [T6] Bitcoin ETF Flows Lose Momentum After April Surge, hedgeco.net
- [T7] Bitcoin Price Faces a Pivotal Shift: New Market Structure, cryptorank.io
- [T8] Bitcoin Price Analysis May 2026, intellectia.ai
This report is AI-generated and is provided for informational purposes only. It does not constitute investment advice, a recommendation, or an offer to buy or sell any financial instrument. Figures are based on data retrieved at the timestamps stated above and may be inaccurate or outdated. Readers should conduct their own due diligence and consult a licensed advisor before making investment decisions.
Important Note / Wichtiger Hinweis:
EN: This report may have been generated using AI. It processes data from publicly available sources. The content is provided for informational purposes only.DE: Dieser Bericht kann mithilfe von KI erstellt worden sein. Dabei werden Daten aus öffentlich zugänglichen Quellen verarbeitet. Die Inhalte dienen ausschließlich Informationszwecken.
* DE: Die ergänzenden Inhalte können KI-generiert sein. EN: The additional content may be AI-generated.