
The altii-Gold-Report: Gold (XAU) in EUR
Listen to the summary
Key Data Snapshot
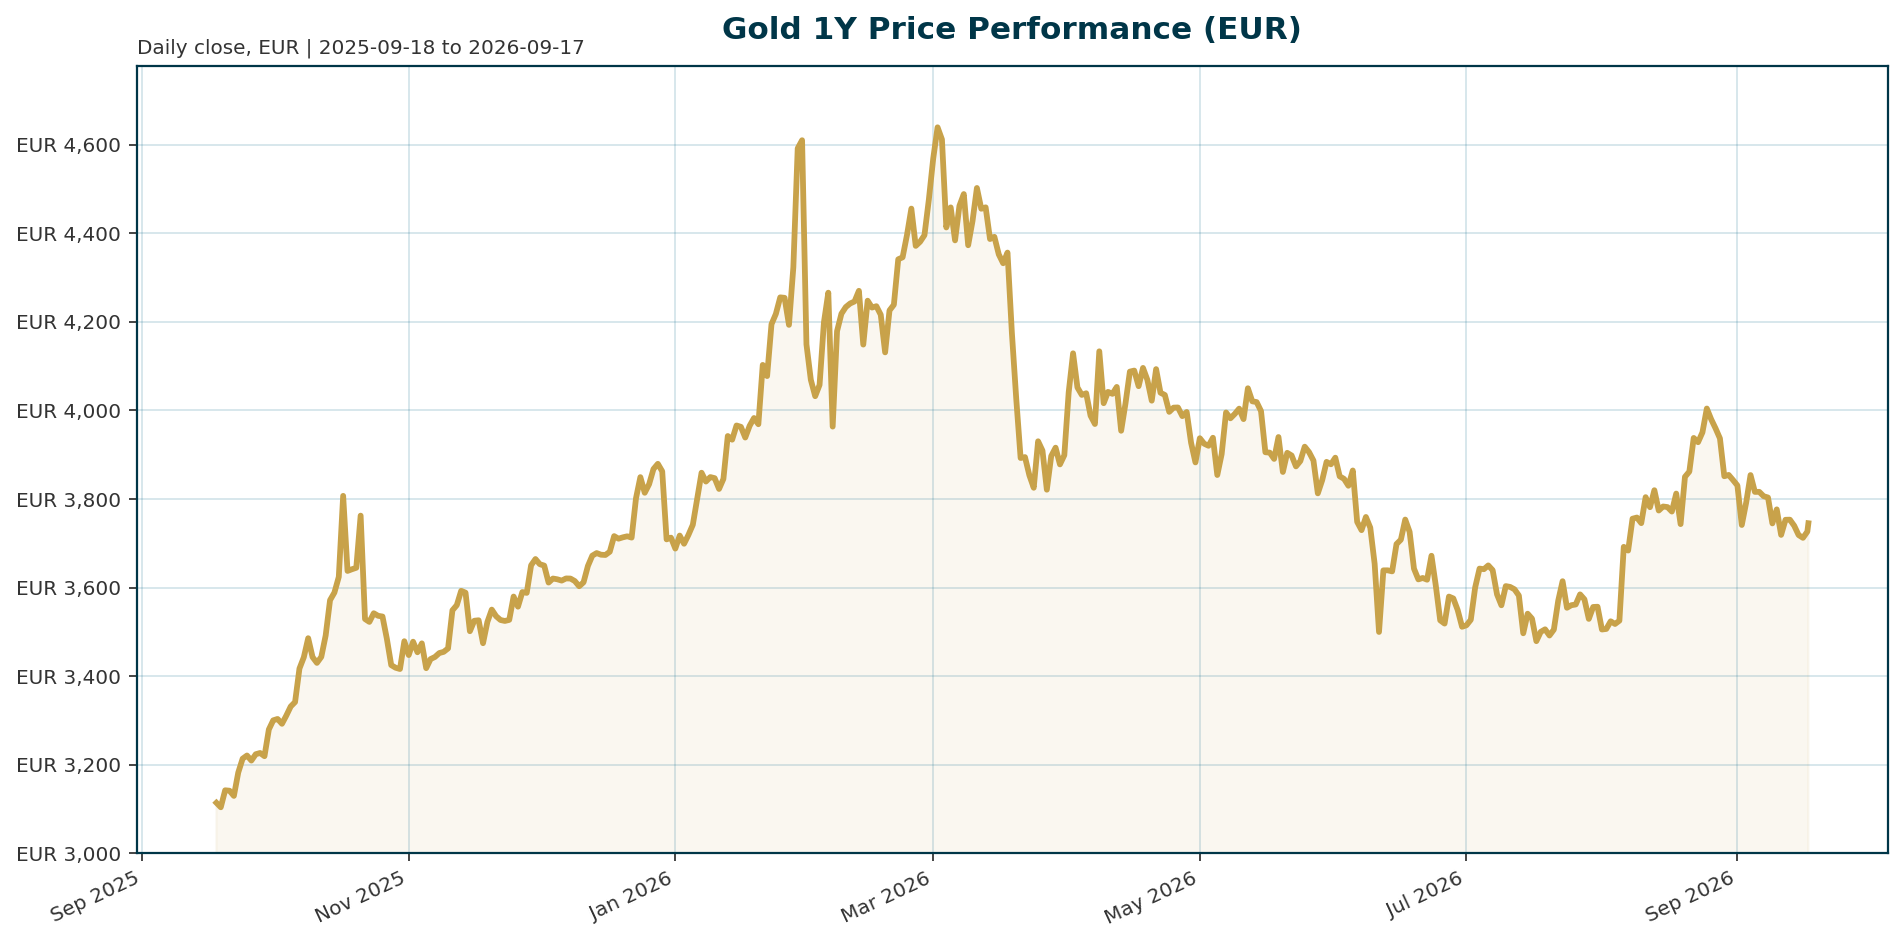
| Metric | Latest | Interpretation |
|---|---|---|
| XAU/EUR price | €3,748.61 | Up 0.11% over 24h, but still in tactical consolidation. |
| Short-term performance | 7d: -2.7%; 14d: -2.9%; 30d: -2.2% | Momentum remains negative across near-term horizons. |
| Medium and long-term performance | 200d: -19.3%; 1y: +16.3% | The correction is material, but the annual trend remains positive. |
| 24h range | €3,703.50 to €3,801.66 | Range: €98.16. Range/spot = 98.16 / 3,748.61 = 2.62%. |
| All-time high | €4,688.32 on 28 Jan 2026 | Current drawdown: -20.04%. Upside to regain ATH = 4,688.32 / 3,748.61 – 1 = 25.07%. |
| Tokenized proxy liquidity | Market cap: €1.63bn; 24h volume: €192.93mn | Volume/market cap = 192.93 / 1,628.79 = 11.84%. These are PAXG proxy figures, not total physical gold market figures. |
| EUR/USD translation | EUR/USD: 1.1549 | Implied USD gold equivalent = 3,748.61 x 1.1549 = $4,329.27. |
Bottom line: EUR gold is not in a confirmed upside breakout. It is in a correction phase within a still-positive one-year trend. The allocation case depends on whether structural reserve demand and policy uncertainty continue to offset the tactical drag from rising yields.
Macro Backdrop
Cross-asset conditions are neutral-to-negative. Equity momentum is moderately negative, DACH markets are broadly in line with global markets, euro-area yields are rising with curve flattening, and FX is mixed. The euro-area AAA 10Y yield is 3.54%, up 11.7 bp over five days, while EUR/USD is 1.1549, down 0.53% over five days. DACH indicators average -0.08% over five days versus -0.43% for global equity indicators, and the Hang Seng is the weakest five-day performer at -1.26%. This backdrop is not outright crisis-like, but it keeps hedging demand relevant.
For gold, the key macro issue is not geopolitics alone. It is whether geopolitics, inflation and policy uncertainty change real rates, monetary expectations and reserve behavior. ING argues that geopolitical shocks support gold only when they affect inflation, monetary policy expectations and real interest rates, while higher-for-longer real yields remain a headwind [T3].
The rates signal is mixed for EUR investors. Euro-area AAA 2Y yields are 3.19%, 10Y yields are 3.54%, and the 10Y-2Y spread is 35.6 bp. The five-day move shows flattening: 10Y yields rose 11.71 bp, while 2Y yields rose 21.15 bp, so the spread changed by 11.71 – 21.15 = -9.44 bp. A flatter curve driven by front-end repricing usually tightens financial conditions and pressures non-yielding assets.
The dollar channel is also two-sided. EUR/USD weakness can mechanically support EUR gold if USD gold is stable. But a broad shock that lifts both real yields and the dollar is the most difficult macro setup for gold, as Saxo commentary cited by InvestingLive also highlights [T2]. Morningstar/MarketWatch notes that gold may increasingly trade as insurance against policy-framework uncertainty rather than only as an inflation hedge or inverse-rate trade [T7].
Investment Thesis
Gold in EUR remains a strategic hedge against policy uncertainty, fiscal stress, reserve diversification and the gradual erosion of monetary credibility. The case is not purely cyclical. SocGen argues that a post-2022 regime shift has allowed gold to trade near record highs despite positive real yields, supported by central bank buying, dedollarisation, geopolitical uncertainty and sovereign debt concerns [T1].
The bullish thesis is strongest when viewed as a reserve-asset thesis. Central banks and sovereign investors do not behave like leveraged momentum investors. They buy gold for diversification, sanctions resilience, liquidity, and long-term reserve management. EBC describes central banks as structural buyers driven by reserve diversification and geopolitical hedging rather than short-term opportunity cost [T6].
The bearish counterpoint is clear. Gold remains sensitive to real yields because it produces no income. Lombard Odier notes that falling real yields reduce the opportunity cost of holding gold, while higher-for-longer real yields, weaker ETF demand or softer physical demand would be negative [T5]. The current price, €3,748.61, is 20.04% below the January 2026 high. That drawdown creates better entry optics, but not automatic undervaluation.
Institutional stance: maintain a strategic allocation bias, but treat the current setup as consolidation rather than a confirmed re-accumulation phase. Confirmation requires stabilization in real yields, evidence of durable flows, or renewed pressure on policy credibility.
Bullish Drivers
- Central bank demand: EBC reports that central banks purchased more than 3,200 tonnes between 2022 and 2024, including about 1,136 tonnes in 2022, 1,037 tonnes in 2023 and around 1,045 tonnes in 2024 [T6]. GoldSilver also cites 863 tonnes of central bank purchases in 2025 and 244 tonnes in Q1 2026, above the prior quarter and the five-year average [T8].
- Reserve manager intentions: J.P. Morgan cites a record 43% of 73 global monetary authorities expecting their own gold reserves to increase over the next year [T4]. EBC also cites a 2024 survey in which 29% of respondents planned to increase gold holdings over the following 12 months [T6].
- Dedollarisation and sanctions resilience: Countries facing elevated geopolitical risk or seeking to reduce reliance on dollar reserves have incentives to hold more gold [T4]. This supports gold as a neutral reserve asset, especially where trust in the dollar-based system is politically constrained.
- Policy uncertainty premium: SocGen frames gold as a hedge against monetary and policy uncertainty, with structural demand creating a higher price floor than traditional real-yield models imply [T1].
- ETF stabilization: SocGen says gold-backed ETF inflows have moderated sharply but remain positive [T1]. InvestingLive also reports that ETF flows have returned to gold [T2]. Renewed ETF demand would add a cyclical layer to the structural bid.
- Stagflation hedge: ING notes that slower growth alongside persistent inflation would remain supportive for gold over the longer term [T3]. This is relevant if central banks cannot ease aggressively without reigniting inflation risk.
- EUR translation support: EUR/USD has fallen 0.53% over five days. If USD gold is unchanged, EUR weakness mechanically raises local-currency gold. Conversely, a 1% EUR/USD rise would reduce EUR gold by roughly 1%, all else equal.
Relative Positioning vs Bitcoin and Ethereum
Gold should be positioned as a lower-beta reserve and policy-credibility hedge. Bitcoin and Ethereum remain important digital-asset benchmarks, but the supplied data do not include BTC or ETH spot prices, returns, volatility, flows, market caps or valuation metrics. Therefore, a quantitative relative-performance claim is unavailable.
| Asset | Available data | Portfolio role | Current assessment |
|---|---|---|---|
| Gold | XAU/EUR price, returns, drawdown, EUR rates, EUR FX, tokenized proxy liquidity | Reserve asset, policy hedge, inflation and crisis diversifier | Supported structurally, tactically constrained by rising yields. |
| Bitcoin | BTC dominance: 58.33%; no spot or return data supplied | Crypto beta, digital scarcity, liquidity-cycle exposure | Relative valuation unavailable from this bundle. |
| Ethereum | Listed as benchmark asset; no ETH market data supplied | Smart-contract platform exposure, crypto beta, network activity sensitivity | Relative valuation unavailable from this bundle. |
Total crypto market cap is $2.285tn and total crypto 24h volume is $81.05bn, with BTC dominance at 58.33%. These aggregate figures confirm that crypto markets remain large and liquid, but they do not support a conclusion that gold has outperformed or underperformed BTC or ETH.
Gold should outperform crypto beta in scenarios dominated by reserve diversification, policy credibility stress and neutral-to-negative risk appetite. BTC and ETH should regain relative appeal if real yields stabilize, risk appetite recovers and policy uncertainty falls. That relative call cannot be quantified with the current inputs.
Scenario Framework
| Scenario | Macro setup | Gold implication in EUR | Key signposts |
|---|---|---|---|
| Base case: consolidation | Rising euro yields, mixed FX, neutral-to-negative risk sentiment, resilient reserve demand | Range-bound trading around current levels, with tactical downside risk but strategic support. | 10Y AAA yield at 3.54%; 10Y-2Y spread at 35.6 bp; EUR/USD at 1.1549. |
| Bull case: reserve bid dominates | Real yields stop rising, USD weakens or EUR remains soft, ETF flows stabilize, central banks keep buying | Gold retests higher EUR levels and begins to close the 20.04% drawdown from ATH. | Positive ETF flow headlines, lower real-yield pressure, continued dedollarisation demand [T1][T2]. |
| Bear case: real-yield shock | Inflation or employment data revive both real yields and the dollar | Structural demand fails to prevent a deeper correction. | Saxo identifies the combination of stronger real yields and stronger dollar as the toughest backdrop for gold [T2]. |
| Policy credibility recovery | Tighter policy restores orderly bond markets, steadier inflation expectations and confidence in inflation control | Gold loses part of its uncertainty premium and underperforms. | Morningstar/MarketWatch frames this as a potentially bearish outcome for gold [T7]. |
| Stagflation | Growth weakens while inflation remains persistent | Gold benefits from real-asset demand, reserve diversification and monetary uncertainty. | ING notes that stagflation would remain longer-term supportive for gold [T3]. |
Valuation Discussion
Gold has no cash flow, coupon or earnings stream. Its valuation rests on opportunity cost, currency translation, reserve demand and insurance value. The current EUR price is 20.04% below the January 2026 all-time high, but that alone does not make gold cheap. The relevant question is whether the structural reserve-demand premium remains intact as yields rise.
The historical real-yield model still matters. GoldSilver cites a strong inverse relationship between gold prices and real interest rates from 2003 to roughly 2022, with a rolling 12-month correlation averaging -0.73 [T8]. But the same framework argues that the relationship partly decoupled in 2024 and 2025 as central bank demand replaced ETF flows as the marginal buyer [T8].
For EUR investors, USD reference levels need translation. InvestingLive cites $4,500 as a 200-day moving-average test and $4,200 as a level below which the market would look more like consolidation than a fresh bull leg [T2]. Using EUR/USD at 1.1549:
- $4,500 / 1.1549 = €3,896.44.
- $4,200 / 1.1549 = €3,636.68.
- $4,360 / 1.1549 = €3,775.22.
Current XAU/EUR at €3,748.61 sits below the translated $4,360 level and above the translated $4,200 level. That positioning supports a consolidation interpretation: not cheap enough to ignore macro risks, but not weak enough to invalidate the strategic allocation case.
Risks
- Higher real yields: Higher-for-longer real yields increase the opportunity cost of holding a non-yielding asset and remain the clearest valuation headwind [T5].
- Dollar plus yield shock: A renewed acceleration in inflation or employment that lifts both real yields and the dollar would be the most difficult backdrop for gold [T2].
- Policy credibility recovery: If tighter policy stabilizes bond markets and inflation expectations, gold could lose its uncertainty premium [T7].
- ETF and physical demand risk: Lombard Odier highlights prolonged ETF weakness and lower physical demand, including jewellery demand, as negative factors even if central bank buying offsets part of the weakness [T5].
- Central bank slowdown: ING notes that central banks remain supportive, but buying may slow [T3]. A slower official-sector bid would weaken the structural floor.
- Profit-taking: ING notes that gold was still up roughly 6% year-to-date in its referenced context, leaving it vulnerable to bouts of profit-taking [T3].
- EUR strength: If EUR/USD rises materially, EUR-denominated gold can underperform USD gold even if the dollar gold price is stable.
- Data proxy risk: Market cap, supply and volume figures come from the PAXG tokenized gold proxy. They should not be treated as total physical gold market valuation or liquidity.
- Benchmark limitation: BTC and ETH relative positioning is qualitative because no BTC or ETH spot, return, volatility or valuation data are supplied.
Appendix
Methodology and Data Notes
- Bundle generated at: 2026-09-17T04:55:05.760855Z.
- Market data retrieved at: 2026-09-17T04:54:54.154913Z.
- Quote currency: EUR.
- CoinGecko proxy: pax-gold. Market cap, volume, supply and rank relate to the tokenized proxy, not the global physical gold market.
- Intraday range calculation: €3,801.66 – €3,703.50 = €98.16. Range as percentage of spot: €98.16 / €3,748.61 = 2.62%.
- ATH drawdown cross-check: €3,748.61 / €4,688.32 – 1 = -20.04%.
- Upside to ATH: €4,688.32 / €3,748.61 – 1 = 25.07%.
- Implied USD gold equivalent: €3,748.61 x 1.1549 = $4,329.27.
- Euro-area 10Y-2Y spread: (3.5437008047 – 3.1878043845) x 100 = 35.59 bp.
- Five-day curve impulse: 11.7135 bp – 21.1512 bp = -9.44 bp, consistent with flattening.
- Missing inputs: current real yields, inflation breakevens, DXY, global physical gold market cap, ETF flow time series, primary central bank purchase tables, BTC spot data and ETH spot data are unavailable.
Sources
- [T1] It’s time to get bullish on gold again, says SocGen | Kitco News
- [T2] ICYMI: ETF flows return to gold as Saxo flags 289-tonne central bank demand
- [T3] Geopolitics alone isn’t enough to lift gold | ING THINK
- [T4] Is it a golden era for gold? | J.P. Morgan Private Bank U.S.
- [T5] Gold’s slowdown doesn’t signal a reversal | Lombard Odier
- [T6] How Geopolitics and Central Banks Are Driving Gold Higher | EBC Financial Group
- [T7] Gold is starting to move on something a lot bigger than inflation
- [T8] How Gold Price Cycles Work: A Full Framework
Compliance Statement
This report is AI-generated, for informational purposes only, and not investment advice. It does not constitute a recommendation to buy, sell or hold any security, commodity, token or financial instrument.
Important Note / Wichtiger Hinweis:
EN: This report may have been generated using AI. It processes data from publicly available sources. The content is provided for informational purposes only.DE: Dieser Bericht kann mithilfe von KI erstellt worden sein. Dabei werden Daten aus öffentlich zugänglichen Quellen verarbeitet. Die Inhalte dienen ausschließlich Informationszwecken.
* DE: Die ergänzenden Inhalte können KI-generiert sein. EN: The additional content may be AI-generated.