
Listen to the summary
Key Data Snapshot
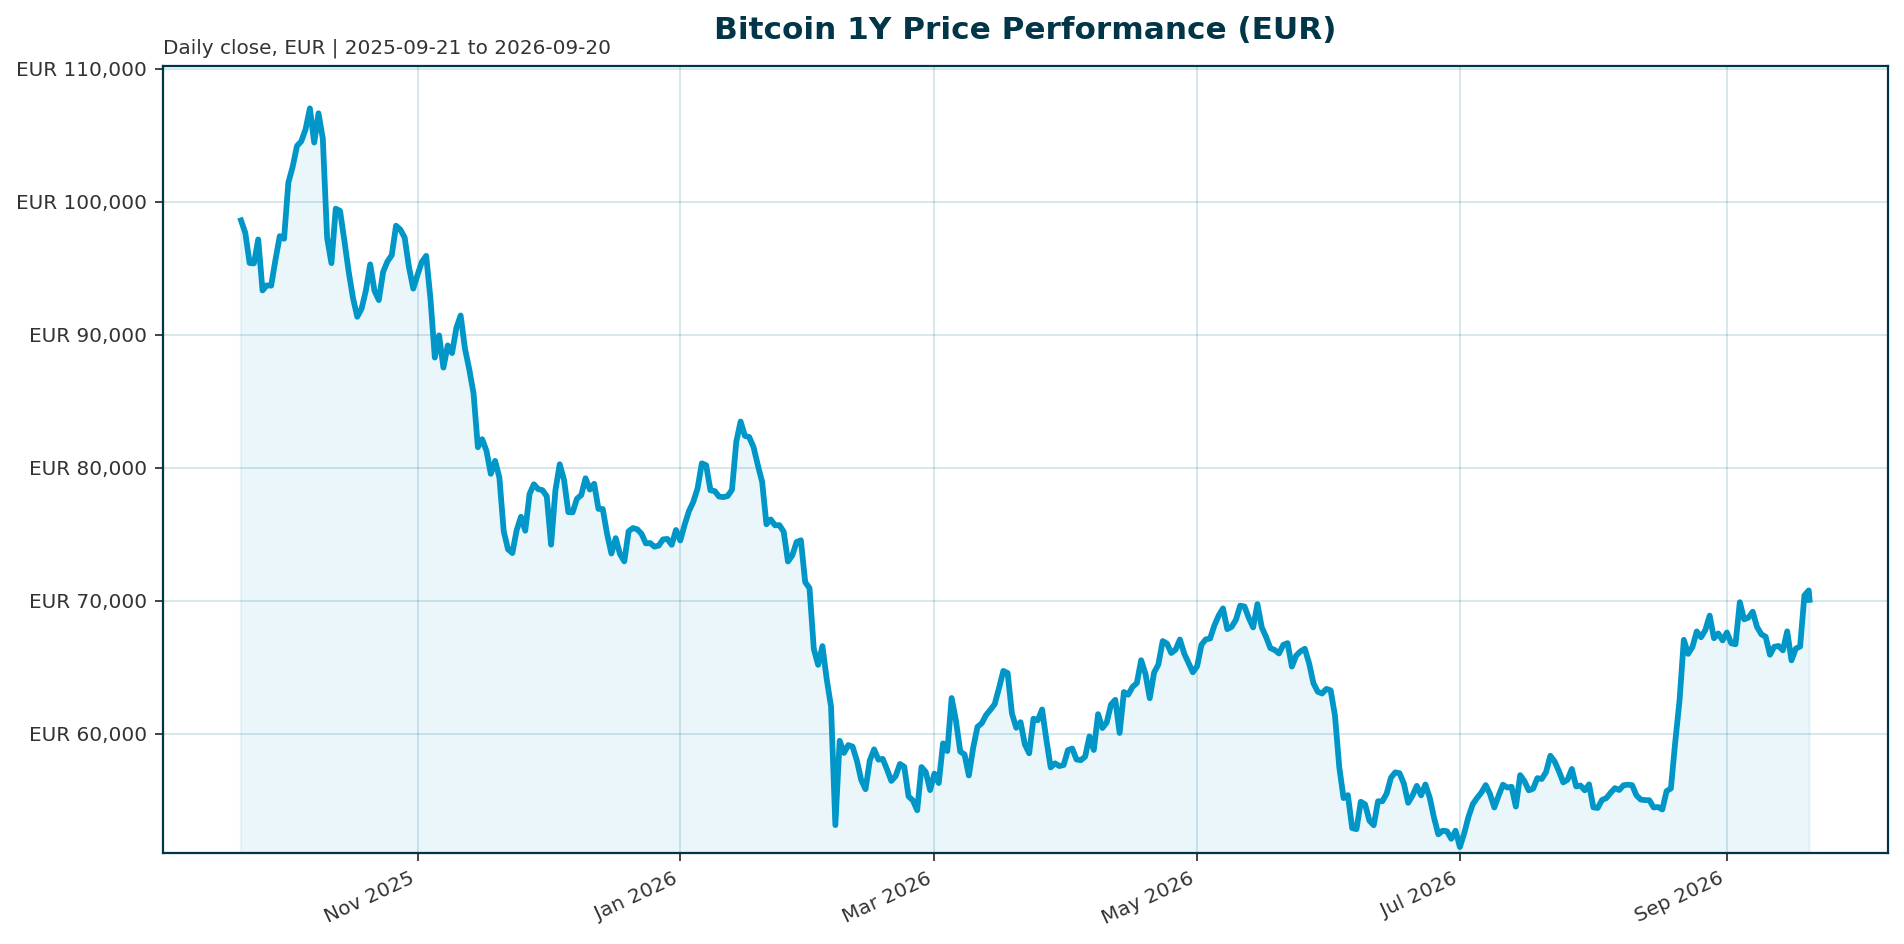
All figures are point-in-time as of 2026-09-20 (market data retrieved 04:15 UTC). Quote currency: EUR.
| Metric | Value |
|---|---|
| Price (BTC/EUR) | EUR 70,010 |
| Market cap / FDV | EUR 1.406 trillion / EUR 1.406 trillion |
| 24h volume | EUR 21.43 billion |
| 24h range | EUR 69,855 to 71,317 |
| Changes (1h / 24h / 7d / 14d / 30d) | +0.2% / -0.92% / +4.1% / +0.7% / +8.1% |
| Changes (200d / 1y) | +17.9% / -30.4% |
| Market-cap rank / dominance | 1 / 58.93% |
| Circulating / max supply | 20,086,640 / 21,000,000 BTC |
| ATH (EUR, 2025-10-06) | EUR 107,662; price is 34.97% below |
Derived metrics: turnover ratio = 21,427,735,235 / 1,406,297,224,154 = 1.52% of market cap per day. Issued supply = 20,086,640 / 21,000,000 = 95.65%; 913,360 BTC (4.35%) remain to be mined. Upside to retest the EUR ATH = 107,662 / 70,010 – 1 = +53.8% (a mechanical distance, not a forecast). Current price sits at the 10.6th percentile of the 24h range ((70,010 – 69,855) / (71,317 – 69,855)), consistent with the negative 24h change.
Market Setup
The supplied cross-asset backdrop is neutral rather than risk-on. Risk sentiment is neutral, equity momentum is mixed, and DACH indicators average -0.01% over five days versus +0.85% globally, broadly in line. Rates are a constraint: the euro area AAA 10Y yield stands at 3.49% (up 53.9 bp YTD, down 3.5 bp over five days) and the AAA 10Y-2Y spread sits at 33.9 bp, a flattening backdrop. FX is mixed, with EUR/USD at 1.1493, down 0.51% over five days. Within this, BTC itself is constructive: it is up 4.1% over seven days and 8.1% over 30 days, but still down 30.4% year over year and 34.97% below its October 2025 ATH. The macro backdrop remains the primary variable, with the Fed expected to hold rates through Q3, leaving limited room for the policy easing that has historically supported risk-asset recoveries [T2]. Rising US Treasury yields raise the opportunity cost of holding a volatile, non-yielding asset like BTC, making institutional buyers more selective [T5]. The market overview is context; the decision-relevant signal for BTC is institutional flow data, which sources treat as the most tangible leading indicator of institutional rotation [T2].
Investment Thesis
Bitcoin’s investable case for EUR-based institutions rests on four pillars. First, scarcity: 95.65% of the 21 million maximum supply is already issued, with only 913,360 BTC of future issuance remaining. Second, dominance: at 58.93% of the EUR 2.38 trillion total crypto market cap, BTC is the primary crypto beta and the cleanest risk-sentiment proxy for the asset class. Third, institutional market structure: by the end of 2025, 6.7 million BTC sat across ETFs, exchanges and treasuries, an “institutional supply era” in which spot ETFs and regulated vehicles made BTC an allocatable line item for private banks and institutions [T1]. ETF flows have effectively become Bitcoin’s new macro indicator [T1], and US-listed spot ETFs plus digital asset treasury companies now shape price discovery [T7]. Fourth, maturation: volatility has fallen from 84% to 43% [T1], though this does not make BTC defensive. The honest framing separates the two clocks: structurally, adoption and regulated access continue to broaden [T3]; tactically, BTC remains a high-beta allocation whose near-term price depends on ETF flows and macro liquidity [T3]. A bearish counterpoint belongs in the thesis itself: the 2024 halving cycle has not prevented a 30% one-year drawdown, and reduced volatility coexisted with more than USD 1 trillion of market value erased in Q4 2025 [T1].
Bullish Drivers
- ETF flow momentum. Bitcoin ETF inflows surged to USD 1.92 billion in the most recent reported week, concentrated in large regulated vehicles such as BlackRock’s IBIT, signaling institutional rather than retail demand [T8]. Sustained inflows over several weeks can provide structural support for price rallies, especially when futures-driven liquidity is weaker [T6].
- Regulatory catalyst. The CLARITY Act would establish a federal market-structure framework for digital assets and could unlock broader institutional participation if passed [T2]. Clarity in custody, market structure and tax treatment could widen participation among sidelined institutions [T6].
- Structural adoption. Institutional buyers are responding to ETF access and improving regulatory visibility, not solely to easy-money expectations [T3]. Daily ETF inflows above USD 400 million have been cited as a persistent institutional channel [T4].
- Supply constraint. With 95.65% of supply issued and a hard cap of 21 million coins, incremental demand meets structurally limited float [T3][T8].
- Product innovation. Covered-call crypto ETFs, multi-asset index products and institutional model portfolios could deepen the regulated access channel [T6].
Balance: these drivers are flow-dependent. The same sources note that the macro backdrop is not fully supportive and that the bullish structure must still prove it can hold key levels [T3].
Relative Positioning vs Gold and Ethereum
Against gold: no current gold price or performance data is supplied in the bundle, so the comparison must stay qualitative. The one supplied data point is bearish for BTC’s recent relative record: during the Q4 2025 correction, Bitcoin lagged traditional assets like gold and bonds despite the institutional era [T1]. Structurally, BTC is a higher-beta scarcity asset: both share capped supply narratives, but gold carries a multi-millennium store-of-value record while BTC’s is fifteen years old. A useful qualitative role split is gold for defensive ballast, BTC for asymmetric, flow-sensitive crypto beta.
Against ethereum: no ETH price, market cap or performance data is supplied. What can be said from the bundle is positional: BTC holds market-cap rank 1 and 58.93% dominance, making it the primary crypto allocation, while BTC-ETH ETF flow comparisons have become central to market-structure analysis; investors are advised to track daily BTC and ETH inflows separately from volume and compare against three-day forward spot returns [T6]. Record Q4 2025 outflows from both BTC and ETH ETFs coincided with BTC breaking support near USD 98,000 [T1], showing the two assets share flow sensitivity rather than BTC having decoupled.
Scenario Framework
USD levels from sources are converted to EUR using EUR/USD 1.1493 (point-in-time). Conversions: USD 80,000 = EUR 69,609; USD 82,000 = EUR 71,350; USD 85,000 = EUR 73,962; USD 90,000 = EUR 78,310; USD 98,000 = EUR 85,267; USD 132,000 = EUR 114,835; USD 150,000 = EUR 130,513.
| Scenario | Assumptions | Reference levels (EUR) |
|---|---|---|
| Bull | Sustained ETF inflows, regulatory progress (CLARITY Act), stable liquidity | Break above 73,962 (USD 85k); path toward 114,835 to 130,513 (USD 132k to 150k external scenario references [T4]); ATH retest at 107,662 requires +53.8% |
| Base | Neutral risk sentiment, Fed on hold, mixed EUR rates/FX; BTC range-bound with ETF flows as the tactical signal [T2] | Range roughly 69,609 to 78,310 (USD 80k to 90k), centered on spot at 70,010 |
| Bear | ETF flows stall or reverse [T6], yields rise, opportunity-cost pressure on a non-yielding asset [T5] | Loss of the 69,609 floor (USD 80k); prior episode showed breaks of 85,267 (USD 98k) with a retest of 78,310 (USD 90k) [T1] |
The market’s current near-term battleground, per sources, is the USD 80,000 to 82,000 zone, or EUR 69,609 to 71,350 [T3][T5]. Spot at EUR 70,010 sits inside it, which is consistent with the base case.
Valuation Discussion
Bitcoin has no cash flows, so valuation rests on scarcity, liquidity, relative size and drawdown positioning. Market cap is EUR 1.406 trillion against a fully diluted valuation of EUR 1.406 trillion, a gap of roughly 0.0001%, confirming that dilution is nearly exhausted. Daily turnover of 1.52% of market cap indicates a deep, institutional-scale secondary market, though reported exchange volume is not a guarantee of executable institutional depth. The dominance check validates: 1,406,297,224,154 / 2,379,953,919,809 = 59.1%, close to the supplied 58.93%; the small difference is rounding and timing in the bundle. On external scenario references, analytics-platform predictions range from USD 85,000 to USD 132,000 for 2026, with some paths to USD 150,000 contingent on favorable regulation and continued institutional adoption [T4]; converted, that is roughly EUR 73,962 to EUR 114,835, with EUR 130,513 as the top reference. These are externally sourced scenario markers, not proprietary forecasts. The valuation tension is explicit: scarcity metrics are strong, but higher yields raise the opportunity cost of holding a non-yielding, volatile asset [T5], and a 34.97% drawdown from the EUR ATH shows the market has already repriced the scarcity premium once in the past year.
Risks
- ETF-flow reversal. The ETF channel is central to marginal demand; when flows weaken, spot loses its clearest demand source [T5]. Record Q4 2025 outflows coincided with support breaks near USD 98,000 [T1]. If flows stall, Bitcoin may need another catalyst [T6].
- Macro tightening. Higher US Treasury yields raise the opportunity cost of holding BTC [T5]; with the Fed expected to hold through Q3, policy easing that historically supported risk-asset recoveries is limited [T2].
- Treasury-company channel fatigue. ETF inflows slowed in 2025 versus 2024, and treasury firms may face a tougher path issuing equity as premiums compress, limiting their ability to drive another powerful impulse higher without a clear risk-on backdrop [T7].
- Regulatory disappointment. Delayed or unfavorable market-structure reform, including non-passage of the CLARITY Act, would remove a key institutional catalyst [T2][T6].
- Volatility persistence. Volatility fell from 84% to 43% [T1], but BTC still erased over USD 1 trillion in market value in Q4 2025 and remains a high-beta corner of global markets [T1][T3].
- Data limitations. No live ETF-flow dataset, no current gold or ETH market data, and no on-chain metrics beyond supply are supplied; several cited sources have incomplete metadata. Conclusions here should be weighted accordingly.
Appendix
Calculations
- Turnover: 21,427,735,235 / 1,406,297,224,154 = 1.523%
- Issued supply: 20,086,640 / 21,000,000 = 95.65%; remaining: 913,360 BTC = 4.35%
- FDV gap: (1,406,308,846,075 / 1,406,297,224,154) – 1 = +0.0001%
- Ath upside: 107,662 / 70,010 – 1 = +53.78%; absolute gap: EUR 37,652
- 24h range position: (70,010 – 69,855) / 1,462 = 10.6%; range spread EUR 1,462 = 2.09% of spot
- Dominance check: 1,406,297,224,154 / 2,379,953,919,809 = 59.09% vs supplied 58.93%
- Market cap 24h change: -14,165,670,788 EUR = -0.997%, consistent with the -0.92% price change (small difference reflects circulating-supply drift)
Methodology and Data Notes
Market data is a snapshot retrieved 2026-09-20T04:15:06Z; news at 04:15:09Z; market overview at 04:15:21Z with no errors. USD-to-EUR conversions use the supplied EUR/USD rate of 1.1493 and are point-in-time only. Some news items carry null source and published_at fields. Gold and Ethereum current prices, market caps and performance are not supplied; relative positioning versus these benchmarks is therefore qualitative. ETF-flow figures derive from source summaries, not primary flow tables. The report is generated as of 2026-09-20.
Sources
- [T1] Crypto Market 2025: Year-End Review & Expert Insights. tradingview.com
- [T2] Q2 2026 Digital Asset Review. coindesk.com
- [T3] Bitcoin Holds Near $80K-$81K as ETF Inflows Revive Bullish Sentiment. hedgeco.net
- [T4] Bitcoin Price Prediction 2026: Institutional Adoption. intellectia.ai
- [T5] US Treasury yields surge to new highs as liquidity tightens, pushing Bitcoin back below $82,000 resistance. cryptoslate.com
- [T6] Bitcoin and Ether ETF Inflows Rebound. blockchain-council.org
- [T7] Kraken sees 2026 crypto markets shifting from hype to structure as macro forces reshape bitcoin cycle. theblock.co
- [T8] Bitcoin ETF Inflows Surge to $1.92 Billion Last Week. cryptonomist.ch
Compliance notice: This report is AI-generated, for informational purposes only, and does not constitute investment advice. Figures are point-in-time snapshots and may not reflect current market conditions. Investors should conduct their own due diligence and consult licensed advisors before making allocation decisions.
Important Note / Wichtiger Hinweis:
EN: This report may have been generated using AI. It processes data from publicly available sources. The content is provided for informational purposes only.DE: Dieser Bericht kann mithilfe von KI erstellt worden sein. Dabei werden Daten aus öffentlich zugänglichen Quellen verarbeitet. Die Inhalte dienen ausschließlich Informationszwecken.
* DE: Die ergänzenden Inhalte können KI-generiert sein. EN: The additional content may be AI-generated.