
The altii-Gold-Report: Consolidation With a Structural Floor
Date: 20 September 2026 | Asset: Gold (XAU, quoted in EUR) | Profile: Gold Macro
Listen to the summary
Key Data Snapshot
| Metric | Value | Comment |
|---|---|---|
| Price (XAU/EUR) | EUR 3,797.77 | 24h range EUR 3,797.48 to 3,805.73 |
| 1h / 24h / 7d change | 0.0% / -0.13% / +0.1% | Flat short term |
| 14d / 30d change | -1.6% / -3.6% | Mild cyclical drift lower |
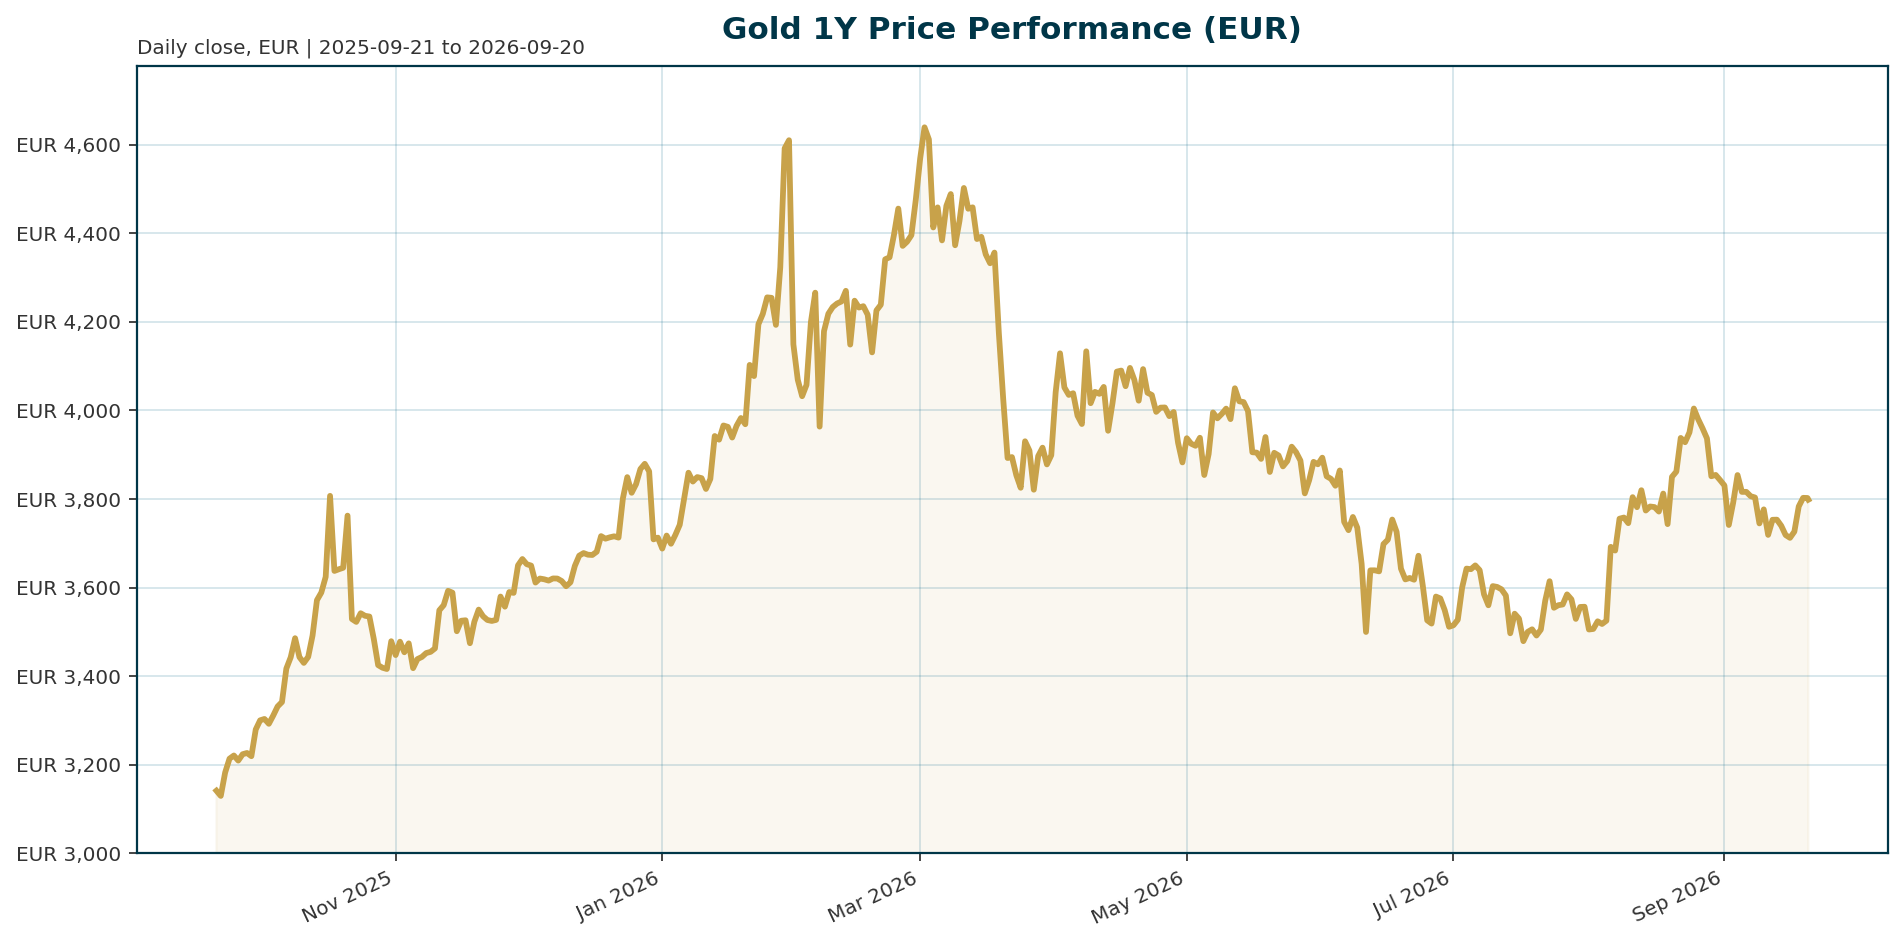
| 200d change | -15.7% | Drawdown from January peak |
| 1y change | +18.3% | Structural uptrend intact |
| All-time high | EUR 4,688.32 (2026-01-28) | Currently -19.0% below: (3,797.77 – 4,688.32) / 4,688.32 |
| All-time low | EUR 1,265.28 (2019-11-17) | Currently +200.15% above |
| Market cap (tokenized instrument) | EUR 1.65bn | 434,499 oz-equivalents; rank #50 |
| 24h volume | EUR 52.4m | Turnover ratio: 52.4m / 1,650m = 3.18% |
| Euro AAA 10Y yield | 3.49% (-3.5bp over 5d) | ECB AAA curve, 2026-09-17 |
| Euro AAA 2Y yield | 3.15% (+104bp YTD) | 10Y-2Y spread 33.9bp; flattening |
| EUR/USD | 1.1493 (-0.51% 5d, -2.20% YTD) | Euro strength dampens XAU/EUR vs USD gold |
The multi-horizon profile describes consolidation within a structural uptrend: modest short-term losses, a 15.7% pullback from the January high, but an 18.3% one-year gain. Note that price and market-cap figures reflect the tokenized PAXG instrument quoted in EUR, not the physical gold market.
Macro Backdrop
Market overview: Risk sentiment is neutral and equity momentum is mixed, with DACH indices broadly in line with global peers (DACH indicators average -0.01% over 5 days versus +0.85% globally). The rates backdrop shows euro yields mixed with curve flattening: the AAA 10Y sits at 3.49%, down 3.5bp over 5 days, while the 2Y has risen 104bp year-to-date, compressing the 10Y-2Y spread to 33.9bp. FX is mixed: EUR/USD at 1.1493 (-0.51% over 5 days), with EUR/JPY the strongest 5-day mover at +0.48%. Notably, the Nikkei 225 leads on a 5-day basis at +2.40% while the Hang Seng lags at -0.67%. These conditions are context, not the driver of the gold thesis.
Gold-relevant macro: The dominant tension is the direction of US monetary policy and real yields. One narrative stream has markets moving from pricing easing to debating one or two further Fed hikes, pushing 2Y Treasury yields back above 4% and supporting the dollar [T1]. A second, more recent stream points the other way: a 0.6% drop in July US retail sales, the first decline in nine months, softer employment and inflation data, Goldman Sachs calling a September hike very unlikely, and the Bloomberg Dollar Index rolling over [T3]. ING sits in between: the Fed held this week with Powell requiring clearer inflation progress, but its economist still expects two 25bp cuts in September and December, while rising energy prices complicate the inflation outlook [T4]. These are competing scenario inputs, not a settled consensus, and the divergence reflects different points in the 2026 policy cycle.
Investment Thesis
The core thesis is a two-layer framework. The structural layer: a post-2022 regime shift has broken the historical inverse relationship between gold and real yields. Despite real yields at their highest since the 2008 financial crisis, gold traded near record highs in 2023 with a +13% return ending at USD 2,068, and has held well above mid-2025 levels despite the hawkish repricing [T5] [T1]. SocGen attributes this to a higher price floor built from sustained central bank purchases, dedollarisation trends, geopolitical uncertainty and sovereign debt concerns [T1]. The cyclical layer: short-term direction still follows real yields and the dollar. With much of the hawkish adjustment already priced in, SocGen argues a materially larger inflation shock and a more aggressive Fed response would be needed for another significant rates repricing, making downside risk increasingly limited [T1]. Lombard Odier concurs that the recent slowdown is not a reversal, expecting the Fed on hold for most of 2026 with cuts more likely late in the year, and viewing the yield and dollar headwinds as temporary [T8].
The euro layer matters for this report specifically. EUR/USD is -2.20% YTD, meaning euro strength against the dollar has mechanically dampened XAU/EUR performance relative to USD gold. Part of the 15.7% 200-day decline in the EUR-quoted series reflects translation, not USD-gold weakness.
The counterargument deserves equal weight: the de-dollarisation narrative is overhyped, central-bank diversification can coexist with dollar dominance, a rising gold share of reserves can result from valuation effects rather than physical purchases, and a zero-cash-flow asset is substantially less attractive when investors earn positive real returns elsewhere [T2].
Bullish Drivers
- Official-sector demand: Saxo flags 289 tonnes of central bank demand, with ETF flows returning to gold [T3]. Poland is the largest reported buyer, China has extended its buying streak to nearly two years, and South Korea has returned after a 13-year pause; the World Gold Council expects substantial net official buying through the rest of 2026 [T7].
- Broad official intent: A record 43% of 73 surveyed monetary authorities expect their gold reserves to increase over the next year, citing sanctions risk and inflation volatility [T5].
- Underpriced inflation risk: Even priced-in Fed hikes would not align policy with the Atlanta Fed’s Taylor Rule model, implying inflation risks remain underpriced [T1].
- Improving flow backdrop: ETF inflows have moderated this year but remain positive, and lower volatility improves gold’s appeal to longer-term reserve managers [T1].
- Regime tailwinds: A stagflationary mix of slower growth and persistent inflation would be supportive longer term [T4], as would fiscal uncertainty and the gradual erosion of purchasing power favouring real assets [T8].
The demand floor tightens if official buying holds above roughly 250t annualized and ETF flows turn durably positive. In that configuration, downside shocks get absorbed faster.
Relative Positioning vs Bitcoin and Ethereum
The bundle provides no current Bitcoin or Ethereum price series for this date, so direct return spreads are unavailable; the comparison below relies on dominance data, market structure and narrative characteristics.
- Context metrics: BTC dominance stands at 58.92% and the total crypto market cap at roughly EUR 2.38tn equivalent. The tokenized gold instrument ranks #50 by market cap at EUR 1.65bn, a small fraction of the crypto complex.
- Demand quality: Gold’s marginal buyer is increasingly the official sector, a price-insensitive, multi-year accumulator [T7]. Crypto’s marginal buyer is flow-dependent, and ETF inflows can reverse extremely quickly [T2]. SocGen explicitly notes lower volatility is drawing longer-term reserve managers toward gold rather than short-term momentum traders [T1].
- Technical framing: Hansen’s USD thresholds of 4,500 (200-day moving average) and 4,200 as bull versus consolidation triggers apply to the USD-quoted series; converted at EUR/USD 1.1493 they map to approximately EUR 3,915 and EUR 3,654, valid only at this FX snapshot [T3].
- Scenario split: In risk-on conditions, the crypto complex likely outperforms and gold lags relatively while retaining its hedge allocation. In risk-off conditions, gold’s official-sector floor should outperform flow-dependent crypto assets. Gold functions here as the low-volatility, reserve-grade anchor of the alternative asset complex, not its momentum vehicle.
Scenario Framework
| Scenario | Assumptions | XAU/EUR Implication |
|---|---|---|
| Bull | ING’s baseline materializes: two 25bp cuts in September and December, real yields fall, dollar rolls over, ETF flows re-accelerate [T4] [T3] | Sustained break above USD 4,500 (approx. EUR 3,915) draws momentum and ETF demand; retest of ATH territory in EUR terms |
| Base | Fed on hold for much of 2026, real yields plateau at elevated levels, 289t official demand floor holds [T8] [T3] | Sideways range with upside optionality; pullbacks attract central bank and long-term buyers [T4] |
| Bear | Renewed acceleration in inflation or employment data revives real yields and the dollar together, the most challenging backdrop for gold [T3] | Break below USD 4,200 (approx. EUR 3,654) signals extended consolidation; structural-floor thesis tested |
| Stagflation | Growth slows while inflation persists, Fed squeezed between mandates [T4] | Historically the most gold-supportive regime despite elevated nominal yields |
Valuation Discussion
Gold produces no cash flow, so valuation must avoid false precision. Three reference points frame the discussion. First, the broken model: gold remained resilient while real yields rose to their highest since 2008, and posted a +13% return in 2023 to a record USD 2,068 under a hawkish Fed, evidence the traditional real-yield fair-value framework understates current prices [T5]. Second, the structural re-rating: SocGen’s post-2022 floor argument implies current levels represent fair value within consolidation rather than euphoric extension [T1]. Third, positioning metrics: at -19.0% from the EUR ATH and +200.15% above the EUR ATL, with an 18.3% one-year gain, the instrument sits mid-cycle.
The euro translation effect must be isolated: with EUR/USD -2.20% YTD, part of the EUR-quoted pullback reflects currency strength rather than USD-gold weakness. Precise decomposition of the one-year figure is not possible because the bundle lacks a one-year EUR/USD history; we state that assumption explicitly.
The bearish valuation counterweight is real: high prices can destroy jewellery demand and stimulate recycling and mine investment, and the rising gold share of reserves may partly be a valuation effect rather than physical accumulation [T2]. If the floor thesis is partly illusion, reversion toward pre-regime model levels reopens meaningful downside.
Risks
- Real-yield and dollar twin revival: A renewed acceleration in inflation or employment data reviving both real yields and the dollar together is the most challenging macro backdrop gold could face [T3].
- Opportunity cost: Positive real returns elsewhere make a zero-cash-flow asset substantially less attractive; today’s environment differs fundamentally from historical bull markets when cash and bonds offered little real return [T2].
- Flow reversal: ETF inflows can reverse extremely quickly; high prices can destroy jewellery demand while stimulating recycling and mine supply [T2]. Lombard Odier’s negative watch items are higher-for-longer real yields, a prolonged ETF demand decline, and weak physical demand [T8].
- Narrative risk: The de-dollarisation story is overhyped; official diversification can coexist with dollar dominance, and rising reserve gold shares may be valuation-driven [T2].
- Official-sector divergence: Russia and Turkey have been substantial net sellers, showing central bank demand is not monolithic [T7].
- Profit-taking: With gold still up roughly 6% year-to-date in USD terms, the market is vulnerable to bouts of profit-taking, though deeper pullbacks would likely attract official and long-term buyers [T4].
Two bear paths dominate: a rates-driven path (inflation surprise, hawkish repricing, 2Y yields sustainably above 4%, stronger dollar, break of the consolidation floor) and a flow-driven path (prolonged ETF deterioration while official buying slows below WGC expectations, removing both marginal buyers simultaneously).
Appendix
Methodology Notes
- Instrument caveat: Price, market cap and supply figures reflect the tokenized PAXG instrument (434,499 oz-equivalents circulating, EUR 1.65bn market cap, rank #50), not the physical gold market. PAXG prices may diverge slightly from spot XAU/EUR references used by cited sources.
- Currency translation: USD-denominated technical levels from sources (USD 4,200, USD 4,500, USD 2,068 record) are not directly comparable to the EUR-quoted series. Translations use EUR/USD 1.1493 and are snapshot-accurate only.
- Data timestamps: Market data retrieved 2026-09-20T04:48:23Z. Euro-area yields from the ECB AAA curve as of 2026-09-17; equity data as of 2026-09-18 close; FX from Frankfurter as of 2026-09-20.
- Source dating: Several news items lack explicit publication dates and appear to span different points in the 2026 policy cycle, including hike-debate and cut-expectation framings. Conflicting Fed narratives are presented as scenario inputs rather than a single consensus. Events between source publication and this report date are not captured.
- Source provenance: Eight sources span sell-side research (SocGen via Kitco), bank research (ING, JPMorgan Private Bank, Lombard Odier), and commentary (Saxo via investingLive, BullionExchanges). Two social-media items (X/Twitter, Facebook) are used only for skeptical counterargument framing and are labelled as such.
- Data gaps: No current BTC/ETH price series and no euro-area inflation or real-yield series were available in the bundle. Where a metric is unavailable, it is stated as such in the relevant section.
Sources
- [T1] It’s time to get bullish on gold again, says SocGen | Kitco News. https://www.kitco.com/news/article/2026-09-03/its-time-get-bullish-gold-again-says-socgen
- [T2] Ricky Ho on X (social media commentary). https://x.com/rickyho_1989/status/2098206017490497691
- [T3] ICYMI: ETF flows return to gold as Saxo flags 289-tonne central bank demand. https://investinglive.com/commodities/etf-flows-return-to-gold-as-saxo-flags-289-tonne-central-bank-demand
- [T4] Geopolitics alone isn’t enough to lift gold | ING THINK. https://www.ing.com/articles/geopolitics-alone-isnt-enough-to-lift-gold
- [T5] Is it a golden era for gold? | JPMorgan Private Bank. https://privatebank.jpmorgan.com/nam/en/insights/markets-and-investing/is-it-a-golden-era-for-gold
- [T6] When gold rallies despite rising yields while central banks stockpile (Facebook commentary). https://www.facebook.com/nicholascrownfb/posts/1104530762153313
- [T7] Gold Reserves Shift as Central Banks Buy and Sell in 2026 | BullionExchanges. https://bullionexchanges.com/blog/central-bank-gold-buying-in-2026-who-is-buying-and-why
- [T8] Gold’s slowdown doesn’t signal a reversal | Lombard Odier. https://www.lombardodier.com/insights/2026/may/gold-s-slowdown.html
Compliance Disclaimer
This report is AI-generated and provided for informational purposes only. It does not constitute investment advice, a recommendation, or an offer to buy or sell any financial instrument. Data may be incomplete, delayed or inaccurate, and AI-generated analysis may contain errors. Readers should conduct their own research and consult a licensed financial advisor before making investment decisions.
Important Note / Wichtiger Hinweis:
EN: This report may have been generated using AI. It processes data from publicly available sources. The content is provided for informational purposes only.DE: Dieser Bericht kann mithilfe von KI erstellt worden sein. Dabei werden Daten aus öffentlich zugänglichen Quellen verarbeitet. Die Inhalte dienen ausschließlich Informationszwecken.
* DE: Die ergänzenden Inhalte können KI-generiert sein. EN: The additional content may be AI-generated.