
Listen to the summary
Key Data Snapshot
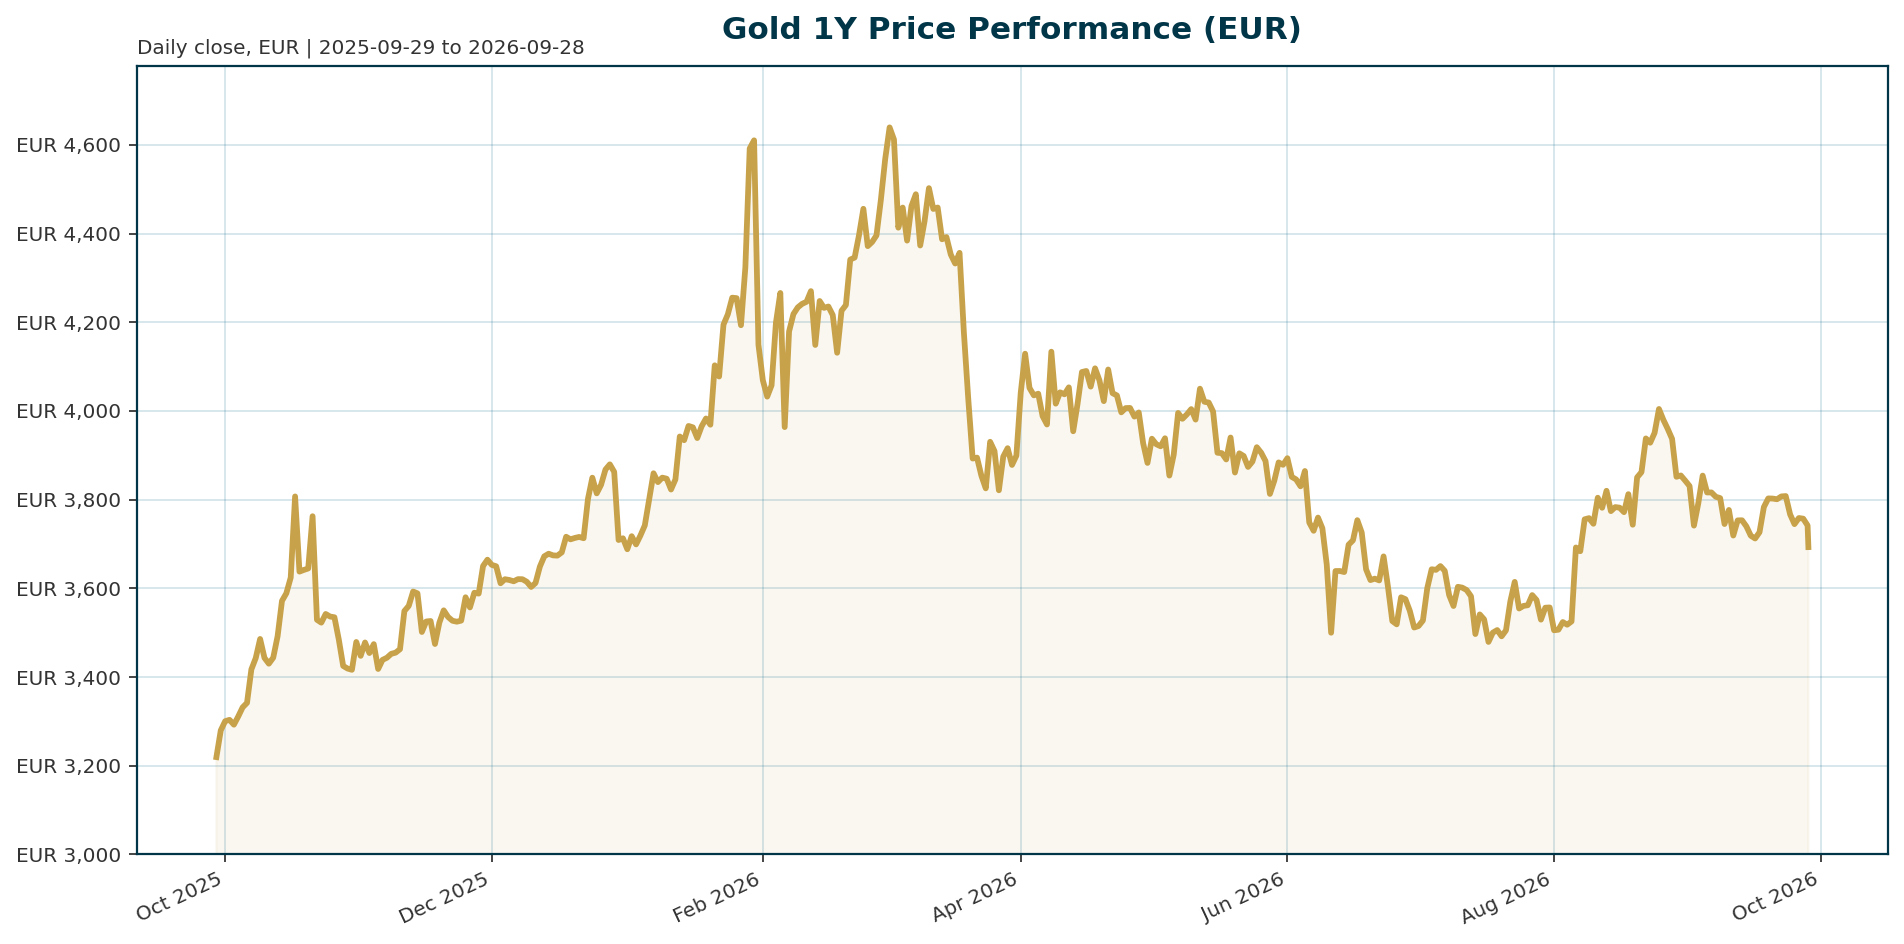
| Metric | Value | Change / Context |
|---|---|---|
| XAU/EUR spot | EUR 3,689.67 | 24h range 3,685.46 to 3,757.95 |
| 24h return | -1.74% | Market cap of tokenized wrapper -1.76% over 24h |
| 7d return | -3.55% | 14d -3.09% |
| 30d return | -5.78% | Corrective phase across all tactical horizons |
| 200d return | -18.42% | Deepest rolling drawdown in the series |
| 1y return | +11.15% | Positive despite the multi-month correction |
| All-time high | EUR 4,688.32 (2026-01-28) | Spot is -21.30% below; +27.06% recovery needed to revisit |
| All-time low | EUR 1,265.28 (2019-11-17) | Spot is +191.61% above |
| Euro AAA 10Y yield | 3.57% | +3.6bp 5d, +32.1bp 1m, +61.8bp YTD |
| Euro AAA 2Y yield | 3.23% | +112.1bp YTD; 10Y-2Y spread 33.7bp |
| EUR/USD | 1.1400 | +0.04% 5d, -2.98% YTD |
The market cap, volume (EUR 92.6m over 24h), supply (434,898.6 units) and rank (58) in this dataset refer to the tokenized gold wrapper, not the global gold market. We label them accordingly throughout. A euro-area inflation expectations series is not available, so euro real yields cannot be computed precisely; we use nominal yield drift as a proxy.
Macro Backdrop
Market overview: risk sentiment is neutral and equity momentum is mixed, with DACH indicators broadly in line with global peers (DACH averaging -0.01% over 5 days versus +0.26% globally). The rates backdrop shows mixed euro yields: the AAA 10Y at 3.57% and the 2Y at 3.23%, with the 2Y up 112.1bp year to date against 61.8bp for the 10Y, a hawkish front-end repricing. FX is mixed: EUR/USD at 1.1400, essentially flat over 5 days but down 2.98% year to date, with EUR/CHF the strongest 5-day mover at +0.43%. Notably, Nikkei 225 leads 5-day performance at +3.26% while Hang Seng lags at -1.76%. This neutral, rate-heavy backdrop matters mainly through its effect on euro-denominated yields, which set the opportunity cost of holding gold for EUR-based investors.
The dominant macro story for gold is the Fed repricing. Markets have shifted from pricing additional easing to debating whether the Fed will raise rates once or twice more, pushing 2Y Treasury yields back above 4% [T1]. The Fed left rates unchanged at its latest meeting, with Chair Powell requiring clearer inflation progress before easing, although ING’s US economist still expects two 25bp cuts this year [T2]. Rising energy prices tied to geopolitical tension keep inflation elevated and complicate the easing path [T2]. SocGen argues that a materially larger inflation shock and a much more aggressive Fed response would be needed to force another significant rates repricing, meaning much of the hawkish adjustment is already in the price [T1]. Lombard Odier expects the Fed on hold for much of 2026 with any cut late in the year, and views the current headwinds from higher yields and a stronger dollar as temporary rather than structural [T8].
For EUR-quoted gold specifically, the front-end euro yield surge is a direct headwind: the opportunity cost of holding a zero-yield asset in euro terms has risen sharply this year, independent of USD dynamics.
Investment Thesis
Our core framework is a dual-driver model. Driver one is structural: central bank demand has become the dominant backstop. Emerging-market reserve managers are diversifying away from the dollar following recent geopolitical shocks, and SocGen sees no sign of the trend abating, providing a consistent price floor that absorbs supply and reduces gold’s sensitivity to short-term rate expectations [T4]. Reported in June 2026, central banks now hold more gold than US Treasuries, a landmark in reserve composition [T5]. Survey evidence is equally firm: a record 43% of 73 monetary authorities expect their own gold reserves to rise over the next year, citing sanctions vulnerability and inflation volatility [T6]. Driver two is cyclical: real yields govern tactical direction. The historical inverse relationship has re-asserted itself in recent months after a two-year breakdown [T8].
The strategic conclusion follows from the interaction of the two. Gold has decoupled from historical real-yield models: despite persistently positive real yields, it has traded near record highs, what SocGen calls a clear post-2022 regime shift in which sustained central bank purchases, dedollarisation, geopolitical uncertainty and sovereign debt concerns set a higher floor [T1]. Gold is now priced by fundamental shifts in global reserve management, not just speculative flows [T4]. Meanwhile, advanced-economy debt at or near post-war highs implies resolution through some mix of financial repression, inflation and currency depreciation, all gold-favourable outcomes [T5].
Balanced view: the thesis is not one-sided. Rising prices themselves could moderate official buying as existing reserves appreciate [T2, T3], and a sharp policy reversal lifting real yields rapidly remains the identified headwind [T4]. Our base case is consolidation: the structural floor limits downside while the absence of a fresh real-yield tailwind caps upside.
Bullish Drivers
The structural tailwinds are specific and measurable in direction, if not in tonnage (central bank purchase volumes are not available in this dataset).
First, the official-sector floor. Sustained central bank purchases, dedollarisation, geopolitical uncertainty and sovereign debt concerns provide a higher floor limiting the downside from elevated real rates [T1]. Geopolitically exposed and non-aligned states are actively increasing reserves to reduce sanctions vulnerability [T6].
Second, the fiscal-inflation channel. Public debt-to-GDP in many advanced economies sits at or near post-war highs. History suggests such burdens get resolved through financial repression, inflation and currency depreciation, scenarios in which gold historically outperforms [T5]. Lombard Odier frames the same point: the macro context favours real assets amid fiscal uncertainty and gradual purchasing-power erosion [T8].
Third, the rates asymmetry. With much of the hawkish adjustment already priced and a larger shock required for another significant repricing, SocGen sees downside risk for gold as increasingly limited and remains strategically bullish [T1]. A stagflationary mix of slower growth and persistent inflation would be the strongest longer-term support [T2].
Fourth, demand quality. ETF inflows have moderated sharply this year but remain positive, and lower volatility improves gold’s appeal to longer-term reserve managers rather than short-term momentum traders [T1], a more durable shareholder base. Any deeper pullback would likely attract central bank and long-term buyers [T2].
Relative Positioning vs Bitcoin and Ethereum
Context: Bitcoin dominance stands at 58.69% and total crypto market capitalisation at roughly USD 2.51 trillion with USD 88.75bn in 24h volume. The tokenized gold wrapper’s EUR 92.6m daily volume is a fraction of that turnover, but this comparison is misleading because the wrapper represents only tokenized physical gold, not the full gold market. Per-asset Bitcoin and Ethereum price and return data are not available in this dataset, so a precise return table versus the crypto benchmarks cannot be produced; we flag this as a data gap.
Qualitatively, the positioning contrast is clear. Gold is priced by reserve managers and structural demand shifts [T4]; crypto carries no official-sector bid. Gold’s 2020 bull-market origin was the hedge against monetary debasement and financial instability [T3]; that role has no crypto analogue in central bank reserve frameworks. Lower volatility is improving gold’s appeal to longer-term reserve managers [T1], while crypto remains the higher-beta expression of liquidity conditions.
Scenario differentiation matters. In the current neutral risk regime with mixed equity momentum, both assets can coexist in diversified portfolios: crypto offers tactical upside if risk appetite improves, while gold’s structural floor limits its downside. In a risk-off or policy-uncertainty regime, gold’s reserve sponsorship should outperform crypto decisively. The key relative risk for gold allocators is a broad risk-on acceleration, which would reduce hedging demand [T3] and favour Bitcoin and Ethereum tactically. Gold’s -21.3% drawdown from its January ATH is nonetheless shallower in behavioural terms than typical crypto drawdowns, and its +11.15% one-year return was achieved with a sponsor base that does not flee on hawkish surprises.
Scenario Framework
Probabilities are judgemental strategist weights, not model outputs.
Scenario 1, Consolidation (weight ~50%). Fed on hold much of 2026, cuts only late-year [T8]; hawkish adjustment largely priced [T1]; euro yields drift in a mixed pattern. Gold ranges roughly EUR 3,500 to 3,900 in EUR terms, with dips absorbed by official-sector and long-term buyers [T2]. The current -5.78% 30d move fits this path.
Scenario 2, Hawkish shock (weight ~20%). A renewed inflation spike forces an aggressive Fed response; real yields surge and the structural floor is tested. The EUR drawdown from the ATH extends beyond the current -21.3%. Watch for front-end euro yields rising faster than the 112bp YTD already booked.
Scenario 3, Stagflationary pivot (weight ~20%). Growth rolls over while energy-driven inflation stays sticky [T2]. Gold re-rates strongly as the inflation hedge reasserts itself despite elevated nominal yields, challenging the EUR 4,688.32 ATH. This is the gold-optimal macro mix.
Scenario 4, Risk-on de-escalation (weight ~10%). Meaningful US-China de-escalation, a stronger dollar and stabilising growth lift real yields and reduce the embedded risk premium [T3]. Hedging demand fades and gold drifts lower, but the central-bank floor caps losses [T2, T3].
Valuation Discussion
On traditional models, gold should be materially lower. Persistently positive real yields would historically imply significantly lower prices than where gold has traded [T1]. The breakdown is well documented: US 10Y real yields swung from around -1.2% to +2.5% between 2022 and 2023 [T3], historically among the strongest headwinds for the metal, yet gold posted a +13% return in 2023 and ended at a record [T6]. The un-modelled component is the risk premium investors now attach to sovereign debt, dedollarisation and geopolitical factors [T1, T5].
In EUR terms, spot at 3,689.67 sits 21.30% below the January 2026 ATH but 191.61% above the 2019 ATL. The correction has coincided with a tactical re-assertion of the real-yield link [T8] and a 112bp YTD surge in euro 2Y yields, so part of the pullback is mechanically explained by rising opportunity cost rather than structural demand failure.
The verdict hinges on which driver dominates. If the structural floor thesis holds, gold at -21.3% from ATH is closer to fair value than the traditional model implies, making current levels attractive for strategic accumulation. If the post-2022 regime shift partially mean-reverts with the real-yield link fully restored, model fair value sits materially below spot and the correction has further to run. The +27.06% recovery needed to revisit the ATH is contextual arithmetic, not a forecast.
Risks
The dominant risk is a growth-stabilisation-driven rise in real yields [T3, T8], potentially triggering coordinated exits by momentum and ETF money before official buyers re-engage. Named negatives from Lombard Odier are higher-for-longer real yields, a prolonged decline in ETF demand, and weaker physical demand such as jewellery, even if partly offset by central bank buying [T8].
Structural risks follow. Official-sector buying may slow: ING explicitly notes central bank purchases could decelerate [T2], and Saxo raises the demand-sustainability question, since rising prices inflate the value of existing reserves and could moderate further accumulation [T3]. A stronger dollar or meaningful geopolitical de-escalation, particularly between the US and China, would strip out part of the embedded risk premium [T3]. A sharp monetary-policy reversal driving real yields rapidly higher is SocGen’s own identified caution [T4].
EUR-specific risks are distinct. Rising euro nominal yields, the 2Y up 112.1bp YTD, raise the euro opportunity cost of holding gold regardless of USD dynamics, and we cannot compute euro real yields precisely without an inflation expectations series. Conversely, EUR/USD appreciation well above 1.1400 would mechanically depress EUR-denominated gold returns even if USD gold held steady, a two-way FX translation risk. Finally, the market remains vulnerable to profit-taking after the January peak [T2], and the modest USD-quoted year-to-date gain of roughly 6% cited by ING leaves limited momentum cushion.
Appendix
Full multi-horizon return table (XAU/EUR)
| Horizon | Return |
|---|---|
| 1h | -0.00% |
| 24h | -1.74% |
| 7d | -3.55% |
| 14d | -3.09% |
| 30d | -5.78% |
| 200d | -18.42% |
| 1y | +11.15% |
Euro area AAA yield curve
| Tenor | Yield | 1m change | YTD change |
|---|---|---|---|
| 2Y | 3.23% | +47.9bp | +112.1bp |
| 5Y | 3.34% | +45.1bp | +90.3bp |
| 10Y | 3.57% | +32.1bp | +61.8bp |
| 30Y | 3.74% | +4.5bp | +26.6bp |
The curve is bear-flattening at the front end: the 2Y rose 112.1bp YTD against 61.8bp for the 10Y, a hawkish repricing signature. The 10Y-2Y spread stands at 33.7bp.
FX crosses
| Cross | Level | 5d | 1m | YTD |
|---|---|---|---|---|
| EUR/USD | 1.1400 | +0.04% | -2.12% | -2.98% |
| EUR/CHF | 0.9441 | +0.43% | +0.68% | +1.49% |
| EUR/JPY | 180.24 | -0.11% | -3.03% | -1.92% |
| EUR/GBP | 0.8599 | +0.08% | +0.32% | -1.34% |
Equity snapshot
| Index | Level | 5d | YTD |
|---|---|---|---|
| DAX | 25,408.6 | -0.65% | +3.7% |
| ATX | 6,943.7 | +0.62% | +30.6% |
| Euro Stoxx 50 | 6,330.0 | -0.12% | +9.2% |
| S&P 500 | 7,743.4 | -0.27% | +13.1% |
| Nasdaq Composite | 27,068.7 | -0.20% | +16.5% |
| Nikkei 225 | 66,228.1 | +3.26% | +31.6% |
| Hang Seng | 24,645.0 | -1.76% | -3.8% |
Tokenized gold wrapper statistics
Market cap EUR 1.60bn, 24h volume EUR 92.6m, circulating and total supply 434,898.6 units, market cap rank 58, fully diluted valuation EUR 1.60bn, no maximum supply. These figures describe the tokenized wrapper only and are not estimates of the global gold market.
Data notes
Market data retrieved 2026-09-28 04:22 UTC; equity and FX series as of 2026-09-25 to 2026-09-28, euro-area yields as of 2026-09-24. Bitcoin and Ethereum per-asset return data are unavailable in this dataset. Central bank purchase volumes in tonnes are unavailable; the reserve-flow thesis rests on qualitative sourcing. Euro-area inflation expectations are unavailable, so euro real yields are approximated by nominal yield drift. Scenario probabilities are judgemental. Some news items carry no publication timestamps and may predate the report date; claims are framed with their context accordingly.
Sources
- [T1] It’s time to get bullish on gold again, says SocGen | Kitco News
- [T2] Geopolitics alone isn’t enough to lift gold | ING THINK
- [T3] Gold in review from pure macro trade to cornerstone asset | Saxo
- [T4] Gold’s Dual Drivers: Central Bank Flows and Real Yields, According to Societe Generale | CryptoRank.io
- [T5] Report: Central Banks Now Hold More Gold Than Treasuries | CEOWORLD magazine
- [T6] Is it a golden era for gold? | J.P. Morgan Private Bank
- [T8] Gold’s slowdown doesn’t signal a reversal | Lombard Odier
Disclaimer
This report is AI-generated and is provided for informational purposes only. It does not constitute investment advice, a recommendation, or an offer to buy or sell any financial instrument. Figures may contain errors or reflect stale data. Readers should conduct their own analysis and consult licensed advisors before making investment decisions.
Important Note / Wichtiger Hinweis:
EN: This report may have been generated using AI. It processes data from publicly available sources. The content is provided for informational purposes only.DE: Dieser Bericht kann mithilfe von KI erstellt worden sein. Dabei werden Daten aus öffentlich zugänglichen Quellen verarbeitet. Die Inhalte dienen ausschließlich Informationszwecken.
* DE: Die ergänzenden Inhalte können KI-generiert sein. EN: The additional content may be AI-generated.