
Listen to the summary
Key Data Snapshot
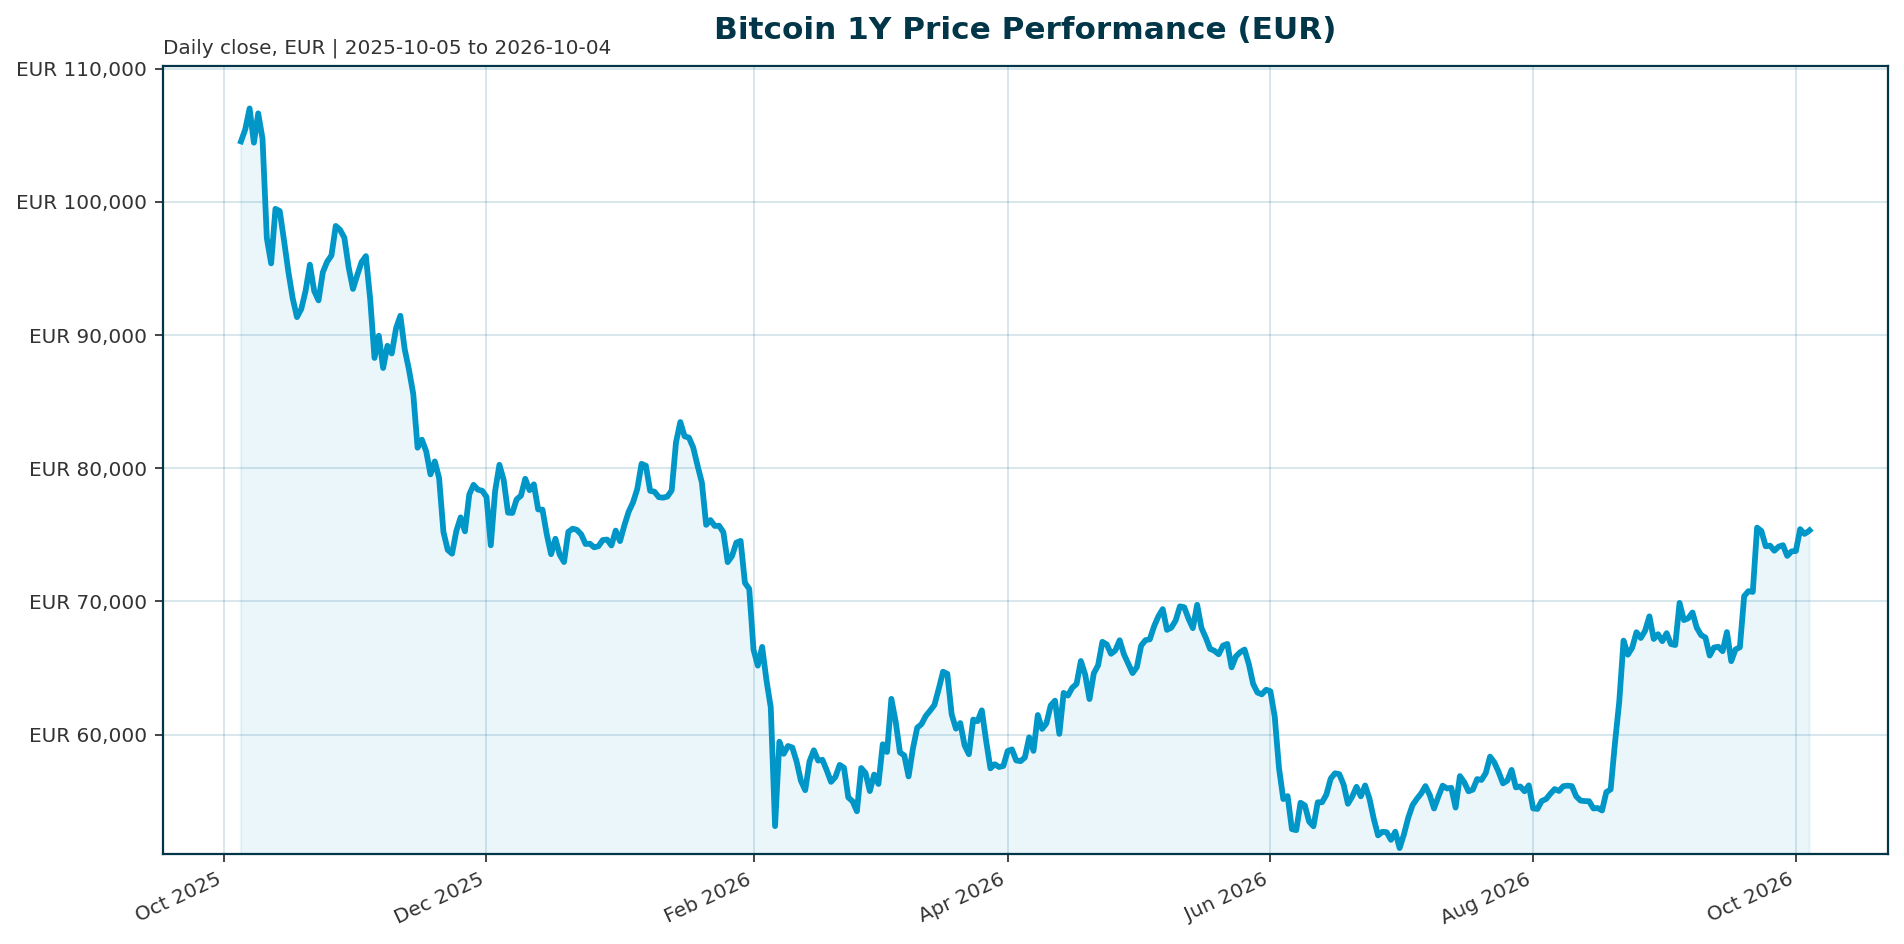
As of 4 October 2026 (retrieved 04:15 UTC), Bitcoin trades at €75,331 with a market capitalization of €1,513.7 billion, market-cap rank 1, and dominance of 58.58% of the €2,579.5 billion total crypto market. Data: CoinGecko market feed, EUR-quoted.
| Metric | Value |
|---|---|
| Price (EUR) | €75,331 |
| 24h Range | €75,102 to €75,521 (€419 range, 0.56% of price) |
| Market Capitalization | €1,513.71 bn (rank 1) |
| Fully Diluted Valuation | €1,513.71 bn (0.0003% premium to market cap) |
| 24h Volume | €12.96 bn (0.86% of market cap) |
| BTC Dominance | 58.58% |
| Total Crypto Market Cap / Volume | €2,579.50 bn / €39.68 bn (BTC share: 32.67%) |
| Circulating / Max Supply | 20,093,006 / 21,000,000 BTC (95.68% issued) |
| ATH / Drawdown | €107,662 (6 Oct 2025); currently 30.03% below |
| Performance 1h / 24h / 7d | +0.05% / +0.19% / +0.47% |
| Performance 14d / 30d / 200d / 1y | +5.67% / +4.97% / +14.09% / -30.43% |
Key calculations. Market-cap check: 20,093,006 BTC times €75,331 equals €1,513.7 bn, reconciling with the reported figure. Required recovery to ATH: €107,662 / €75,331 minus 1 equals +42.92%. Remaining issuance: 906,994 BTC, or 4.32% of max supply. Volume-to-market-cap: €12.965 bn / €1,513.7 bn = 0.86%.
Market Setup
The cross-asset backdrop is neutral rather than supportive. Risk sentiment reads neutral, equity momentum is mixed, and DACH indicators average -2.38% over five days versus +0.85% for global peers, with the ATX the weakest performer at -4.19% and the Nikkei 225 the strongest at +3.69%. Euro rates show mixed curve steepening: the AAA 10Y yield sits at 3.59% (-2.3 bp over five days), the 2Y at 3.11% (-14.5 bp), and the 10Y-2Y spread at 48.6 bp, while the 30Y is higher at 3.84%. FX is mixed, with EUR/USD at 1.1290 (-0.55% over five days). This context is subordinate to the Bitcoin-specific picture: sources describe BTC as trading both like a crypto asset and a macro-liquidity asset [T7], with the macro backdrop flagged as the primary variable and the Fed expected to hold rates through Q3 under Chair Warsh, limiting the policy easing that has historically supported risk-asset recoveries [T2]. Higher yields raise the opportunity cost of holding a volatile, non-yielding asset [T4], making the neutral macro setting a genuine constraint on the bullish case rather than a tailwind.
Investment Thesis
The institutional case for Bitcoin rests on three pillars. First, scarcity: the hard cap of 21 million coins [T6] with 95.68% already circulating means new issuance adds only 4.32% of max supply over the long tail, so price is set almost entirely by the marginal bid. Second, dominance and allocability: at 58.58% market dominance, BTC is the core digital-asset line item, and spot ETFs, corporate treasuries, and regulated vehicles have made it an allocatable position for registered investment advisers, private banks, and institutions [T1]. By end-2025, Glassnode counted 6.7 million BTC across ETFs, exchanges, and treasuries, a regime the firm labels the institutional supply era [T1]. Third, the transmission channel: ETF flows have effectively become Bitcoin’s new macro indicator [T1] and the most tangible leading indicator of institutional rotation back into digital assets [T2].
The bearish counterweight is that the same channel cuts both ways. Record outflows from US-listed BTC and ETH ETFs in Q4 2025 coincided with Bitcoin breaking support around $98,000 and retesting the low $90,000s [T1], and institutional participation can amplify volatility as easily as it supports rallies [T8]. The thesis is therefore conditional: BTC is a scarce, institutionalized, high-beta macro asset whose medium-term direction depends on the direction of regulated capital flows, not on scarcity alone.
Bullish Drivers
- ETF demand episodes remain large. Sources cite approximately $467 million of net inflows on May 5 alone, the fourth consecutive positive day [T5], and $1.92 billion in a single week in August 2026, with BlackRock’s IBIT taking a significant share [T6]. Investors appeared to be positioning ahead of upside rather than reacting to it [T6].
- Physical backing creates structural demand. ETF issuers must acquire physical Bitcoin to back newly created shares, making ETF demand a genuine source of spot buying rather than paper exposure [T8].
- Regulatory catalysts are pending. The CLARITY Act would establish a federal market-structure framework and could unlock broader institutional participation if passed [T2]. It is a potential catalyst, not a completed event.
- Adoption keeps broadening. Large asset managers, wealth managers, pension funds, and corporate treasuries remain active in the ETF market despite turbulence [T8].
- Supply held firm in the last drawdown. During the May 2026 correction, major institutional holders did not capitulate en masse and whale addresses increased positions during the dip, echoing the March 2026 correction that preceded a strong Q2 rally [T3].
- Volatility is structurally lower. Reported volatility fell from 84% to 43%, consistent with a maturing institutional asset [T1], which improves suitability for sized allocations.
Relative Positioning vs Gold and Ethereum
Quantitative comparison is limited: the bundle contains no current gold price, gold performance, Ethereum price, ETH performance, ETH market cap, or ETH/BTC ratio. Explicitly, these data are unavailable, so positioning is qualitative.
Versus gold. Both assets share a non-yielding, scarcity-based profile. BTC’s fixed 21 million cap is harder than gold’s elastic supply response, but gold proved the stronger defensive asset: during the Q4 2025 correction Bitcoin lagged traditional assets like gold and bonds while more than $1 trillion in crypto market value was erased and BTC fell nearly 30% from peak [T1]. Bitcoin remains the high-beta version of the scarce-store-of-value trade, not a proven substitute. Falling reported volatility (84% to 43%) narrows, but does not close, the gap [T1].
Versus Ethereum. BTC’s 58.58% dominance and rank-1 status position it as the primary monetary digital asset and the default institutional allocation. The relevant ETH comparison in current sources is flow-based: Q4 2025 saw record outflows from both BTC and ETH ETFs [T1], and in Asia, pure bitcoin ETF plays a smaller strategic role than in North America and Europe, where tokenization and stablecoin regulation dominate institutional entry points [T2]. ETH-specific valuation data are unavailable.
Scenario Framework
Anchors: spot €75,331, ATH €107,662 (+42.92% required), 200d momentum +14.09%, 1y return -30.43%. Levels below are scenario illustrations derived from the anchors, not forecasts.
| Scenario | Conditions | Illustrative EUR Path |
|---|---|---|
| Base | Neutral risk sentiment, mixed euro rates, ETF flows alternating between inflow and outflow weeks. BTC consolidates as an institutionalized, macro-liquid high-beta asset. | Range roughly €70,000 to €85,000, consistent with the 14d to 200d momentum band; ATH recovery deferred. |
| Bull | Sustained ETF inflows (August-type $1.92 bn weeks [T6]), CLARITY Act passage [T2], easing liquidity stress. Scarcity amplifies net demand against only 4.32% remaining issuance. | Progress toward the $85,000 to $90,000 resistance zone cited in USD terms [T5] (indicatively €75,000 to €80,000 at EUR/USD 1.129) and, if flows persist, a retest of the €107,662 ATH requiring +42.92%. |
| Bear | Outflows resume ($1 bn weekly outflows occurred through May 17 [T3]), yields rise, risk-off rotation deepens. ETF weakness removes the clearest source of marginal demand [T4]. | Revisit of lower valuation zones; the $70,000 test flagged in sources [T7] (indicatively €62,000) becomes the watch level if the current base fails. |
| Stress | Institutional flows amplify downside rather than dampen it, as in Q4 2025 when over $1 trillion in market value was erased and BTC fell nearly 30% from peak [T1]. | Drawdowns of 30% or more from local peaks are precedented within the last twelve months. |
USD levels from sources are converted at the provided EUR/USD 1.1290 and are indicative only.
Valuation Discussion
Bitcoin has no cash flows, so valuation anchors are market-cap, dominance, supply saturation, and the ATH gap. Market capitalization of €1,513.71 bn sits within 0.0003% of fully diluted valuation, meaning nearly all relevant supply is already priced; there is no dilution overhang to discount. Dominance of 58.58% (cross-check: €1,513.7 bn / €2,579.5 bn = 58.68%, a negligible rounding difference) confirms BTC remains the pricing benchmark for the asset class.
The recovery math is the key valuation lens: at €75,331, BTC needs +42.92% to regain the €107,662 ATH, against only +14.09% earned over 200 days. That gap is the market’s explicit pricing of macro headwind and flow uncertainty. On the bullish side, each sustained ETF inflow phase converts regulated demand into physical spot buying against a nearly fixed float, historically supporting multiple expansion through market-cap growth [T6][T8]. On the bearish side, if yields stay attractive relative to a non-yielding asset [T4] and ETF demand fades, scarcity alone has not prevented a 30.03% drawdown from ATH and a -30.43% one-year return. Liquidity is adequate but not deep by institutional standards: 24h turnover of €12.96 bn equals 0.86% of market cap, and BTC’s 32.67% share of total crypto volume confirms it is the liquidity venue of the asset class.
Risks
- Flow risk, two-sided. ETF flows are the dominant driver and a volatility amplifier in both directions [T8]. Weekly outflows reached roughly $1 billion through May 17 during the 2026 risk-off rotation [T3], and Q4 2025 saw record BTC and ETH ETF outflows coinciding with support breaks [T1].
- Rates and liquidity risk. Rising yields raise the opportunity cost of holding BTC and made institutional buyers more selective [T4]; with the Fed expected to hold through Q3, the easing tailwind is absent [T2].
- Drawdown risk. A -30.43% one-year return and a 30.03% gap to ATH, plus a Q4 2025 episode erasing over $1 trillion in market value [T1], demonstrate that institutionalization has not removed 30% drawdowns.
- Regulatory risk. The CLARITY Act is pending, not passed; failure or delay removes a cited catalyst [T2].
- Treasury-concentration risk. Strategy (formerly MicroStrategy) has temporarily slowed purchases amid weaker financing conditions and falling ETF demand [T8]; a leveraged treasury seller would add downside pressure.
- Data gaps. No derivatives positioning, exchange reserves, continuous ETF flow series, realized volatility, or on-chain valuation metrics are in the bundle; short-term technical targets should not be stated with false precision.
Appendix
Methodology. All prices, market caps, volumes, supply figures, and performance percentages are EUR-quoted CoinGecko data retrieved 2026-10-04T04:15:07Z; market-overview data as of 2026-10-02 (equities) and 2026-10-01 (ECB yields), FX as of 2026-10-04. Calculations shown: market-cap check (20,093,006 x €75,331 = €1,513.7 bn), volume/market cap (0.86%), dominance cross-check (58.68% vs reported 58.58%), circulating share of max supply (95.68%), FDV premium (0.0003%), ATH recovery requirement (+42.92%), intraday range (0.56%), and BTC volume share (32.67%). USD levels from sources are converted at EUR/USD 1.1290 and labeled indicative. Benchmark assets per bundle are gold and Ethereum; no comparable benchmark dataset was provided, so relative positioning is qualitative.
Data limitations. No continuous ETF flow time series, derivatives data, funding rates, open interest, realized volatility, exchange reserves, or on-chain valuation metrics were available. Some cited sources carry null publication dates and generic titles, which limits citation precision for time-sensitive claims. Scenario EUR levels are illustrations anchored to provided data, not forecasts.
Sources
- [T1] Crypto Market 2025: Year-End Review & Expert Insights. tradingview.com
- [T2] Q2 2026 Digital Asset Review. coindesk.com
- [T3] Bitcoin Price Crash May 2026. intellectia.ai
- [T4] US Treasury yields surge to new highs as liquidity tightens, pushing Bitcoin back below $82,000 resistance. cryptoslate.com
- [T5] Bitcoin Price Analysis May 2026. intellectia.ai
- [T6] Bitcoin ETF Inflows Surge to $1.92 Billion Last Week. cryptonomist.ch
- [T7] Bitcoin Tests $70,000 As Intraday Squeeze Lifts Market. cryptorank.io
- [T8] Bitcoin Outlook: ETF Outflows, Institutional Adoption & Price Forecast 2026. ig.com
Disclaimer. This report is AI-generated and provided for informational purposes only. It does not constitute investment advice, an offer, or a recommendation to buy or sell any asset. Figures may be incomplete or outdated, and readers should conduct their own due diligence and consult licensed advisers before making investment decisions.
Important Note / Wichtiger Hinweis:
EN: This report may have been generated using AI. It processes data from publicly available sources. The content is provided for informational purposes only.DE: Dieser Bericht kann mithilfe von KI erstellt worden sein. Dabei werden Daten aus öffentlich zugänglichen Quellen verarbeitet. Die Inhalte dienen ausschließlich Informationszwecken.
* DE: Die ergänzenden Inhalte können KI-generiert sein. EN: The additional content may be AI-generated.