
Watch the video
This player shows only the Bitcoin chapter of the daily altii market briefing. Watch the full video on tube.altii.de.
Key Data Snapshot
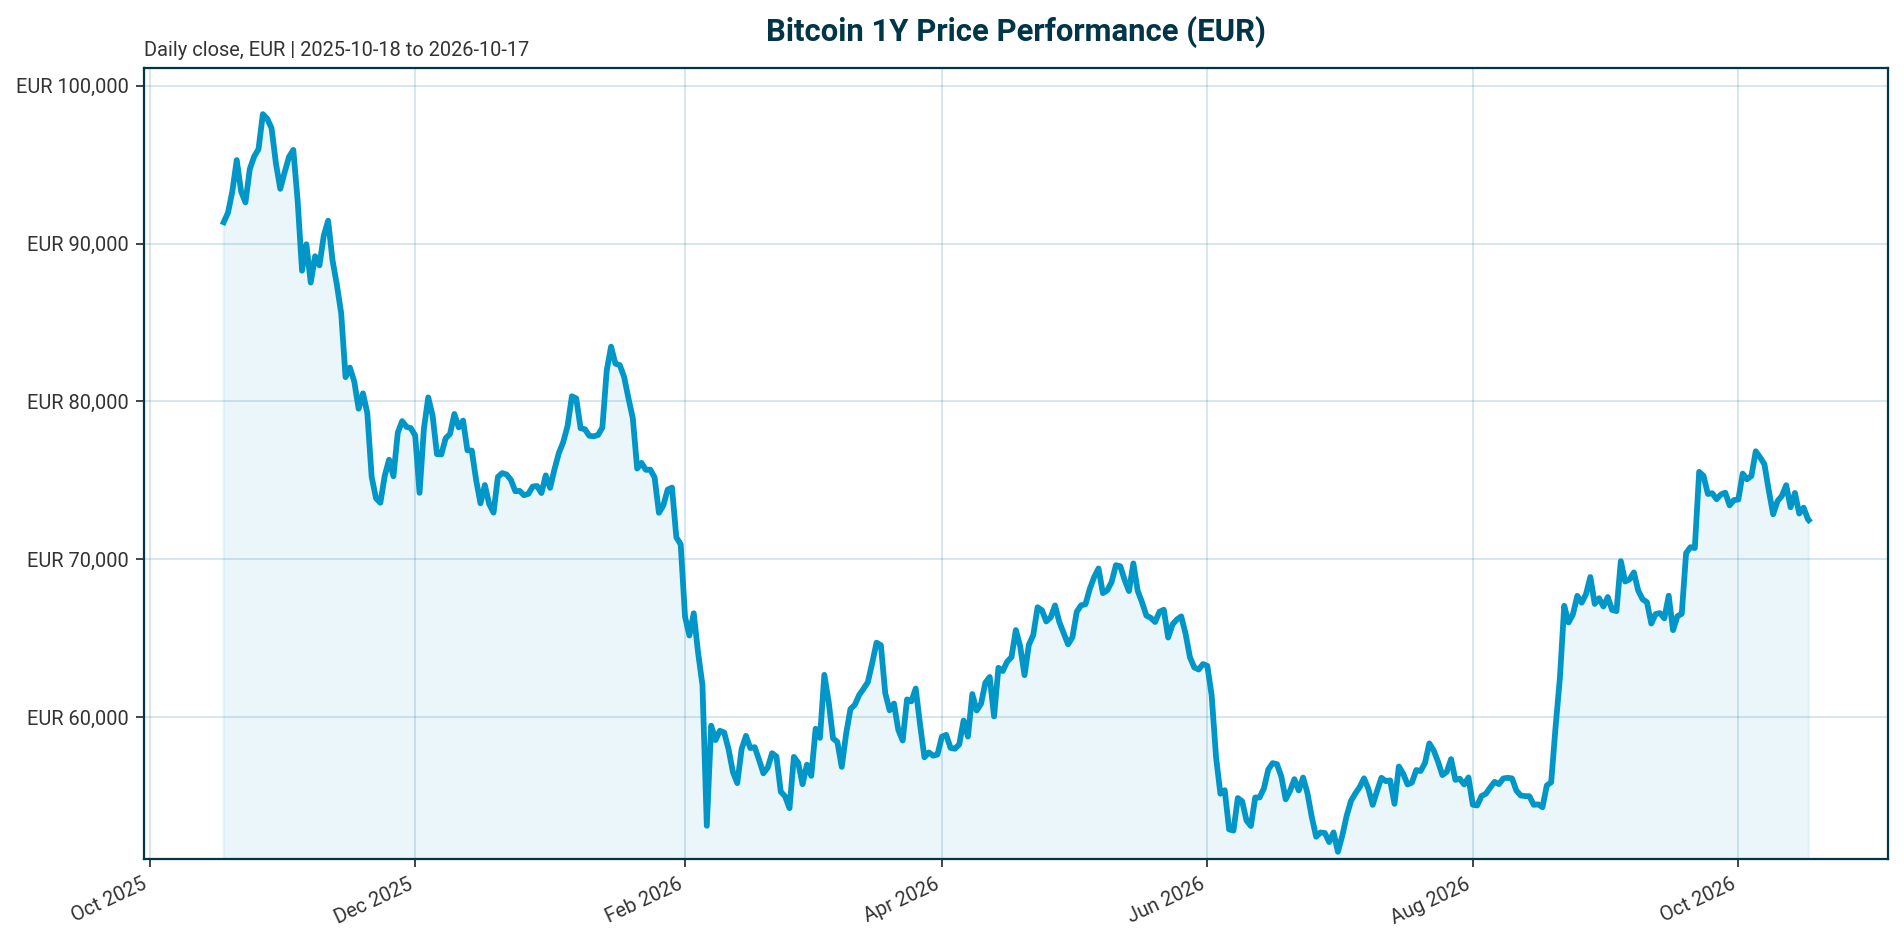
Bitcoin trades at €72,501, reflecting a consolidation phase following a 32.7% drawdown from the October 2025 all-time high of €107,662. The asset shows resilience over the last 30 days with a +6.79% gain, contrasting with a -25.23% decline over the past year. Institutional entities now hold approximately 18.5% of the total supply, a structural shift driven by spot ETFs.
| Metric | Value | Change (24h) |
|---|---|---|
| Price (EUR) | 72,501.00 | -0.70% |
| Market Cap (EUR) | 1.46 T | -0.57% |
| 24h Volume (EUR) | 23.45 B | N/A |
| 24h High / Low (EUR) | 73,687.00 / 71,859.00 | N/A |
| 200-Day Change | +20.20% | N/A |
| BTC Dominance | 59.30% | N/A |
Calculation: Upside to ATH = (107,662 – 72,501) / 72,501 = 32.66%.
Market Setup
Risk Sentiment: Neutral to negative. Global equity markets show mixed signals, with the DAX outperforming peers while the Nikkei 225 struggles. DACH equity indicators average +0.29% over 5 days versus -2.92% for global indicators.
Rates & FX Backdrop: The Euro area yield curve is flattening, with the AAA 10Y yield at 3.39% and the 2Y yield at 2.99%. The EUR/USD pair sits at 1.1227. These conditions suggest a cautious macro environment where liquidity is not aggressively expanding, potentially constraining risk asset performance.
Key Observations: Institutional capital is becoming the primary liquidity driver for Bitcoin, replacing retail-driven volatility. ETF flows are volatile, with recent reports noting both significant outflows and consecutive days of inflows, indicating active capital rotation.
Investment Thesis
The investment thesis for Bitcoin rests on its transition from a speculative retail asset to a legitimate institutional-grade store of value. The approval of spot Bitcoin ETFs has fundamentally altered market structure by providing regulated access to capital. BlackRock’s iShares Bitcoin Trust (IBIT) reached $10 billion in assets in just 49 trading days, signaling rapid institutional validation [T1].
This shift implies a decoupling from the traditional four-year supply shock cycle. While the halving event remains a fundamental supply constraint, institutional accumulation now rivals its impact on price discovery. The asset is increasingly viewed as a hedge against monetary debasement, supported by a fixed supply cap of 21 million coins.
Bullish Drivers
- Institutional ETF Flows: Spot Bitcoin ETFs provide a regulated, liquid entry point for traditional capital. While flows fluctuate, the infrastructure for continuous institutional participation is established [T5]. Recent reports indicate sustained net inflows into Bitcoin and Ethereum ETFs, supporting price floors [T8].
- Structural Scarcity: With 95.7% of the total supply already circulating and a hard cap of 21 million, the remaining float is finite. Large holders, including ETFs and corporations, hold approximately 18.5% of the supply, reducing available float for retail traders [T1][T4].
- Macro Divergence: A potential easing of inflation concerns and lower oil prices could improve global risk sentiment, providing the liquidity necessary for Bitcoin to reclaim higher price levels [T2].
- Technological Maturity: The maturation of the Bitcoin network and the expansion of corporate treasuries holding BTC strengthen the long-term value proposition [T3].
Relative Positioning vs Gold and Ethereum
Bitcoin maintains its position as the dominant asset within the cryptocurrency ecosystem, commanding 59.3% of the total crypto market cap. This dominance suggests investors view BTC as the primary ‘digital gold’ within the digital asset space.
Capital rotation is evident between Bitcoin and Ethereum. While Bitcoin attracts long-term institutional capital seeking store-of-value characteristics, Ethereum ETFs are also seeing positive flows, indicating investors are balancing ‘digital gold’ with ‘smart money/utility’ exposure [T8]. In a risk-on environment, Bitcoin may outperform Gold if institutional capital seeks higher beta, whereas Gold typically acts as a safer haven during global risk-off events.
Scenario Framework
- Bullish Scenario (New ATH Potential): Sustained net inflows into spot ETFs combined with a stabilization of macroeconomic indicators could trigger a breakout above the October 2025 ATH of €107,662. Long-term models suggest a bullish recovery could target $100,000–$150,000 if liquidity conditions improve [T3].
- Base Case (Consolidation): Bitcoin consolidates between the 24h high (€73,687) and low (€71,859). ETF flows stabilize, and the asset trades in a range as the market digests recent volatility and institutional positioning.
- Bearish Scenario (Market Correction): A continuation of ETF outflows—such as the reported $65.4 million outflows from BlackRock’s IBIT—and a global equity sell-off (e.g., a Nikkei 225 style decline) could drive Bitcoin below the €70,000 support level, testing the 200-day moving average.
Valuation Discussion
Bitcoin is currently trading at a discount to its Fully Diluted Valuation (FDV) of €1.46 trillion, as the market has not yet fully priced in the remaining 4.3% of uncirculated supply. However, the current price action suggests a re-evaluation of the asset’s utility in a high-interest-rate environment.
With 95.7% of the total supply already in circulation, the remaining supply represents a future supply shock. Valuation models must account for the increasing cost of capital. If institutional adoption continues to expand, the FDV could be revisited as the market recognizes Bitcoin’s role as a non-correlated asset class.
Risks
- ETF Flow Reversals: Bitcoin ETFs are prone to net outflows, as seen recently with BlackRock’s IBIT. A sustained withdrawal of capital could pressure spot prices significantly [T6].
- Regulatory Uncertainty: Changes in tax treatment or regulatory frameworks could impact the attractiveness of ETF structures. Futures-based ETFs also carry risks of tracking errors due to contango or backwardation [T5].
- Macro Volatility: A resurgence in inflation or interest rate hikes could force a repricing of risk assets. The flattening Euro yield curve suggests limited room for further easing, which could constrain liquidity flows into crypto [T2][T6].
- Market Structure Concentration: The market is increasingly influenced by a small number of large ETF providers. Concentration risk in these entities could impact market stability if they face operational or regulatory challenges.
Appendix
Sources
- The End of Bitcoin’s Four-Year Cycle? How ETFs and Institutions Are Reshaping the Market – Wolf & Company [T1]
- Bitcoin is back above $85,000 as momentum returns to crypto markets – CFI Group [T2]
- Bitcoin Price Prediction October 2026 – Bitcoin Foundation [T3]
- BTC Price Action, ETF Flows, Rate Path | BMTV Sep. 22, 2026 [T4]
- Bitcoin ETFs Explained – AvaTrade [T5]
- Bitcoin’s Recovery and ETF Outflows Raise Questions About Institutional Crypto Adoption – InvestorIdeas [T6]
- Institutional Adoption and ETF Impact | AI TradeLogic [T7]
- Institutional money flows into Bitcoin and Ethereum ETFs [T8]
Disclaimer: This report is AI-generated for informational purposes only and does not constitute investment advice. All data is provided as of the date of publication and may become stale or inaccurate.
Important Note / Wichtiger Hinweis:
EN: This report may have been generated using AI. It processes data from publicly available sources. The content is provided for informational purposes only.DE: Dieser Bericht kann mithilfe von KI erstellt worden sein. Dabei werden Daten aus öffentlich zugänglichen Quellen verarbeitet. Die Inhalte dienen ausschließlich Informationszwecken.
* DE: Die ergänzenden Inhalte können KI-generiert sein. EN: The additional content may be AI-generated.