
Watch the video
This player shows only the Gold chapter of the daily altii market briefing. Watch the full video on tube.altii.de.
Key Data Snapshot
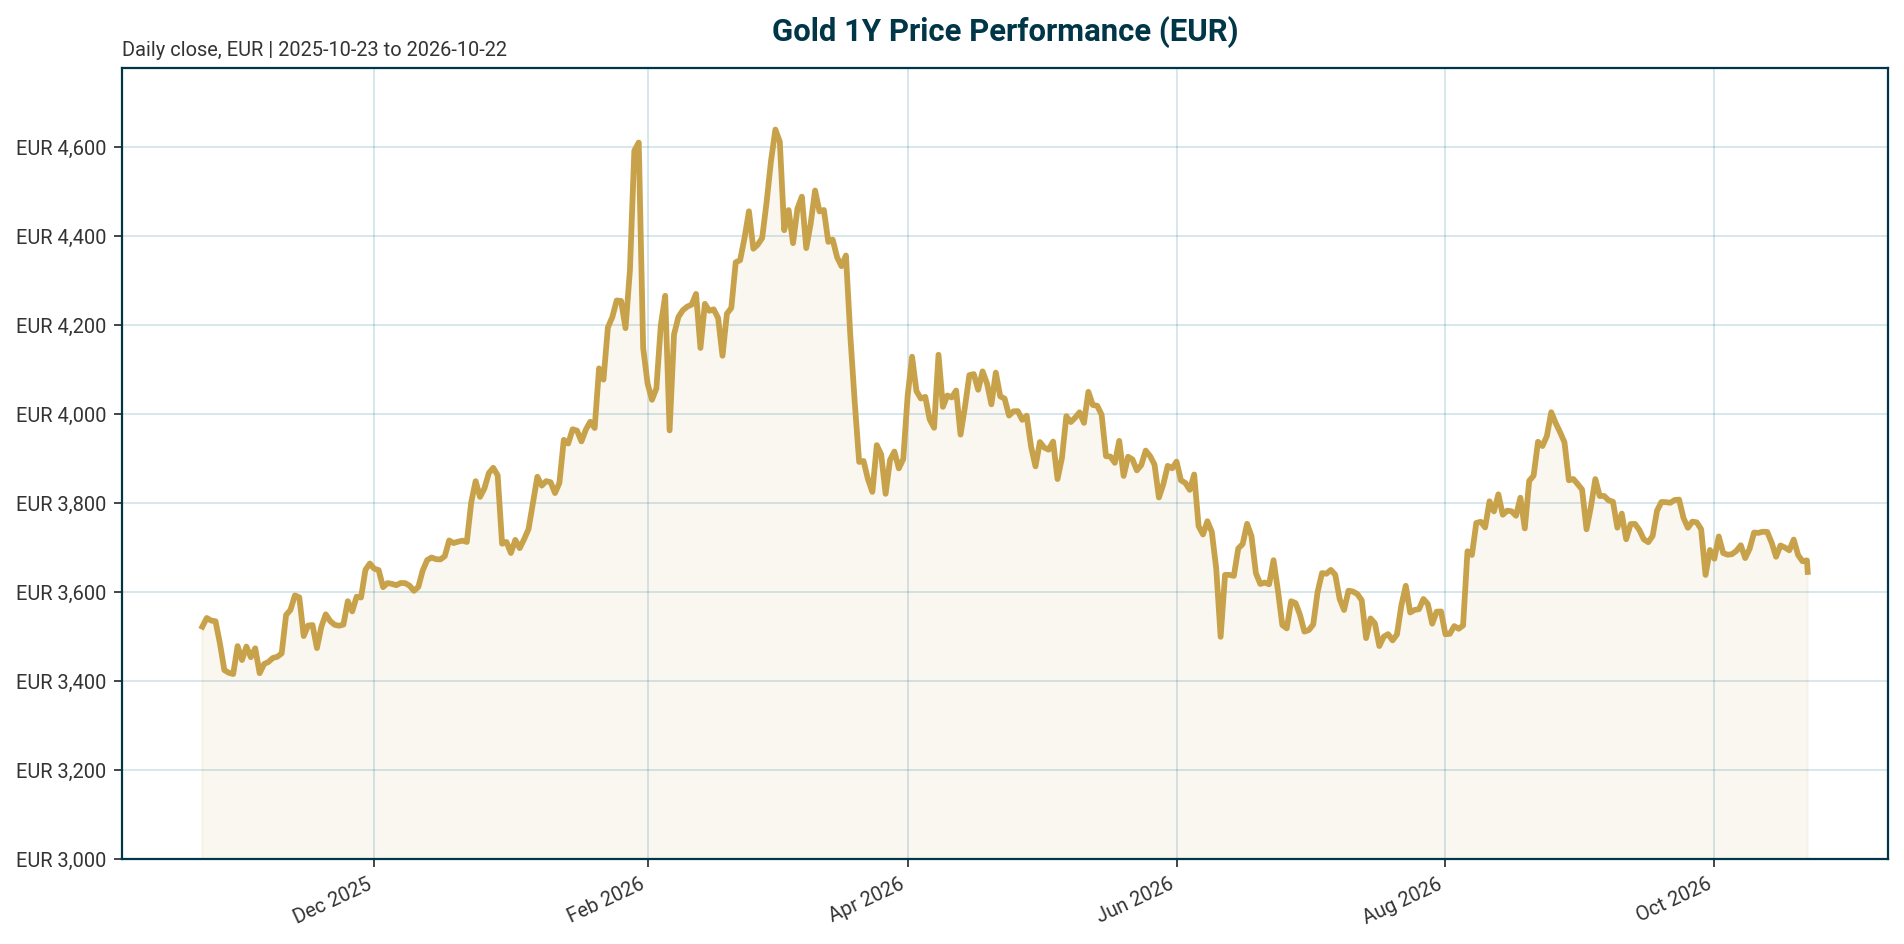
| Metric | Latest | Interpretation |
|---|---|---|
| XAU/EUR price | €3,641.93 | Corrective near-term tape |
| Performance | 1h: -0.53%; 24h: -0.94%; 7d: -1.51%; 30d: -5.63%; 200d: -11.91%; 1y: -0.55% | Momentum is negative across short and medium horizons |
| 24h range | High: €3,685.02; Low: €3,642.68; Range: €42.34 | Range / price = €42.34 / €3,641.93 = 1.16%. Current print is €0.75 below the stated 24h low, likely due to retrieval timing |
| Distance from ATH | ATH: €4,688.32 on 2026-01-28; drawdown: -22.32% | Calculation: (€3,641.93 / €4,688.32 – 1) x 100 = -22.32% |
| Distance from ATL | ATL: €1,265.28 on 2019-11-17; gain: +187.84% | Calculation: (€3,641.93 / €1,265.28 – 1) x 100 = +187.84% |
| Tracked instrument market cap and volume | Market cap: €1.61bn; 24h volume: €101.80mn; rank: 56 | Volume / market cap = €101.80mn / €1.61bn = 6.33%. This reflects the supplied tracked gold-linked instrument feed, not total above-ground gold |
| Euro rates | AAA 2Y: 3.0281%; AAA 10Y: 3.4401%; 10Y-2Y: 41.2 bp | 10Y yield fell 7.07 bp over five days, tactically supportive if real-rate pressure is easing |
| EUR/USD | 1.1230; 5d: -0.08%; 1m: -2.16%; YTD: -4.43% | EUR weakness can cushion EUR gold if global gold is priced in USD |
| Unavailable metrics | Real yields, inflation breakevens, ETF flows, physical premia, USD gold spot, Bitcoin price, Ethereum price | Not provided in the bundle |
Macro Backdrop
The cross-asset backdrop is neutral to negative and should be treated as context rather than the main driver of the gold view. Equity momentum is moderately negative, DACH markets are outperforming, and DACH indicators averaged +0.96% over five days versus -1.86% for global equity indicators. Euro yields are mixed, with the euro area AAA 10Y yield at 3.44%, down 7.1 bp over five days. FX is mixed: EUR/USD is 1.1230 and almost flat over five days at -0.08%.
For gold, the key macro variable remains the real yield complex. Gold does not pay interest, so real yields represent the opportunity cost of holding it. J.P. Morgan notes that gold has historically moved inversely to real yields, although this relationship has broken down in some periods, including after 2022 when real yields rose sharply and gold stayed resilient [T3]. Lombard Odier similarly frames falling real yields as supportive because they reduce gold’s opportunity cost, while identifying higher-for-longer real yields, weaker ETF demand and lower physical demand as risks [T6].
The current EUR setup is therefore mixed. Lower euro yields over five days help the tactical case. Negative 30-day and 200-day price action argues for caution. The structural macro debate is whether gold is still mainly a real-rate asset or whether fiscal sustainability, inflation credibility and reserve-regime fragmentation now anchor demand more forcefully. Some institutions argue that gold’s negative correlation with bond yields is weakening, with gold resilient even as US Treasury yields moved above 5% [T1].
Investment Thesis
Gold in EUR is tactically under pressure but structurally supported. The bearish side is visible in the data: XAU/EUR is down 5.63% over 30 days, 11.91% over 200 days and 22.32% below its January 2026 high. This is not a clean momentum long.
The bullish side rests on the reserve-demand regime. World Gold Council survey data show central banks accumulated an average of 1,000 tonnes of gold over the past four years, double the 500-tonne average over the preceding decade [T7]. The same survey reports that 89% of respondents expect global central bank gold reserves to increase over the next 12 months, while a record 45% expect their own institution’s gold reserves to rise and only 1% expect a decline [T7].
The central case is consolidation with a constructive medium-term bias. Higher real yields and a stronger dollar can keep gold capped. However, official-sector demand, geopolitical hedging, inflation uncertainty and reserve diversification provide a structural bid. OMFIF argues that gold is increasingly valuable to central banks because it is not tied to a single sovereign entity and serves as a hedge against volatility and geopolitical risk [T5]. J.P. Morgan also notes that some countries seek to reduce dollar reserve exposure to lower sanctions vulnerability [T3].
Bullish Drivers
- Official-sector accumulation: Central banks bought an average of 1,000 tonnes per year over the past four years, compared with 500 tonnes over the prior decade [T7]. This is the strongest structural support in the current thesis.
- Positive reserve intentions: 89% of WGC survey respondents expect global central bank gold reserves to rise over the next 12 months; 45% expect their own reserves to rise; only 1% expect a decline [T7].
- Broad survey signal: The WGC survey drew 76 responses, the highest participation since the survey began nine years ago [T2]. That improves the relevance of the reserve-manager signal.
- Crisis performance: 90% of respondents cited gold’s historical performance during crises as highly relevant, while 95% of EMDE institutions viewed geopolitical instability as a key allocation driver versus 67% of advanced-economy institutions [T2].
- Reserve diversification: Gold supports central banks seeking a reserve asset without direct sovereign credit risk or single-currency dependence [T5]. This matters more in a fragmented sanctions and payments environment.
- Inflation and credibility hedge: Interest-rate levels were relevant to 92% of survey participants, alongside inflation concerns and geopolitical instability [T2].
- Vaulting and deployability: The Dutch central bank reportedly moved about 86 tonnes of gold from the United States and Canada to London between March and August 2026 as part of crisis preparedness, highlighting the operational value of physical access [T1].
The bullish case is not a claim of one-way upside. It is a claim that demand quality has improved. A market supported by central banks, fiscal hedgers and crisis allocators can remain resilient even when cyclical investors reduce exposure.
Relative Positioning vs Bitcoin and Ethereum
Gold, Bitcoin and Ethereum can all appear in debasement or non-fiat allocation frameworks, but their institutional use cases differ materially.
| Asset | Current data in bundle | Institutional positioning implication |
|---|---|---|
| Gold / XAU | €3,641.93; 30d: -5.63%; 200d: -11.91%; tracked volume / market cap: 6.33% | Official-sector reserve asset with crisis, inflation and geopolitical hedging demand |
| Bitcoin | BTC dominance: 59.53%; total crypto market cap: €2.484tn equivalent as supplied; total crypto 24h volume: €77.84bn equivalent as supplied | High-liquidity crypto benchmark, but no Bitcoin spot price, return or volatility data are provided |
| Ethereum | Unavailable: spot price, market cap, volume, return and volatility metrics are not provided | Cannot make a quantitative relative valuation claim from this bundle |
Total crypto volume / total crypto market cap = 77.84bn / 2,484.40bn = 3.13%, compared with 6.33% for the supplied gold-linked instrument. This comparison is indicative only because the gold figure refers to a tracked instrument, while the crypto figure refers to the broader crypto market.
Gold’s relative advantage is official-sector legitimacy. A provided source argues that gold is becoming more important in global central bank reserves and links central bank purchases to diversification, reduced dollar dependence, inflation hedging and absence of counterparty risk [T8]. Bitcoin may compete as a scarce digital asset, and Ethereum may compete as a programmable settlement asset, but the bundle does not provide enough data to compare performance, volatility or drawdowns. On the supplied evidence, gold has the clearer reserve-management bid.
Scenario Framework
| Scenario | Macro conditions | Implication for XAU/EUR |
|---|---|---|
| Soft landing with lower real yields | Euro and global yields fall, inflation expectations remain contained, risk sentiment stays neutral to negative | Constructive. Lower real yields reduce opportunity cost, while hedging demand persists [T3][T6] |
| Stagflation or inflation shock | Energy or supply shocks lift inflation concerns, policy credibility weakens, reserve managers keep diversifying | Strongly supportive. Gold benefits from real-asset demand, inflation hedging and reserve diversification [T7] |
| Higher-for-longer real yields and stronger USD | Real yields rise, dollar strengthens, inflation expectations fall, investors prefer interest-bearing assets | Bearish or consolidative. Opportunity cost rises and stronger USD can pressure global gold [T6] |
| Geopolitical fragmentation | Sanctions risk, payment-system fragmentation and reserve-security concerns increase | Supportive. Central banks prefer assets not tied to a single sovereign entity [T5] |
| Liquidity shock | Risk assets fall sharply, investors sell liquid holdings to raise cash | Initially negative, then potentially supportive if safe-haven flows dominate |
Current conditions sit between the first and third scenarios. Euro yields have declined recently, but gold price momentum remains negative. EUR/USD has fallen 2.16% over one month and 4.43% YTD, which can support EUR gold if USD gold is stable, but would become a headwind if the euro rebounds.
Valuation Discussion
Gold has no cash flow, coupon or earnings stream. Its valuation is therefore a function of opportunity cost, currency confidence, liquidity preference, reserve demand and scarcity. The current EUR price of €3,641.93 is 22.32% below the January 2026 ATH and 187.84% above the 2019 ATL. That places gold in a significant drawdown from peak, but not in a long-term value zone by historical range alone.
The traditional valuation model remains rate-based: when real yields rise, non-yielding gold should become less attractive. J.P. Morgan highlights this inverse real-yield relationship while also noting that it has broken down at times [T3]. Lombard Odier states that gold is sensitive to real yields and that higher yields and a stronger dollar are key headwinds, but also argues that fiscal uncertainty and purchasing-power erosion continue to favor real assets [T6].
The re-anchored valuation model assigns more weight to official-sector buying, fiscal credibility concerns and geopolitical fragmentation. This helps explain why gold can remain resilient even when nominal yields are high. A market discussion cited in the supplied sources argues that gold’s pricing logic is re-anchoring as investors focus on debt sustainability, inflation persistence and fiat purchasing-power risk [T1].
For EUR investors, valuation also includes FX translation. EUR/USD at 1.1230 is down 2.16% over one month and 4.43% YTD. If USD gold is unchanged, EUR depreciation raises the EUR gold price mechanically. Conversely, EUR appreciation can dilute gains or deepen losses for euro-based holders.
Risks
- Real-yield risk: Gold does not generate income, so rising real yields increase the opportunity cost of holding it [T3].
- Dollar risk: A stronger USD can pressure global gold pricing, even if EUR translation partly offsets the move for euro investors [T6].
- Momentum risk: XAU/EUR is already down 5.63% over 30 days and 11.91% over 200 days. A failed stabilization could extend the drawdown.
- Demand risk: Higher-for-longer real yields, prolonged ETF demand decline and weaker physical demand, including jewellery, are negative factors to monitor [T6]. ETF flow data are unavailable in this bundle.
- Reserve-flow execution risk: Survey intentions are not guaranteed purchases. The central bank thesis depends on stated expectations becoming realized flows.
- Positioning risk: If the debasement and reserve-diversification narratives are already priced, gold can correct despite favorable long-term fundamentals. The supplied source explicitly cautions that the debasement trade does not imply a one-way rally [T1].
- EUR investor risk: EUR appreciation versus USD could reduce EUR-denominated gold returns even if USD gold is stable or rising.
- Data risk: Direct real yields, inflation breakevens, ETF flows, physical premiums, Bitcoin spot data and Ethereum spot data are unavailable.
Appendix
Data and calculation notes
- Bundle generated at 2026-10-22T04:21:57.348088Z.
- Gold market data retrieved at 2026-10-22T04:21:48.715016Z.
- Rates data are as of 2026-10-20. FX data are as of 2026-10-22.
- ATH drawdown: (€3,641.93 / €4,688.32 – 1) x 100 = -22.32%.
- ATL gain: (€3,641.93 / €1,265.28 – 1) x 100 = +187.84%.
- 24h range: €3,685.02 – €3,642.68 = €42.34; €42.34 / €3,641.93 = 1.16%.
- Tracked volume / market cap: €101,796,207 / €1,608,523,638 = 6.33%.
- Euro curve slopes: 5Y-2Y = 13.8 bp; 10Y-2Y = 41.2 bp; 30Y-10Y = 25.4 bp.
- Total crypto volume / total crypto market cap: €77.84bn / €2,484.40bn = 3.13%.
- The supplied market cap, supply and rank refer to the tracked gold-linked instrument feed, not the full physical gold market.
Key unavailable data
Unavailable metrics include direct real-yield time series, inflation breakevens, ETF flows, central bank monthly purchase series, COMEX positioning, jewellery demand, physical premiums, USD gold spot, Bitcoin spot price, Bitcoin returns, Ethereum spot price, Ethereum returns and Ethereum market capitalization.
Sources
- [T1] Gold Holds Above $4,000 Even as US Treasury Yields Top 5% — Institutions Say Gold’s Pricing Logic Is “Re-Anchoring” — BigGo Finance
- [T2] Central Bank Gold Purchases Hit 1,000t Average: WGC Survey
- [T3] Is it a golden era for gold? | J.P. Morgan Private Bank U.S.
- [T5] Central banks are turning back to gold – OMFIF
- [T6] Gold’s slowdown doesn’t signal a reversal | Lombard Odier
- [T7] Central Bank Gold Reserves Survey 2026 | World Gold Council
- [T8] A Historic Shift Is Happening in Global Reserves
This report is AI-generated, for informational purposes only, and does not constitute investment advice, an offer, or a solicitation to buy or sell any financial instrument.
Important Note / Wichtiger Hinweis:
EN: This report may have been generated using AI. It processes data from publicly available sources. The content is provided for informational purposes only.DE: Dieser Bericht kann mithilfe von KI erstellt worden sein. Dabei werden Daten aus öffentlich zugänglichen Quellen verarbeitet. Die Inhalte dienen ausschließlich Informationszwecken.
* DE: Die ergänzenden Inhalte können KI-generiert sein. EN: The additional content may be AI-generated.