
Watch the video
This player shows only the Bitcoin chapter of the daily altii market briefing. Watch the full video on tube.altii.de.
Key Data Snapshot
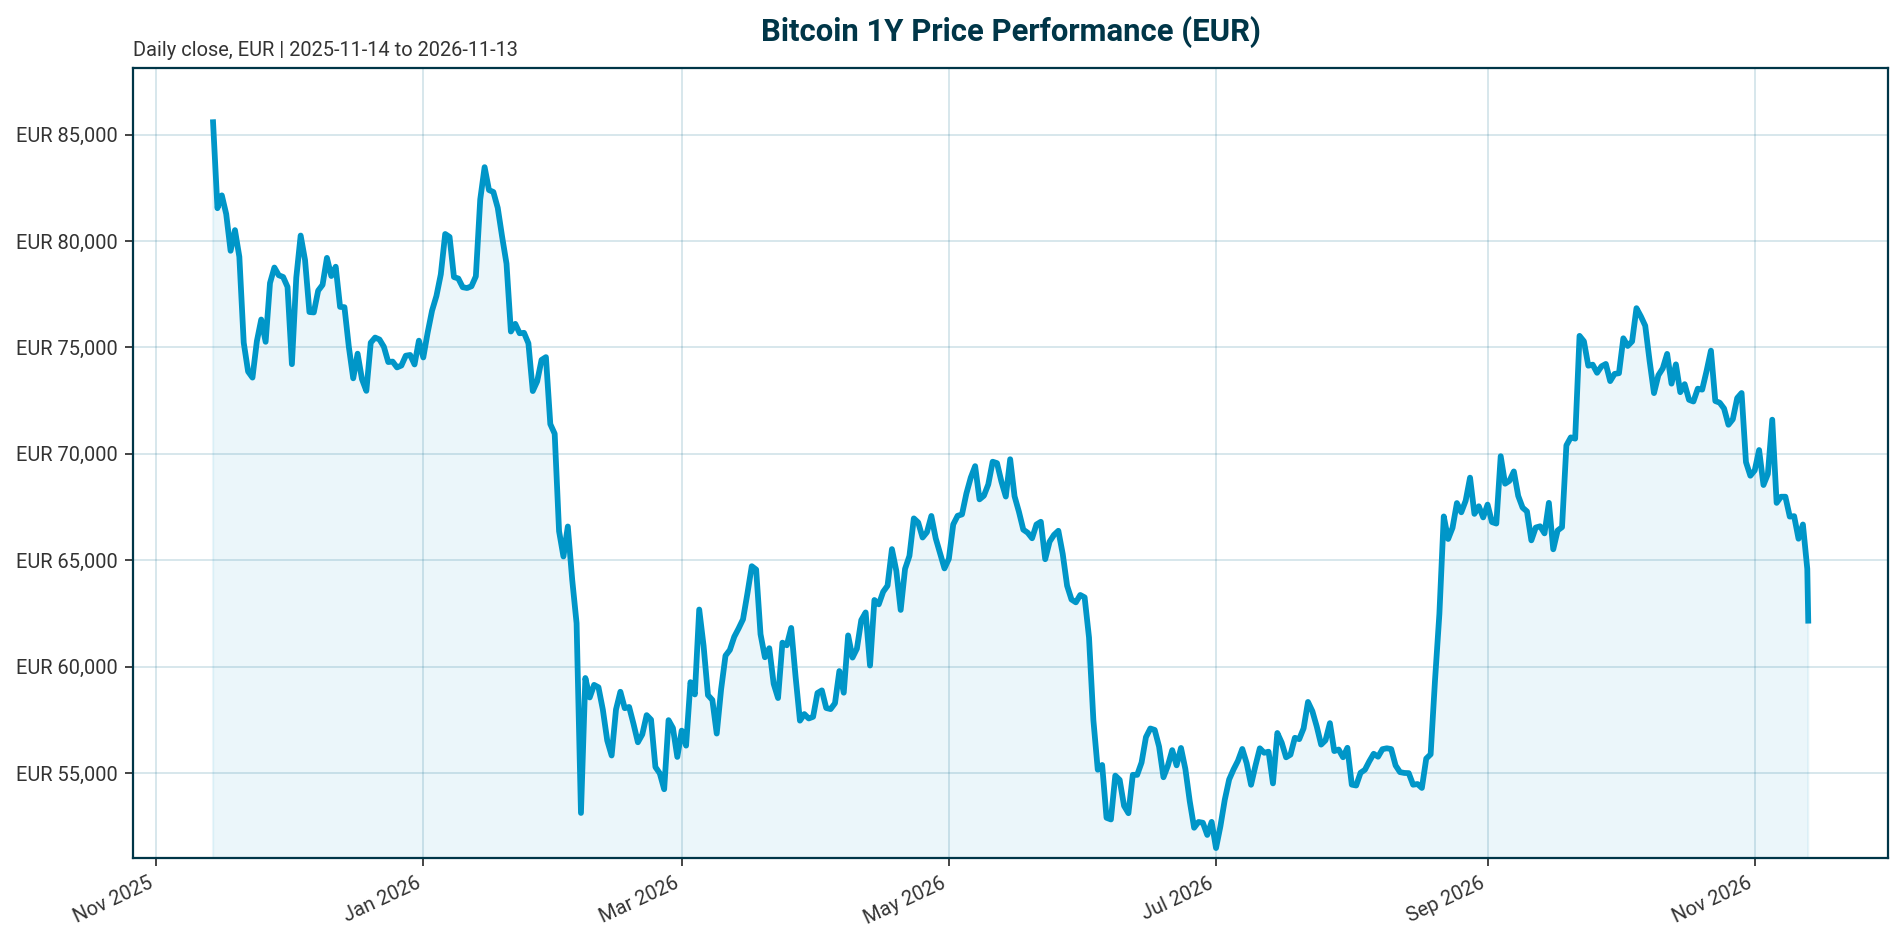
Bitcoin (BTC) trades at EUR 62,073 as of 2026-11-13 05:15 UTC, down 6.43% over 24 hours and 42.34% below its all-time high of EUR 107,662 set on 2025-10-06. The downtrend is accelerating: losses over 30 days (-18.03%) exceed losses over 7 days (-9.57%) by 8.46 percentage points, indicating sustained distribution rather than a single shock.
| Metric | Value |
|---|---|
| Price (EUR) | 62,073 |
| 24h range (EUR) | 61,835 to 66,593 |
| 1h / 24h / 7d / 14d / 30d change | -0.48% / -6.43% / -9.57% / -12.17% / -18.03% |
| 200d / 1y change | -13.34% / -32.81% |
| Market cap (EUR) | 1.248 trillion (rank 1) |
| Fully diluted valuation (EUR) | 1.248 trillion |
| 24h volume (EUR) | 33.19 billion |
| Circulating / max supply | 20,111,231 / 21,000,000 (95.77% issued) |
| BTC dominance | 59.09% (reported); 59.41% computed from market cap / total crypto cap |
| All-time high | EUR 107,662 (2025-10-06); current price -42.34% below |
| Recovery needed to ATH | +73.44% |
Liquidity proxy: market cap divided by 24h volume equals roughly 37.6x. The reported dominance (59.09%) and the computed ratio (1,248,340,432,324 / 2,101,504,373,239 = 59.41%) differ slightly due to source methodology; both confirm bitcoin remains the crypto benchmark.
Market Setup
The cross-asset backdrop is mixed. Risk sentiment reads neutral to positive, but equity momentum is moderately negative: the S&P 500 is down 2.73% and the Nasdaq Composite down 6.76% over one month, while the DAX is up 5.99% over the same period. DACH equities are outperforming, averaging 3.79% over 5 days versus 1.84% for global equity indicators, with the Nikkei 225 the strongest 5-day mover at +4.22% and the Hang Seng the weakest at -2.97%.
Rates are the key macro constraint for bitcoin. The Fed funds target range stands at 3.75% to 4.00% as of 2026-11-12, following a 25 bp hike effective 2026-09-17. The ECB deposit facility rate is 2.50% as of 2026-11-13, following a 25 bp hike effective 2026-09-16. The Fed-to-ECB policy spread is 137.5 bp (midpoint 3.875% minus 2.50%). Euro area AAA 10Y yield is 3.34%, up 4.6 bp over 5 days but down 15.9 bp over 1 month; the 2Y yield is up 93.7 bp year to date, and the 10Y-2Y spread sits at 29.5 bp. This is a restrictive backdrop for a non-yielding risk asset.
FX is mixed. EUR/USD trades at 1.1106, down 0.72% over 5 days and 5.48% year to date. A weaker dollar partially cushions EUR-quoted BTC downside; the indicative USD reference price is roughly USD 55,895 (62,073 / 1.1106), for cross-referencing USD-denominated targets only.
Investment Thesis
Bitcoin has institutionalised. Spot ETFs, corporate treasuries, regulated custody and market-structure legislation now shape price behaviour in ways the 2020-2021 cycle lacked entirely [T6]. In 2025, US spot bitcoin ETFs and digital asset treasuries absorbed 1.2 times active supply growth, and by year-end 2025 ETFs and DATs held more than 12% of all bitcoin outstanding [T8, February 2026]. ETF flows have effectively become bitcoin’s new macro indicator: record Q4 2025 outflows coincided with breaks of key support around $98,000 [T2].
The current drawdown is best understood as a flow-driven digestion phase within that institutional regime. Q2 2026 brought $4.67 billion in net spot ETF redemptions, the largest quarterly outflow since spot products launched in January 2024, with June alone a record redemption month. The pattern points to profit-taking and rotation into traditional markets rather than a structural exit from the asset class [T1, July 2026]. Institutional adoption has deepened liquidity and price discovery, but it has also tied BTC more closely to traditional macro and credit cycles than during the retail era [T3].
The thesis therefore hinges on two variables: whether regulated capital returns, and whether policy eases. Constructive case: a sustained return to positive ETF flows plus CLARITY-style legislation converts the built infrastructure into a durable demand bid, consistent with Grayscale’s conditions for new crypto highs in 2026 [T7]. Cautious case: the Coinbase Premium Index has repeatedly turned negative in 2026 and exchange stablecoin dry powder has declined, meaning actual spot demand has not yet validated the infrastructure narrative [T6]. With the price 42.34% below ATH and dominance at 59.09%, the market is infrastructure-rich but currently demand-poor.
Bullish Drivers
- Regulatory clarity. The CLARITY Act would establish a federal market-structure framework for digital assets and could unlock broader institutional participation if passed [T1]. A September 15 CLARITY Act vote was flagged as a key sentiment catalyst [T5]. Grayscale expects Congress to pass bipartisan market-structure legislation in 2026, building on the 2025 GENIUS Act on stablecoins [T7].
- Structural ETF demand. ETFs and DATs absorbed 1.2x active supply growth in 2025 and hold over 12% of outstanding bitcoin [T8, February 2026]. Platform access widened in Q4 2025: Morgan Stanley expanded client access to regulated bitcoin products and Vanguard added third-party bitcoin ETFs to its platform [T8].
- Volatility compression. Bitcoin’s volatility declined from 84% to 43% according to the Glassnode x Fasanara Digital Assets Report 2025, supporting institutional allocation frameworks [T2].
- Market structure maturation. Deeper liquidity, accessible hedging tools and time-weighted institutional buying reduce extreme retail-driven swings [T4]. Analyst projections cited for the cycle include corporate crypto holdings surpassing $250 billion and more than 100 new crypto-linked ETFs [T4].
- Dated upside scenario. One analyst view holds that renewed ETF and ETP inflows on regulatory clarity could push bitcoin toward $200,000 over the next full cycle if macro conditions cooperate [T2]. This is a conditional cycle target, not a forecast.
Relative Positioning vs Gold and Ethereum
Current gold and ethereum prices are not in the dataset, so quantitative relative-return comparisons are unavailable. The positioning assessment therefore relies on flow and narrative evidence.
Versus gold: Both assets compete for the alternative store-of-value allocation that Grayscale cites as a fundamental crypto support [T7]. The difference is flow dependence. Gold’s price is not hostage to ETF redemption cycles in the way bitcoin’s currently is; Q2 2026’s $4.67 billion in bitcoin ETF redemptions [T1] illustrate the vulnerability. With the Fed at 3.75% to 4.00% and the ECB at 2.50% after September 2026 hikes, the carry disadvantage of both non-yielding assets versus bonds is elevated, but gold’s lower volatility and independence from crypto-specific flow risk favour it over the report horizon if outflows persist. If real yields fall and ETF flows turn positive, bitcoin’s higher beta becomes the advantage.
Versus ethereum: Bitcoin holds the relative-preference edge. Its dominance of 59.09% reflects capital concentration in the deepest, most liquid crypto asset. Ethereum ETFs recorded $690 million in net Q2 2026 outflows, following bitcoin’s larger redemptions [T1, July 2026]. Bitcoin remains the centre of the 2026 institutional narrative [T4]. The catch-up scenario requires broadening: altcoin ETF approvals for SOL and XRP products in the regulatory pipeline [T5] could rotate capital down the risk curve and lift higher-beta crypto including ETH ahead of bitcoin.
Scenario Framework
Three variables drive the 6 to 12 month outlook: ETF flow direction, CLARITY Act progress, and the Fed’s stance from the current 3.75% to 4.00% range.
- Bull case. Sustained positive ETF net flows return, market-structure legislation passes, and the Fed pivots toward easing from the 3.75% to 4.00% range. BTC reclaims a substantial share of the 42.34% drawdown from the EUR 107,662 ATH. Conditional analyst cycle targets as far as $200,000 apply only if macro cooperates [T2].
- Base case. Rates hold at current levels, ETF flows oscillate around neutral, and regulation advances incrementally. BTC trades sideways-to-higher in EUR, well below the October 2025 peak, while institutional infrastructure keeps building. Note: a July 2026 market expectation held the Fed would keep rates on hold through Q3 under Chair Kevin Warsh [T1]; the September 2026 hike partially overtakes that dated expectation.
- Bear case. ETF redemptions resume at Q2 2026 scale, the CLARITY Act stalls, and the post-hike policy stance tightens financial conditions further. BTC breaks below the recent EUR 61,835 low and extends the 30-day -18.03% trend, with persistently negative Coinbase Premium readings confirming absent US spot demand [T6].
Valuation Discussion
Bitcoin has no cash flows, so DCF and earnings-based frameworks do not apply. Valuation rests on scarcity and flows. On the supply side, 20,111,231 of 21,000,000 bitcoin are issued (95.77%), and market cap (EUR 1.248 trillion) is effectively identical to fully diluted valuation (EUR 1.248 trillion). Scarcity is intact, but with 95.77% of supply already outstanding, marginal price is set by demand flows, not issuance.
The flow evidence is contradictory. Demand absorbed 1.2x active supply growth in 2025, yet price still fell on exogenous shocks: the October 10 liquidation event from a software glitch, four-year-cycle fears, and quantum-computing sentiment [T8, February 2026]. In 2026, the negative Coinbase Premium Index and declining exchange stablecoin ratio suggest spot demand does not currently justify infrastructure-based valuations [T6].
Two valuation paths follow. Repair: if flow demand normalises while supply growth stays capped, the 2025 supply-demand asymmetry reasserts and supports re-rating toward prior-cycle highs; the recovery required to the ATH is +73.44%. Compression: if the demand gap persists, the market prices bitcoin closer to a cyclical commodity than a maturing institutional asset, consistent with Grayscale’s warning that crypto can experience prolonged cyclical drawdowns [T7]. Volatility compression from 84% to 43% [T2] lowers risk-premium assumptions in either path but does not resolve the demand question.
Risks
- Policy risk. The Fed at 3.75% to 4.00% and the ECB at 2.50% after September 2026 hikes leave little room for error. Further tightening or higher-for-longer pressures all risk assets, and bitcoin’s institutionalisation has increased, not decreased, its macro sensitivity [T3].
- Flow reversal risk. Q2 2026’s $4.67 billion in net ETF redemptions was the largest quarterly outflow since the January 2024 launch, with June a record redemption month [T1, July 2026]. A repeat would extend the drawdown beyond -42.34% from ATH.
- Regulatory risk. Failure or dilution of the CLARITY Act would remove the key adoption catalyst [T1, T3, T5].
- Custody and concentration risk. Custody remains an operational risk even with qualified custodians, and ETF assets are concentrated in a handful of issuers, creating market-structure vulnerability if any issuer experiences operational stress [T3].
- Macro-correlation risk. Institutional adoption has tied BTC more closely to traditional macro and credit cycles; it has not reduced volatility as some expected [T3].
- Technology and sentiment risk. Cited 2025-2026 shocks include the October 10 liquidation event from a software glitch, four-year-cycle turning fears, and quantum-computing concerns around bitcoin’s cryptography [T8].
- DAT leverage risk. Treasury-leveraged equity strategies have shown amplified drawdowns relative to the underlying token [T3].
Appendix
Methodology and Data Provenance
- Market data retrieved 2026-11-13T05:15:10Z via CoinGecko, quote currency EUR.
- Market overview data as of 2026-11-12/13 from STOXX, Wiener Boerse, FMP, ECB yield curve, Frankfurter FX and FRED.
- Policy rates from the authoritative policy rates block: Fed funds target range 3.75% to 4.00% (as of 2026-11-12, FRED); ECB deposit facility rate 2.50% (as of 2026-11-13, ECB key rate).
- ETF flow figures are USD-denominated per source attribution; conversion to EUR was not possible without historical FX data.
- No current gold or ethereum prices are in the dataset; relative positioning is qualitative.
- The most recent ETF flow datapoint is Q2 2026 [T1], leaving a flow data gap of roughly four months before the report date.
- Report profile: crypto_institutional; benchmark assets: gold and ethereum.
Sources
- [T1] Q2 2026 Digital Asset Review (July 2026). CoinDesk Indices
- [T2] Crypto Market 2025: Year-End Review & Expert Insights. TradingView News
- [T3] Institutional Bitcoin Adoption Explained: How Blackrock, Fidelity and Others Embraced BTC. The Block
- [T4] Crypto Analysis for 2026: Bitcoin, ETFs, Regulation. Blockchain Council
- [T5] Crypto ETFs Enter a New Phase in September: Here’s What Investors Should Watch. Bitcoin Foundation
- [T6] Bitcoin’s 2026 Market Structure Reveals A Problem Hidden Beneath ETF Growth. TradingView News
- [T7] 2026 Digital Asset Outlook: Dawn of the Institutional Era. Grayscale Research
- [T8] Bitcoin’s Evolving Institutional Role (February 2026). ARK Invest
Disclaimer
This report is AI-generated and for informational purposes only. It does not constitute investment advice, a recommendation, or an offer to buy or sell any financial instrument. Data may be incomplete, delayed or inaccurate, and several cited news sources lack publication dates in the dataset. Readers should independently verify all figures and consult a licensed financial advisor before making investment decisions.
Important Note / Wichtiger Hinweis:
EN: This report may have been generated using AI. It processes data from publicly available sources. The content is provided for informational purposes only.DE: Dieser Bericht kann mithilfe von KI erstellt worden sein. Dabei werden Daten aus öffentlich zugänglichen Quellen verarbeitet. Die Inhalte dienen ausschließlich Informationszwecken.