
Listen to the summary
Key Data Snapshot
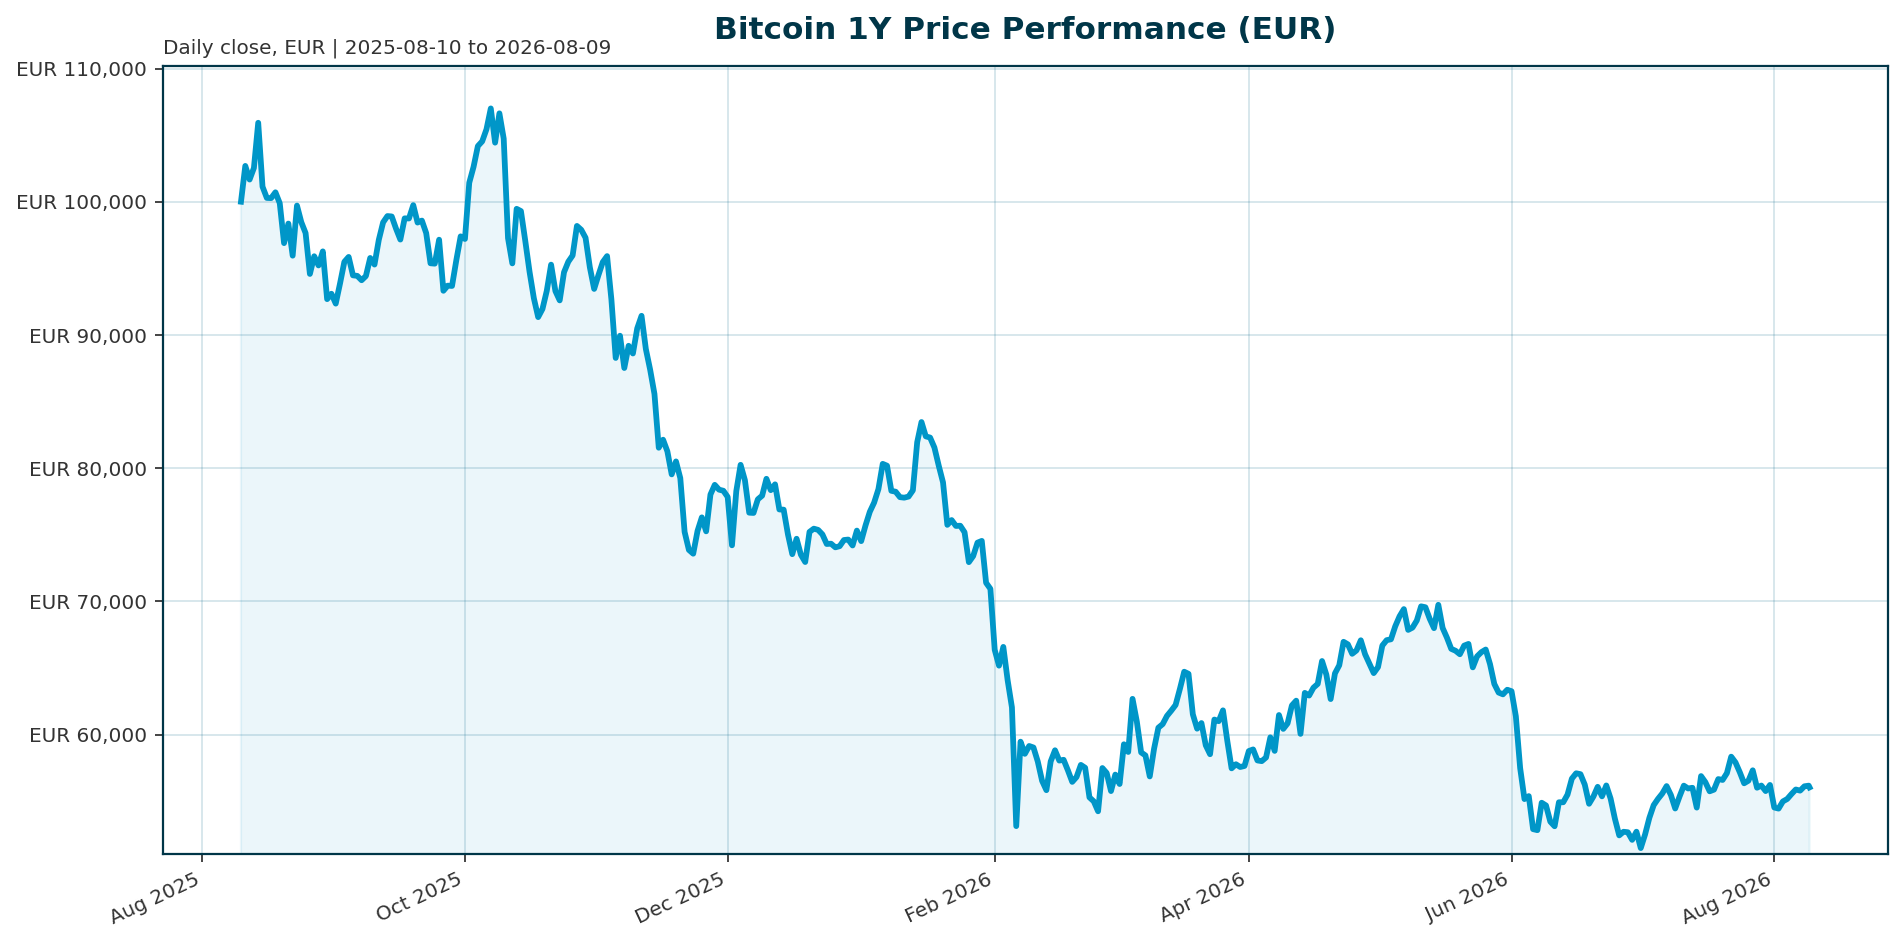
| Asset | Price (EUR) | 24h Change | 200d Change | Market Cap (EUR) |
|---|---|---|---|---|
| Bitcoin (BTC) | 56,044.00 | -0.20% | -27.30% | 1.12T |
Key Metrics:
- 24h Range: €55,979 – €56,364 (Range: 0.69% of price).
- Supply & Scarcity: 20,067,687 BTC circulating of 21,000,000 max supply (4.43% remaining issuance).
- Volatility: BTC has evolved into a more stable asset, with volatility decreasing from 84% to 43% year-over-year [T3].
- FDV Discrepancy: Reported Fully Diluted Valuation (FDV) is €1.12T, but calculated FDV (Price × Max Supply) is €1.18T. The reported figure suggests a potential discount or data adjustment.
Market Setup
Risk sentiment is positive, supported by Nasdaq Composite strength and moderately positive equity momentum globally. However, the backdrop is nuanced. Euro area yields are mixed, with the 10-year yield at 3.15% and down 8.1 basis points over the last five days. FX markets are choppy, with EUR/USD flat over the same period. While institutional access is broadening, the macro environment remains constrained by limited room for Fed policy easing and persistent inflation concerns [T1][T2].
Investment Thesis
The investment thesis centers on Bitcoin’s transition from speculative asset to institutional-grade store of value. The asset is defined by strict supply scarcity (21 million cap) and a maturing access layer via spot ETFs and regulated investment vehicles. By the end of 2025, Bitcoin entered an “institutional supply era,” with 6.7 million BTC held across ETFs, exchanges, and treasuries [T3]. The primary value driver is now institutional demand and regulatory clarity rather than retail speculation alone.
Bullish Drivers
- ETF Inflows & Liquidity: Institutional capital is returning. On August 5, BlackRock’s spot crypto ETFs captured over 80% of daily flows, drawing $305 million (IBIT: $197M, ETHA: $50M) [T5]. Sustained daily inflows exceeding $400 million are cited as a foundation for continued growth [T6].
- Regulatory Clarity: The potential passage of the CLARITY Act could establish a federal market structure framework, unlocking broader participation [T1]. Clearer rules would reduce headline risk and encourage asset managers to expand digital-asset offerings.
- Supply Constraints: With only 4.43% of the total supply remaining to be mined, incremental demand creates immediate scarcity pressure.
- Volatility Compression: Bitcoin has become less volatile, evolving into a more stable asset class suitable for traditional portfolios [T3].
Relative Positioning vs Gold and Ethereum
- Bitcoin vs. Gold: While gold remains the primary unpriced benchmark for store-of-value comparison, Bitcoin offers higher beta and digital-native properties. BTC currently holds 56.6% dominance of the total crypto market cap [T3].
- Bitcoin vs. Ethereum: Institutional demand appears concentrated in spot Bitcoin products. BlackRock’s ETF flows highlight Bitcoin as the primary institutional entry point, though Ethereum and Layer-2 activity remain supportive for the broader ecosystem [T5].
Scenario Framework
- Bear Scenario (30% Probability): ETF inflows reverse or stall due to higher-for-longer rates or regulatory setbacks. BTC fails to reclaim the €80,000 psychological level and remains range-bound below €60,000.
- Base Scenario (50% Probability): BTC consolidates and gradually recovers. Sustained but moderate ETF flows and improved regulatory visibility support a slow re-rating toward the lower end of 2026 institutional targets ($85,000–$132,000 USD) [T6].
- Bull Scenario (20% Probability): The CLARITY Act passes and liquidity conditions ease. Institutional rotation accelerates, pushing BTC toward the upper end of target ranges or $150,000 USD, driven by corporate treasury accumulation and renewed risk appetite.
Valuation Discussion
Valuation is driven by scarcity and institutional adoption rather than cash flows. BTC is currently -47.9% below its EUR all-time high (ATH) of €107,662. The “FDV gap” (Reported €1.12T vs. Calculated €1.18T) suggests the market may be pricing in a discount or awaiting further issuance. The current setup favors accumulation at the lower end of the 2026 valuation band, contingent on the resolution of regulatory hurdles and the persistence of ETF flows.
Risks
- Macro & Liquidity: Inflation remains a concern, and the Fed is expected to hold rates through Q3, limiting the policy easing that historically supports risk assets [T1].
- Regulatory Uncertainty: The U.S. regulatory backdrop remains unresolved. Banks attempting to derail landmark crypto legislation could slow the next wave of institutional onboarding [T5].
- Market Structure: Concentration risk exists, with BlackRock commanding a dominant share of ETF flows. A sudden shift in macro conditions or a legal challenge to spot ETFs could quickly change the flow picture [T5].
- Volatility: Despite institutionalization, BTC remains a volatile asset class subject to “old-fashioned crypto volatility” [T2].
Appendix
Sources
- Q2 2026 Digital Asset Review [T1]
- Bitcoin Holds Near $80K–$81K as ETF Inflows Revive Bullish Sentiment [T2]
- Crypto Market 2025: Year-End Review & Expert Insights [T3]
- Bitcoin Breaks Out to $66.6K, Closing the Gap with Equities as ETF Flows Flip Positive [T4]
- BlackRock Commands $305M ETF Inflows as Institutional Bitcoin and Ether Demand Holds [T5]
- Bitcoin Price Prediction 2026: Institutional Adoption [T6]
- BlackRock Bitcoin ETF Achieves Staggering $935M Q1 Inflow Milestone [T8]
Disclaimer: This report is AI-generated for informational purposes only and does not constitute investment advice. The views expressed are those of the author and do not necessarily reflect the views of Venice.ai or its operators. Please consult a qualified financial advisor before making investment decisions.
Important Note / Wichtiger Hinweis:
EN: This report may have been generated using AI. It processes data from publicly available sources. The content is provided for informational purposes only.DE: Dieser Bericht kann mithilfe von KI erstellt worden sein. Dabei werden Daten aus öffentlich zugänglichen Quellen verarbeitet. Die Inhalte dienen ausschließlich Informationszwecken.
* DE: Die ergänzenden Inhalte können KI-generiert sein. EN: The additional content may be AI-generated.