
Listen to the summary
Key Data Snapshot
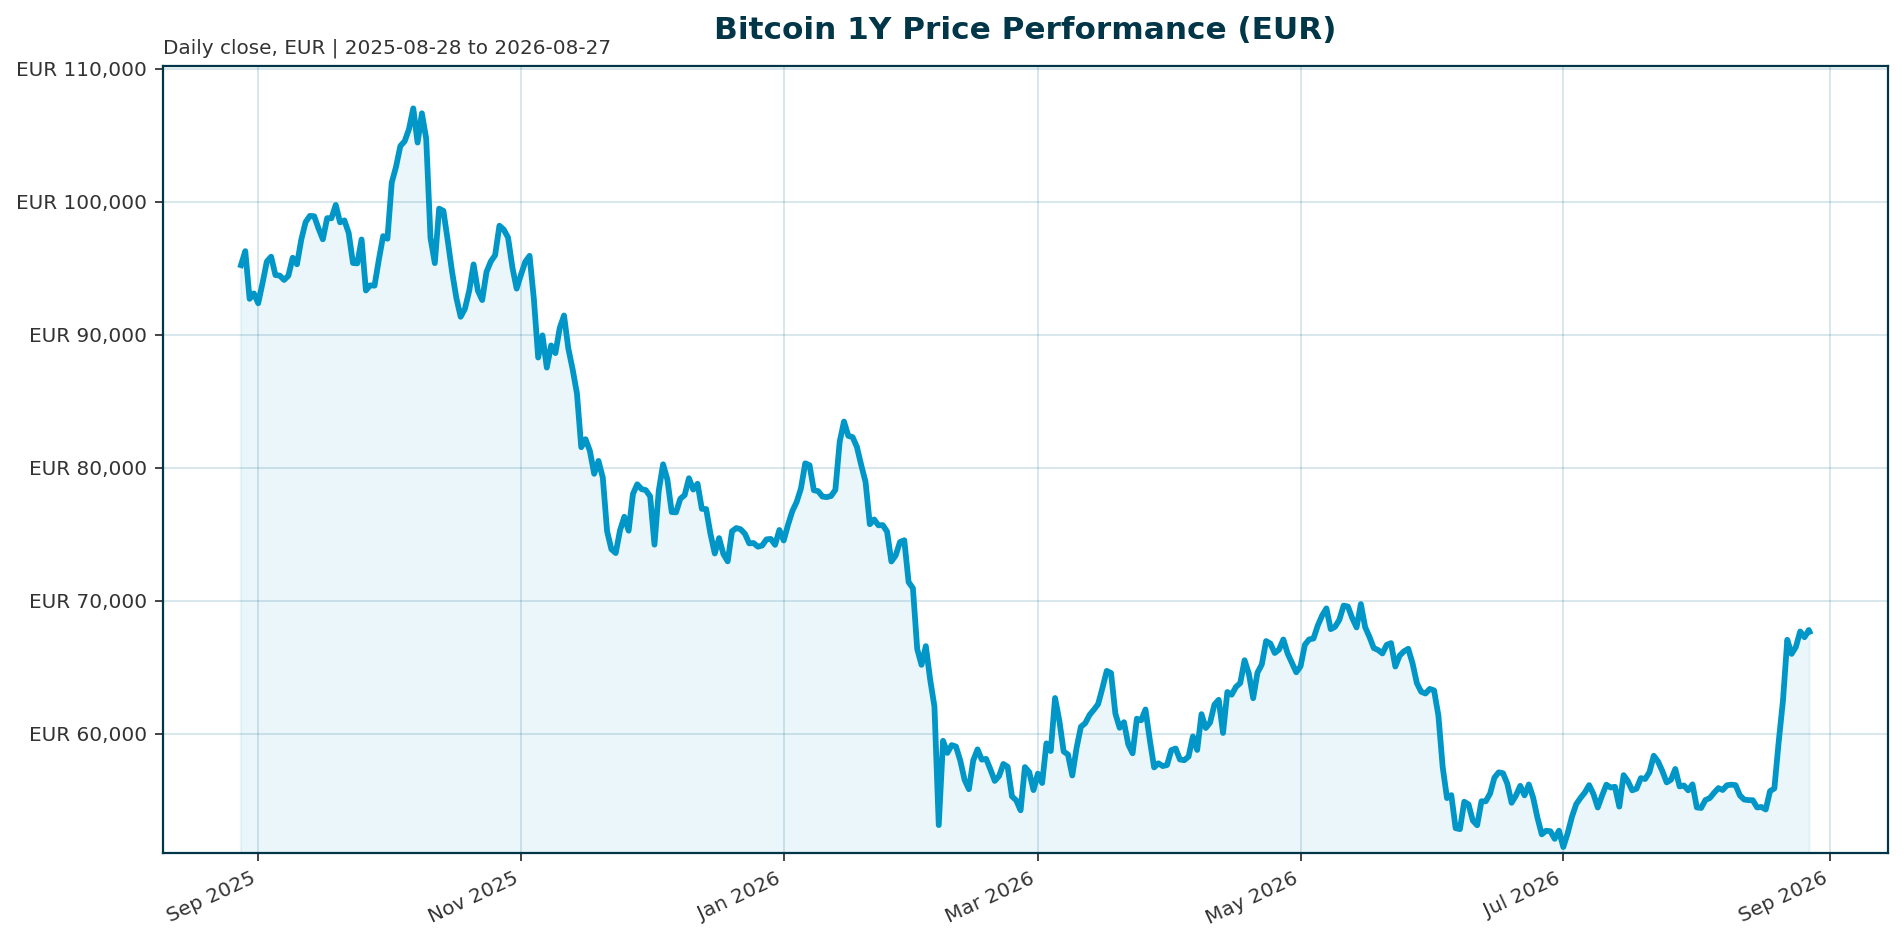
| Metric | Value | Change (24h) |
|---|---|---|
| Price (EUR) | 67,646.00 | -0.12% |
| Market Cap (EUR) | 1.36 Trillion | -0.06% |
| 7-Day Change | +13.8% | – |
| 200-Day Change | +13.6% | – |
| All-Time High (ATH) | 107,662.00 (Oct 2025) | -37.2% |
| BTC Dominance | 59.13% | – |
Market Setup
Risk sentiment remains positive, supported by strong performance in DACH equities where the ATX leads with a 5-day gain of 2.91%. The broader equity landscape shows a divergence, with the Hang Seng lagging at -1.75% while the Nikkei 225 gains 6.56% over one month. The macro backdrop is mixed, with the Euro Area AAA 10-year yield at 3.24% and the 2-year yield at 2.75%, creating a complex yield curve environment. The FX backdrop shows EUR/USD at 1.1674, weakening slightly over the past five days. These conditions suggest a supportive environment for risk assets like Bitcoin, provided liquidity remains stable.Investment Thesis
Bitcoin has transitioned from a speculative retail asset to a core component of institutional portfolio allocation. The defining thesis is that regulatory clarity and structural demand have decoupled the asset from pure volatility. With the U.S. BITCOIN Act and EU MiCA regulations normalized, institutions now view Bitcoin as a systemic inflation hedge rather than a fringe asset. The narrative centers on Bitcoin acting as “digital gold,” providing a hedge against political instability and currency debasement, supported by a massive capital reallocation into ETFs and corporate treasuries.Bullish Drivers
Regulatory tailwinds continue to drive institutional entry. The SEC has signaled a cooperative approach to tokenized securities, and streamlined ETF approval rules are accelerating the pipeline for new funds [T1][T6]. Macro conditions favor Bitcoin as the Federal Reserve is expected to cut rates, with odds of a December cut surging to 86.2%, making high-yield assets like BTC more attractive versus traditional bonds [T7]. Capital inflows remain robust, with spot ETFs attracting $132.5 billion in cumulative inflows and corporate treasuries holding over 7% of total supply, creating a structural floor for the price [T2][T4].Relative Positioning vs Gold and Ethereum
Bitcoin and Gold have recently moved in tandem as safe havens, with both hitting record highs amid inflation and geopolitical tensions [T6]. However, their correlation profiles differ. Gold historically correlates with inflation, while Bitcoin shows erratic behavior, often amplifying market swings rather than smoothing them [T5]. In contrast, Ethereum is increasingly viewed as a yield-bearing asset, with ETFs retaining 80% of peak inflows and offering staking rewards estimated at 3% to 4% annually, potentially outperforming Bitcoin in income-oriented strategies [T3].Scenario Framework
- Bull Case (Target >$200,000): A successful Fed rate cut and continued regulatory clarity trigger a breakout above the 117,000 EUR resistance level. Institutional capital expands aggressively, pushing the market cap toward $3 trillion.
- Base Case (Range $80,000 – $110,000): Bitcoin stabilizes as institutional absorption continues. The asset trades within a tight range, with ETF flows providing support while macro uncertainty keeps volatility elevated.
- Bear Case (Rejection to $60,000): A hawkish pivot in Fed policy or a delay in U.S. crypto market structure legislation until 2027 triggers a liquidity squeeze. The “tourist investor” base exits, potentially driving the price toward the 60,000 EUR support zone [T3][T8].
Valuation Discussion
Bitcoin is currently trading at 67,646 EUR, representing a 37% drawdown from its October 2025 ATH of 107,662 EUR. Despite the correction, the asset remains above its 200-day moving average (+13.6% over the last 200 days), suggesting a recovery phase. The market cap is 1.36 Trillion EUR, with a fully diluted valuation of 1.36 Trillion EUR. Given the max supply of 21 million BTC, current pricing implies a valuation of approximately 64,761 EUR per coin if fully diluted, suggesting the asset is currently trading slightly above a theoretical “max supply” valuation but significantly below peak euphoria levels.Risks
The primary risks stem from regulatory gridlock and macroeconomic shifts. U.S. Senate negotiations on stablecoin yield rules are stalled, risking a delay in regulatory clarity until after the 2026 midterms, which could limit new institutional participation [T3]. Additionally, the asset remains vulnerable to “tourist investors” who exit at the first sign of volatility, as evidenced by recent melt-downs where the resident institutional base has not yet fully matured to absorb all selling pressure [T8]. Finally, a sudden pivot to hawkish Fed policy or a liquidity squeeze would likely cap upside regardless of fundamental strength [T1].Appendix
Sources
- Bitcoin Adoption And Regulatory Developments Crucial As October Kicks Off – Forbes [T1]
- The Institutional Bitcoin Adoption Wave: A Paradigm Shift in Digital Asset Allocation – AInvest [T2]
- Crypto SWOT: U.S. spot Bitcoin ETFs drew $697 million in inflows on the second trading day of 2026 – KITCO [T3]
- Is Bitcoin’s 12% Pullback a Buying Opportunity or a Warning Sign? – AInvest [T4]
- Debunking Bitcoin Myths: Exploring the Truth Behind the Cryptocurrency’s Role in the Market – AInvest [T5]
- Bitcoin Hits $110K: Bull Run to $200K or a Downward Slide to $80K? Latest Crypto Market Update – ts2.tech [T6]
- Bitcoin Bounces Back As Markets ‘Aggressively’ Front-Run Fed Meeting, Says Analyst – Forbes [T7]
- Bitcoin is struggling again after a brief comeback. Here’s what’s keeping it down. – Business Insider [T8]
Disclaimer: This report is AI-generated for informational purposes only and does not constitute investment advice. The analysis is based on data available as of the report date and should not be considered as a guarantee of future performance. Readers should conduct their own due diligence before making investment decisions.
Important Note / Wichtiger Hinweis:
EN: This report may have been generated using AI. It processes data from publicly available sources. The content is provided for informational purposes only.DE: Dieser Bericht kann mithilfe von KI erstellt worden sein. Dabei werden Daten aus öffentlich zugänglichen Quellen verarbeitet. Die Inhalte dienen ausschließlich Informationszwecken.
* DE: Die ergänzenden Inhalte können KI-generiert sein. EN: The additional content may be AI-generated.