
Listen to the summary
Key Data Snapshot
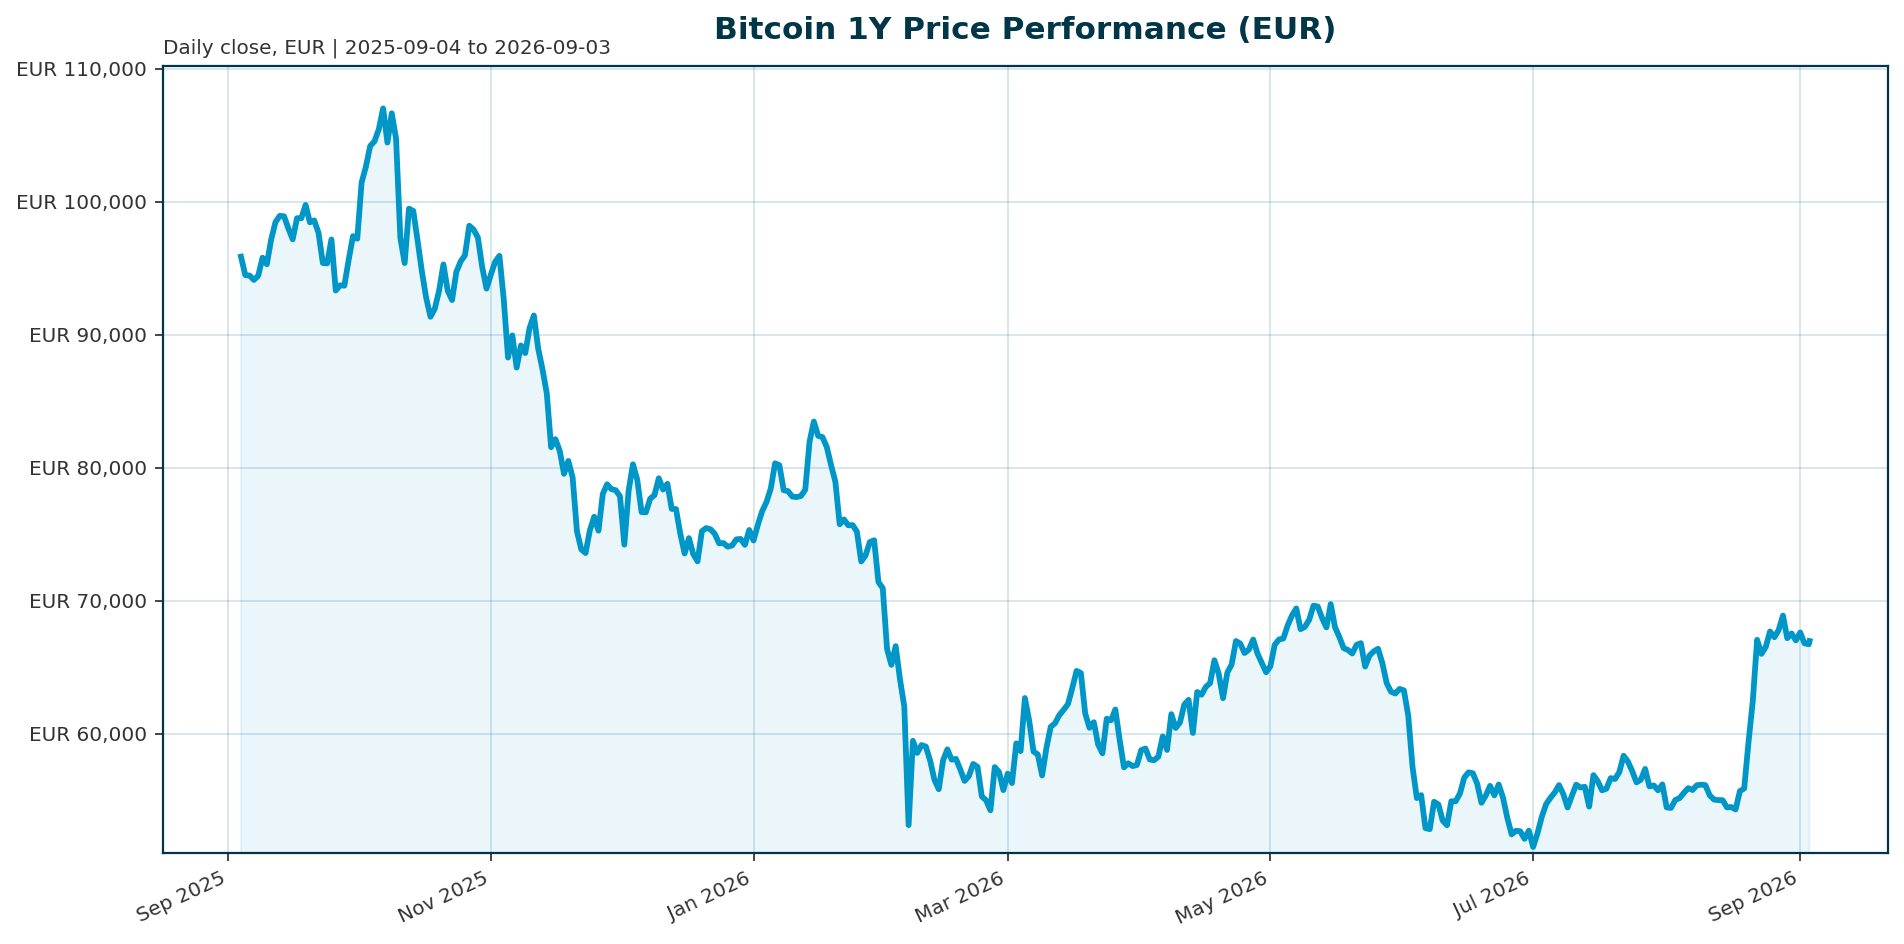
| Metric | Value |
|---|---|
| Price | 67,003 EUR |
| Market Cap | 1.35 T EUR |
| 30-Day Change | +21.8% |
| 1-Year Change | -30.2% |
| All-Time High (ATH) | 107,662 EUR (-37.8% drawdown) |
| Bitcoin Dominance | 59.09% |
| 24h Volume | 23.14 B EUR |
| Institutional Supply Era | 6.7M BTC in ETFs/exchanges/treasuries [T2] |
Market Setup
Risk sentiment is neutral to negative while Euro area yields rise to 3.36% on the 10-year, creating a headwind for non-yielding assets. The equity backdrop is mixed with DACH markets outperforming, specifically the ATX (+1.19% over 5 days), while global peers like the Nikkei 225 (-2.79%) lag. FX markets are mixed, with EUR/CHF showing strength. This macro environment suggests Bitcoin remains a liquidity barometer rather than a safe haven.
Investment Thesis
Bitcoin has transitioned into an “institutional supply era” where ETF flows serve as the primary macro indicator. The asset has evolved from a high-volatility speculative vehicle into a more stable, allocable line item for traditional finance, evidenced by a drop in volatility to approximately 43% [T2]. While the current price sits 37.8% below the ATH, the structural supply constraint of 21 million BTC provides a deflationary anchor against monetary expansion. The shift from retail speculation to institutional allocation through regulated vehicles creates a new floor for price discovery.
Bullish Drivers
Regulatory clarity and market structure reform are the primary catalysts for sustained upside. The progress on the GENIUS Act and initiatives toward 24/7 U.S. equities trading signal a maturation of the infrastructure that legitimizes digital assets [T6]. Additionally, stablecoin liquidity has hit all-time highs, providing robust on-chain rails for capital movement [T6]. If institutional vehicles regain momentum with net inflows exceeding $200 million daily, Bitcoin can reclaim higher resistance levels and break out of its current consolidation.
Relative Positioning vs Gold and Ethereum
In the current rising rate environment, Gold acts as the primary safe haven, likely outperforming Bitcoin due to its yield sensitivity. Bitcoin, conversely, remains the primary risk-on asset within the crypto complex. Ethereum shows resilience through its DeFi and smart contract utility but typically lags Bitcoin in macro-driven flows. BTC maintains its dominance as the primary liquid proxy for digital asset exposure, while ETH serves as the growth engine of the ecosystem.
Scenario Framework
- Base Case: Euro area yields stabilize or peak, and ETF flows remain flat. Bitcoin consolidates between 65,000 and 70,000 EUR, trading in a range defined by macro liquidity conditions.
- Bull Case: A pivot in Fed policy or a cut in Euro area rates triggers a risk-on rotation. Sustained ETF inflows rebound to levels seen in early 2026, pushing BTC toward the 80,000 EUR resistance zone.
- Bear Case: US Treasury yields surge further, tightening liquidity. ETF outflows accelerate, and Bitcoin tests the 60,000 EUR support level as institutional investors de-risk.
Valuation Discussion
Current market valuations reflect a discount to historical highs, offering a potential entry point for long-term holders. The market is pricing in the “institutional supply era,” where valuation is increasingly driven by discounted cash flow models of future adoption rather than speculative hype. The EV/Volume ratio suggests the asset is trading at a premium to liquidity, reflecting the premium placed on regulated access and institutional custody.
Risks
The primary risk is a macro-driven liquidity crunch. Rising US Treasury yields increase the opportunity cost of holding non-yielding assets, making Bitcoin more sensitive to rate movements [T5]. Regulatory headwinds, such as unexpected tax policy changes or crackdowns on stablecoins, could dampen institutional enthusiasm. Furthermore, while volatility has decreased, the asset remains prone to sharp corrections if the ETF channel experiences significant redemption pressure.
Appendix
Sources:
- Reflexivity Research: January 2026 in Review [T1]
- Crypto Market 2025: Year-End Review & Expert Insights [T2]
- Bitcoin Holds Near $80K–$81K as ETF Inflows Revive Bullish Sentiment [T3]
- Bitcoin and Ether ETF Inflows Rebound [T4]
- US Treasury yields surge to new highs as liquidity tightens, pushing Bitcoin back below $82,000 resistance [T5]
- Kraken sees 2026 crypto markets shifting from hype to structure as macro forces reshape bitcoin cycle [T6]
- Bitcoin Price Analysis May 2026 [T7]
- Bitcoin Tests $70,000 As Intraday Squeeze Lifts Market [T8]
Disclaimer: This report is AI-generated for informational purposes only and does not constitute investment advice. The analysis is based on data available as of the date of publication and should not be relied upon as financial guidance.
Important Note / Wichtiger Hinweis:
EN: This report may have been generated using AI. It processes data from publicly available sources. The content is provided for informational purposes only.DE: Dieser Bericht kann mithilfe von KI erstellt worden sein. Dabei werden Daten aus öffentlich zugänglichen Quellen verarbeitet. Die Inhalte dienen ausschließlich Informationszwecken.
* DE: Die ergänzenden Inhalte können KI-generiert sein. EN: The additional content may be AI-generated.