
Listen to the summary
Key Data Snapshot
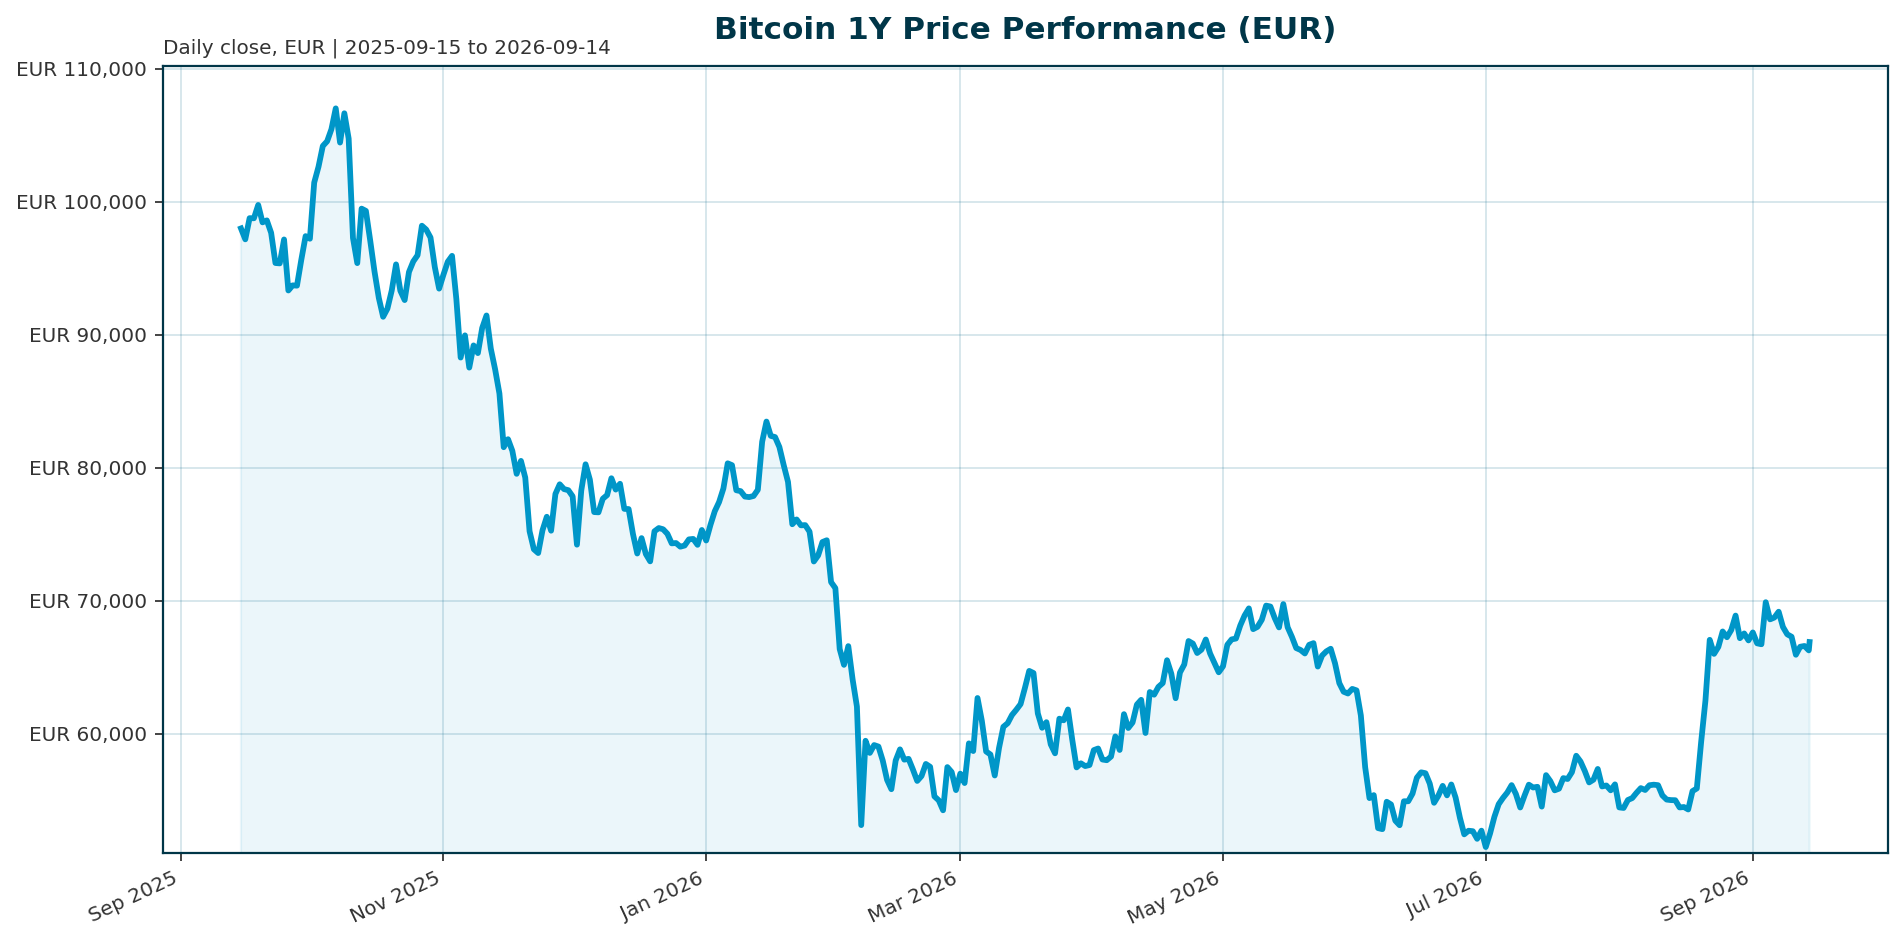
| Metric | Value |
|---|---|
| Price (EUR) | €67,040 |
| 24h Range (EUR) | €66,079 to €67,264 |
| Market Cap | €1.346T (rank 1) |
| Fully Diluted Valuation | €1.346T |
| 24h Volume | €16.75B (turnover ratio 1.24% of market cap: 16.75B / 1,346.4B) |
| Circulating Supply | 20,084,031 of 21,000,000 max (95.64%); 915,969 BTC unissued |
| Performance 24h / 7d | +0.77% / -2.90% |
| Performance 30d / 200d / 1y | +22.9% / +13.5% / -33.1% |
| All-Time High | €107,662 (2025-10-06); current discount -37.7% (calc: (67,040 – 107,662) / 107,662) |
| BTC Dominance | 58.87% of €2.283T total crypto market cap (cross-check: 1,346.4B / 2,282.5B = 59.0%) |
The profile is a post-correction recovery, not a confirmed new trend. The +22.9% 30-day move sits against a -33.1% one-year return and a price still roughly 38% below the October 2025 high.
Market Setup
Risk sentiment is neutral to negative, with moderately negative equity momentum and DACH indices broadly in line with global peers. The rates backdrop is the dominant constraint: euro area AAA yields are rising with a flattening curve. The 10Y AAA yield stands at 3.50%, up 15.7bp over five days and 55.5bp year to date, while the 2Y has climbed 99.2bp YTD to 3.10%, leaving the 10Y-2Y spread at just 40.3bp. FX is mixed: EUR/USD at 1.1611 (-0.22% over five days), EUR/CHF at 0.9448 (+0.29% five-day), EUR/JPY at 178.85 (-2.82% one-month). Equities are soft: DACH averages -0.99% over five days versus -1.56% globally, the ATX leads on one month at +2.61%, and the Nikkei is the weakest five-day performer at -2.92%. These macro variables matter to Bitcoin primarily through their effect on liquidity and ETF flows [T3][T6][T7].
For the flow regime specifically: the Fed under Chair Kevin Warsh is expected to hold rates through Q3 2026, limiting the easing tailwind that has historically supported risk-asset recoveries [T3]. Rising US Treasury yields have already pushed Bitcoin back below the $82,000 resistance zone in the recent past, with analysts flagging the higher opportunity cost of a non-yielding asset against improved government debt returns [T6]. Note on reconciliation: the current spot of €67,040 equates to roughly $77,800 at EUR/USD 1.1611, which places price near the $80,000 zone discussed in recent coverage; the USD levels in news sources should be read against this conversion [T4].
Investment Thesis
Bitcoin has completed its transition from a speculative retail asset to an allocatable institutional line item. By the end of 2025, 6.7 million BTC sat across ETFs, exchanges, and corporate treasuries, and annualized volatility had compressed from 84% to 43%, a shift Glassnode characterized as Bitcoin’s institutional supply era [T2]. In this regime, ETF flows have become Bitcoin’s de facto macro indicator: record Q4 2025 outflows coincided with the breakdown of the $98,000 support, and January 2026 flows stayed defensive at -$1.605B net [T1][T2].
The core thesis is therefore flow-led scarcity. Supply is effectively fixed (95.64% issued, declining issuance), so price discovery is dominated by marginal institutional demand expressed through regulated wrappers. The recovery into September 2026, with a +22.9% 30-day gain, suggests inflows have resumed after the Q4 2025 and January drawdowns [T4]. The bullish case requires flows to turn strategic rather than tactical; the bearish case is that flow-driven demand is reflexive and reverses with macro conditions, as the yield-driven breakdown below $82,000 demonstrated [T6][T7]. Regulatory execution is the swing factor: the CLARITY Act would establish a federal market-structure framework and could unlock sidelined institutional capital, while clearer custody and tax rules would widen participation further [T3][T8].
Bullish Drivers
- ETF channel as structural demand: Spot ETFs, treasuries, and regulated vehicles made BTC integrable into institutional workflows, turning it into a standard portfolio line item for RIAs, private banks, and asset managers [T2][T5].
- Supply constraints: Halving-cycle issuance dynamics are now augmented by institutional demand vectors; with 95.64% of max supply circulating, only 915,969 BTC remain to be issued [T5].
- Regulatory catalysts: The CLARITY Act would create a US federal market-structure framework, potentially unlocking broader institutional participation; CoinShares-style commentary sees the balance of risks improving as regulatory visibility rises [T3][T4].
- Market-structure maturation: The NYSE advanced 24/7 trading and tokenized securities plans, moving crypto closer to conventional capital-markets plumbing; ETF filing activity remained active through early 2026 [T1].
- Product innovation: Covered-call crypto ETFs, multi-asset index products, and institutional model portfolios deepen the wrapper ecosystem and could make flows more strategic and stickier [T7][T8].
- Adjacent adoption rails: Stablecoins continue to expand across payments and brokerage funding, supporting the broader on-chain infrastructure that institutional allocation relies on [T1].
Relative Positioning vs Gold and Ethereum
Versus gold: 2025 was unflattering for the store-of-value comparison. During the Q4 correction, Bitcoin lagged gold and bonds, and more than $1 trillion in crypto market value was erased [T2]. The bull argument, articulated most aggressively by Ark Invest, is that Bitcoin captures market share from gold over time as institutional adoption accelerates [T5]. If macro pressure persists, allocators with non-cyclical mandates will likely prefer gold; if the CLARITY Act passes and flows turn strategic, Bitcoin can recapture store-of-value flow share. Data gap: this bundle contains no current EUR-denominated gold price or return data, so a quantitative relative-value comparison is unavailable.
Versus Ethereum: Within crypto, Bitcoin remains the dominance anchor at 58.87% of a €2.283T market. Flow differentials show both assets drew defensive positioning in January 2026, with Bitcoin at -$1.605B versus Ethereum at -$343M; Bitcoin absorbed roughly 82% of the combined net outflow (1.605 / 1.948), indicating it bears the brunt of institutional de-risking but also leads any rotation back in [T1]. In Asia, institutional adoption skews toward tokenized real-world assets and regulated stablecoins rather than pure Bitcoin ETFs, a structural nuance for global allocators [T3]. Data gap: no current ETH market data is in the bundle, so relative performance over recent horizons cannot be quantified here.
Scenario Framework
All EUR levels convert USD targets at EUR/USD 1.1611 (spot) unless stated. Levels are conditional and illustrative, not point forecasts.
| Scenario | Triggers | Implied Path |
|---|---|---|
| Bear | Fed holds through Q3 2026, euro yields keep climbing (2Y +99bp YTD precedent), inflation surprise revives outflows akin to January’s -$1.605B and Q4 2025 record outflows [T1][T3][T6][T7] | Flow shock breaks the 30-day recovery; price revisits the 2026 support zones (USD ~$80,000 / ~€69,000 equivalent area and lower); the -33.1% one-year downtrend extends |
| Base | Flow stabilization, no CLARITY Act resolution, rates unchanged [T3][T7] | Range-bound consolidation; +22.9% 30-day momentum decays into chop around the $80,000/$82,000 USD pivots; price oscillates below the -37.7% ATH discount |
| Bull | CLARITY Act passage plus a Fed easing signal; sustained multi-week ETF inflows [T3][T4][T8] | Flow-based models converge toward $100,000-$150,000 (roughly €86,100-€129,200 at 1.1611); JPMorgan’s $150,000 Q4 2026 target implies €129,200 |
FX sensitivity on the bull range ($100,000-$150,000): at EUR/USD 1.10 the range is €90,900-€136,400; at 1.1611 it is €86,100-€129,200; at 1.20 it is €83,300-€125,000. A stronger euro reduces EUR-denominated upside. Ark Invest’s $200,000 2026 milestone translates to €172,200 at 1.1611 and should be treated as a low-confidence tail scenario [T5].
Valuation Discussion
Flow-based valuation dominates the current framework. JPMorgan’s model targets $150,000 by Q4 2026 with 72% confidence, explicitly arguing that institutional demand vectors have augmented traditional halving-cycle dynamics [T5]. These targets come from a single secondary source and unverified provenance; treat them as scenario anchors rather than consensus. Cross-checks worth applying:
- Scarcity math: FDV (€1.346T) nearly equals market cap because 95.64% of supply is already issued. Scarcity is real but no longer a supply-side catalyst; it makes valuation flow-dependent.
- Opportunity cost: With the euro area 10Y AAA yield at 3.50% and rising, a non-yielding asset must justify allocation through expected appreciation alone. Higher yields compress what allocators will pay for future scarcity, a direct valuation headwind [T6].
- Discount-to-ATH framing: The -37.7% discount to the October 2025 high compares with the -33.1% one-year return, meaning price has partially recovered from the drawdown trough but remains deep in cyclical drawdown territory.
- Volatility compression as a valuation lever: The decline from 84% to 43% annualized volatility, if sustained, mechanically raises institutional risk-budget ceilings and could support higher allocations and flow-based targets [T2]. The counter-argument: flow-based models are reflexive and fail precisely when flows reverse, as Q4 2025 showed [T2].
On-chain valuation metrics (MVRV, realized price, hash rate) are unavailable in this dataset; the valuation discussion is confined to flow-based and scarcity framings.
Risks
- Macro headwind (high severity): Rising US Treasury yields and tight liquidity are a clear headwind, raising the opportunity cost of holding BTC and making institutional buyers more selective [T6]. The Fed is expected to hold through Q3 2026, removing the easing tailwind [T3].
- Flow dependency (high severity): Allocators remain price- and macro-sensitive. Inflation surprises or Fed repricing can reverse flows quickly; April’s surge faded by May in exactly this pattern [T7].
- Historical flow-shock precedent (medium severity): Q4 2025 record outflows erased over $1 trillion in crypto market value with a roughly 30% peak-to-trough decline; January 2026 flows stayed negative [T1][T2].
- Regulatory execution risk (medium severity): The CLARITY Act is not yet passed and its outcome is uncertain; a failure or delay removes the central bull trigger [T3].
- Residual crypto volatility (medium severity): The institutional era has not eliminated old-fashioned volatility; the $80,000 USD area has not been stress-tested as a floor in a genuine liquidity squeeze [T4].
- Euro-area rates risk (medium severity, EUR-specific): The 2Y AAA yield is up 99.2bp YTD; continued euro-area yield rises drain risk appetite across DACH and global allocations and hit EUR-quoting Bitcoin holders doubly if the euro strengthens.
Appendix
Methodology and timestamps: Market data retrieved 2026-09-14T04:15 UTC (CoinGecko, EUR quote). Macro data as of 2026-09-10 (ECB yield curve), 2026-09-11 (Wiener Börse, FMP), and 2026-09-14 (Frankfurter FX). USD-to-EUR target translation uses EUR/USD 1.1611 (2026-09-14). News-derived price levels are USD-denominated and reflect earlier 2026 periods; convert at spot for comparison. All scenario levels are conditional on stated triggers and are not point forecasts.
Key calculations: Discount to ATH: (67,040 – 107,662) / 107,662 = -37.7%. Circulating ratio: 20,084,031 / 21,000,000 = 95.64%. Dominance cross-check: 1,346.4B / 2,282.5B = 59.0% (reported 58.87%). Turnover: 16.75B / 1,346.4B = 1.24%. January flow split: BTC share of combined BTC+ETH outflows = 1.605 / (1.605 + 0.343) = 82.4%.
Glossary: FDV: fully diluted valuation, price times max supply. ETF net flows: creations minus redemptions across US-listed spot funds. BTC dominance: Bitcoin market cap as a share of total crypto market cap. Euro area AAA yield: ECB AAA-rated euro area government bond zero-curve yield.
Limitations: No current EUR-denominated gold or Ethereum market data is in the bundle; relative positioning relies on flow differentials and USD-context sources. No September 2026 ETF flow data is available; the most recent hard datapoint is January 2026 (T1). The Fed stance under Chair Warsh is sourced from a July 2026 review and may have been superseded by later decisions.
Sources
- [T1] Reflexivity Research: January 2026 in Review. coinmarketcap.com
- [T2] Crypto Market 2025: Year-End Review & Expert Insights. tradingview.com
- [T3] Q2 2026 Digital Asset Review. coindesk.com
- [T4] Bitcoin Holds Near $80K-$81K as ETF Inflows Revive Bullish Sentiment. hedgeco.net
- [T5] Bitcoin Price Prediction 2026: Institutional Adoption & ETF Impact Analysis. intellectia.ai
- [T6] US Treasury yields surge to new highs as liquidity tightens, pushing Bitcoin back below $82,000 resistance. cryptoslate.com
- [T7] Bitcoin ETF Flows Lose Momentum After April Surge. hedgeco.net
- [T8] Bitcoin and Ether ETF Inflows Rebound. blockchain-council.org
This report is AI-generated and provided for informational purposes only. It does not constitute investment advice, a recommendation, or an offer to buy or sell any financial instrument. Investors should conduct their own due diligence and consult a licensed advisor before making allocation decisions.
Important Note / Wichtiger Hinweis:
EN: This report may have been generated using AI. It processes data from publicly available sources. The content is provided for informational purposes only.DE: Dieser Bericht kann mithilfe von KI erstellt worden sein. Dabei werden Daten aus öffentlich zugänglichen Quellen verarbeitet. Die Inhalte dienen ausschließlich Informationszwecken.
* DE: Die ergänzenden Inhalte können KI-generiert sein. EN: The additional content may be AI-generated.