
Listen to the summary
Key Data Snapshot
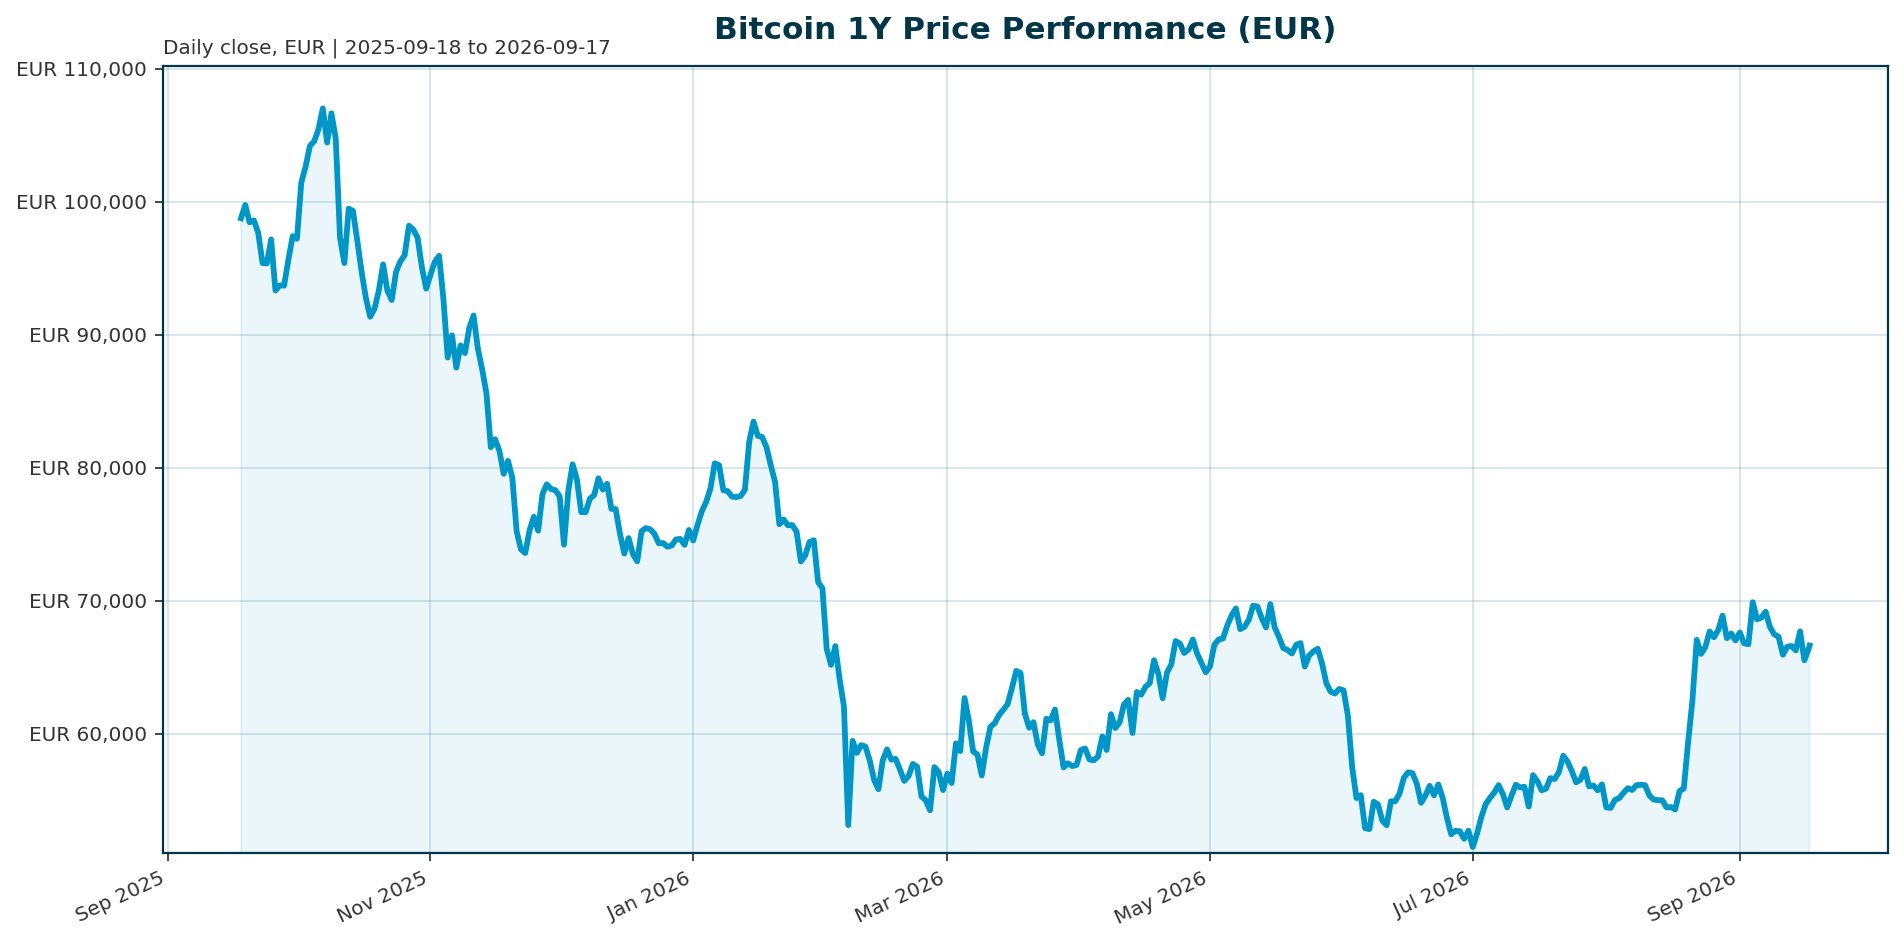
The following snapshot anchors the report. All figures are in EUR unless stated otherwise; market data was retrieved on 2026-09-17 at 04:15 UTC.
| Metric | Value | Note / Calculation |
|---|---|---|
| Price | €66,523 | Anchor quote for this report |
| 24h change | +1.27% | 1h: +0.10% |
| 7d / 14d change | -2.5% / -1.8% | Short-term momentum negative |
| 30d / 200d change | +19.3% / +12.9% | Medium-term recovery intact |
| 1y change | -34.6% | Long-term trend still negative |
| 24h range | €65,577 to €66,904 | Range width €1,327, or 1.99% of price (€1,327 / €66,523) |
| Market capitalization | €1,336.3bn | Rank #1 among crypto assets |
| 24h volume | €27.04bn | Turnover ratio: €27.04bn / €1,336.3bn = 2.02% of market cap |
| BTC dominance | 58.35% | €1,336.3bn / €2,286.6bn total crypto market cap = 58.42%, consistent with the supplied 58.35% |
| Share of crypto volume | 33.3% | €27.04bn / €81.19bn total crypto volume |
| Supply | 20,085,484 circulating | 95.6% of the 21,000,000 max supply; only 914,516 BTC remain to be issued |
| All-time high | €107,662 (2025-10-06) | Current drawdown -38.21%; recovery to ATH requires +61.8% (€107,662 / €66,523 – 1) |
| Implied USD price | ~$76,819 | €66,523 x 1.1549 (EUR/USD), context only |
The return ladder shows a clear conflict: strong 30-day momentum (+19.3%) sits against a -34.6% one-year decline. This report treats BTC as a recovery in progress, not a confirmed return to prior highs.
Market Setup
The cross-asset backdrop is a constraint rather than a tailwind. Risk sentiment is neutral to negative and equity momentum is moderately negative, with DACH equities broadly in line with global peers: DACH indicators average -0.08% over five days versus -0.43% for global indices. The DAX is the strongest five-day performer at +0.70% while the Hang Seng is the weakest at -1.26%. Euro area yields are rising with a flattening curve: the AAA 10Y yield stands at 3.54%, up 11.7 bp over five days, and the 10Y-2Y spread has compressed to 35.6 bp. FX is mixed, with EUR/USD at 1.1549, down 0.53% over five days.
For Bitcoin specifically, the macro backdrop remains the primary variable. Under new Fed Chair Kevin Warsh, the central bank is expected to hold rates through Q3, leaving limited room for the policy easing that has historically supported risk-asset recoveries [T2]. Inflation concerns, Fed policy uncertainty, energy prices, geopolitical tensions, and fiscal pressures all tie Bitcoin performance to broader liquidity conditions [T3]. Rising euro yields and a flat curve therefore cap near-term multiple expansion for a high-beta, liquidity-sensitive asset, even while crypto-specific adoption trends stay constructive. A weaker EUR/USD mechanically lifts the EUR-quoted price of a dollar-traded asset, a modest tailwind for EUR-denominated holders.
Investment Thesis
The core thesis: Bitcoin is a scarce, benchmark-status digital asset with deepening institutional access, whose EUR price path in the coming quarters is decided by regulated fund flows, global liquidity, and regulatory clarity.
On the structural side, Bitcoin dominates the asset class with a 58.35% share of crypto market capitalization and rank #1. Supply is effectively fixed: 20,085,484 of 21,000,000 BTC already circulates, so annual new issuance is less than 4.4% of the cap and declining with each halving. Institutionalization has advanced to the point where 2025 was described as Bitcoin’s “institutional supply era”, with 6.7 million BTC held across ETFs, exchanges, and treasuries by year-end, and spot ETFs, corporate treasuries, and regulated vehicles making BTC an allocatable line item for registered investment advisors, private banks, and institutions [T4]. Institutional access continues to broaden through filings and market-structure initiatives, including momentum toward 24/7 trading and tokenized securities frameworks [T1].
The balanced view: institutionalization cuts both ways. ETF flows effectively became Bitcoin’s new macro indicator, and record Q4 2025 outflows coincided with Bitcoin breaking support near $98,000 [T4]. The same plumbing that admits institutional capital also transmits institutional selling. Meanwhile, regulation could be the next major catalyst: the CLARITY Act would establish a federal market-structure framework and potentially unlock broader institutional participation if passed, but it is not yet law [T2]. The thesis therefore holds with a flow-contingent condition: at 38.2% below the €107,662 ATH, the recovery potential is large, but it requires sustained inflow evidence rather than narrative alone.
Bullish Drivers
Regulated fund flows have reaccelerated. Bitcoin ETF inflows surged to $1.92 billion in a single week in late August 2026, with BlackRock’s IBIT accounting for a significant share, pointing to a deepening institutional footprint driven by large regulated flows rather than retail speculation [T7]. Earlier in 2026, ETFs recorded approximately $467 million of net inflows on May 5 alone, the fourth consecutive day of positive flows [T6].
Supply scarcity is structural. The 21 million hard cap and 95.6% circulated status mean demand increments translate directly into price pressure on a thin float [T7].
Market structure keeps maturing. ETF filing activity remains active and initiatives toward always-on trading and tokenized access move crypto closer to familiar capital markets plumbing [T1]. Regulatory progress, on-chain infrastructure, and structural adoption continue to build even as near-term price action remains under pressure [T2].
Sentiment recovery has precedent. When ETF inflows returned earlier in 2026, they revived confidence and visible institutional demand even without supportive easy-money conditions, suggesting buyers respond to structural adoption, not just liquidity [T3].
The caveat: each of these drivers was visible in prior episodes, and each was later tested by reversal. The bullish case requires inflows to persist across several weeks, not just a strong single week.
Relative Positioning vs Gold and Ethereum
The bundle specifies gold and Ethereum as benchmarks but provides no current price, return, volatility, or valuation data for either. Quantitative comparison is therefore unavailable for this report; the positioning below is qualitative and grounded in sourced flow and regime evidence.
Versus gold: Bitcoin is the dominant crypto reserve asset; gold is the non-crypto scarcity comparator. The key regime lesson of 2025 is that Bitcoin lagged traditional assets like gold and bonds during the year-end correction, reinforcing that even an institutionalized Bitcoin remains a high-beta corner of global markets [T4]. In a neutral-to-negative risk environment with rising euro yields, gold holds the defensive edge; Bitcoin needs a positive liquidity impulse to compete.
Versus Ethereum: Both assets shared the same ETF-flow regime in 2025 and early 2026: record Q4 2025 outflows hit U.S.-listed BTC and ETH ETFs together [T4], and January 2026 spot flows were -$1.605 billion for Bitcoin ETFs and -$343 million for Ethereum ETFs [T1]. Bitcoin’s larger inflow base and deeper ETF wrapper make it the default institutional crypto allocation. However, in Asia, real-world asset tokenization and regulated stablecoins, not pure bitcoin ETF plays, are the key entry points for banks and asset managers [T2], a reminder that the programmable-infrastructure theme can absorb institutional attention if tokenization dominates the next adoption phase.
Scenario Framework
Scenario reference levels convert sourced USD levels into EUR at EUR/USD 1.1549 and are labeled as approximate historical or analyst references, not current targets.
- Base case (consolidation): BTC/EUR trades sideways in a broad range as investors wait for proof that ETF inflows are durable and macro conditions are not deteriorating. The +19.3% 30-day move cools without breaking; the 24h range (€65,577 to €66,904) serves as the immediate reference band. Probability-weighted view of this report.
- Bull case (recovery extension): A renewed multi-week ETF inflow cycle [T7], regulatory progress on the CLARITY Act [T2], and stable risk appetite extend the 30-day trend. Sourced USD reference zones translate to approximately €69,270 ($80,000 / 1.1549), €73,594 ($85,000), €77,920 ($90,000), €114,297 ($132,000), and €129,886 ($150,000) [T5][T6]. Note that sourced technical levels near $80,000 refer to an earlier market phase when BTC traded in EUR terms below current levels; they are directional markers only. A retest of the €107,662 ATH requires a further +61.8% move.
- Bear case (flow reversal): Renewed ETF outflows repeat the June 2026 pattern, when outflows crossed $2 billion and pressured Bitcoin near a key psychological zone [T8]. Combined with higher-for-longer euro and US rates and weak equities [T2], BTC/EUR retests and breaks recent support, extending the one-year downtrend of -34.6%. The prior cycle showed how quickly $1 trillion in crypto market value can disappear in a quarter [T4].
The most tangible leading indicator across all scenarios is ETF flow direction; it should be monitored weekly as the primary signal of whether institutional rotation back into digital assets has begun [T2].
Valuation Discussion
Bitcoin has no cash flows, so DCF does not apply. The applicable institutional lens is network market capitalization, relative dominance, liquidity depth, and drawdown-adjusted scarcity.
- Scale and dominance: At €1,336.3 billion market cap and 58.35% dominance, Bitcoin is the crypto benchmark asset. The recalculated share (58.42%) confirms internal consistency of the supplied data.
- Liquidity quality: 24-hour turnover of 2.02% of market cap and a 33.3% share of all crypto volume indicate deep, investable liquidity suitable for institutional sizing.
- Scarcity valuation: With 95.6% of max supply circulating, the marginal supply overhang is small. Note a data inconsistency: the supplied fully diluted valuation (€1,336.3bn) equals market cap, whereas the theoretical FDV is €66,523 x 21,000,000 = €1,396.98bn, roughly 4.5% higher. We treat the theoretical figure as the economically meaningful one and flag the dataset discrepancy.
- Drawdown as a valuation anchor: At 38.2% below ATH, Bitcoin prices in significant pessimism relative to the October 2025 peak. Analyst forecasts for 2026 range from $85,000 to $132,000, with some institutional paths toward $150,000 contingent on favorable regulation and continued adoption [T5]. In EUR terms these translate to roughly €73,600, €114,300, and €129,900 respectively; they are scenario references, not forecasts of this report.
- Risk premium evolution: Realized volatility reportedly fell from 84% to 43% as the asset institutionalized [T4], which, if sustained, supports a lower required risk premium and a higher justified allocation weight. The bear counterargument: lower volatility can also reflect shrinking speculative participation, which caps upside torque.
Risks
- ETF flow reversal: Institutional demand is no longer moving in a straight line. U.S. spot Bitcoin ETFs suffered a record outflow streak with billions leaving in a short period in mid-2026 [T8]. The burden of proof sits with bulls to show outflows slowing and buyers stepping in at lower levels [T8].
- Macro liquidity: The Fed is expected to hold rates through Q3 under Chair Warsh, limiting the policy easing that historically supported risk-asset recoveries [T2]. Rising euro yields (AAA 10Y at 3.54%, +11.7 bp over five days) and a flattening curve tighten the liquidity backdrop for EUR-based allocators.
- Regulatory uncertainty: The CLARITY Act is a potential catalyst, not a confirmed outcome [T2]. Passage failure or delay removes a priced-in hope.
- High-beta drawdown risk: Q4 2025 erased more than $1 trillion in crypto market value as Bitcoin fell nearly 30% from its peak, lagging gold and bonds [T4]. The current -34.6% one-year return confirms this risk is live, not historical.
- Competition for capital: Bitcoin must compete in a market captivated by AI and other high-growth themes [T8], and the tokenization and stablecoin themes can draw institutional attention toward Ethereum and other infrastructure plays [T2].
- Data limitations: No on-chain metrics, derivatives positioning, realized volatility, ETF AUM, or European ETP flow data were available for this report; benchmark data for gold and Ethereum is also absent. Position sizing should account for this reduced visibility.
Appendix
Methodology and Calculations
- Turnover ratio: €27,044,777,134 / €1,336,270,558,575 = 2.02%.
- Dominance check: €1,336,270,558,575 / €2,286,585,097,426.53 = 58.42%, consistent with supplied 58.35% (rounding and timestamp differences).
- Volume share: €27,044,777,134 / €81,185,962,043.73 = 33.31%.
- Supply: 21,000,000 – 20,085,484 = 914,516 BTC remaining; 20,085,484 / 21,000,000 = 95.65% circulated.
- Market cap check: €66,523 x 20,085,484 = €1,336.27bn, matching the supplied market cap. Theoretical FDV: €66,523 x 21,000,000 = €1,396.98bn; the supplied FDV equals market cap and is flagged as inconsistent (see Valuation Discussion).
- ATH recovery: €107,662 / €66,523 – 1 = +61.84%; distance to ATH: €41,139.
- Implied USD price: €66,523 x 1.1549 = ~$76,819 (context only; spot USD pricing may differ).
- USD to EUR conversions at EUR/USD 1.1549: $80,000 → €69,270; $85,000 → €73,594; $90,000 → €77,920; $132,000 → €114,297; $150,000 → €129,886.
- Euro area yield curve: 10Y 3.5437% minus 2Y 3.1878% = 35.6 bp, matching the market-overview stated spread.
- Five-day equity performance: DAX +0.70%, S&P 500 -0.53%, Nasdaq -0.40%, Hang Seng -1.26%.
Data Provenance
Report generated 2026-09-17 at 04:15 UTC. Market data retrieved 04:15:05 UTC; news retrieved 04:15:10 UTC; market-overview retrieval completed without errors. Asset: Bitcoin (BTC), quote currency EUR. Benchmark assets listed in the bundle: gold and ethereum; no current benchmark market data was provided, so relative positioning is qualitative. ETF flow figures are drawn from dated source episodes (January net -$1.605bn [T1], June outflows above $2bn [T8], August weekly inflows of $1.92bn [T7]) and should not be read as a single continuous time series. Several sources carry null publication dates, limiting chronological precision.
Sources
- [T1] Reflexivity Research: January 2026 in Review. coinmarketcap.com
- [T2] Q2 2026 Digital Asset Review. coindesk.com
- [T3] Bitcoin Holds Near $80K–$81K as ETF Inflows Revive Bullish Sentiment. hedgeco.net
- [T4] Crypto Market 2025: Year-End Review & Expert Insights. tradingview.com
- [T5] Bitcoin Price Prediction 2026: Institutional Adoption. intellectia.ai
- [T6] Bitcoin Price Analysis May 2026. intellectia.ai
- [T7] Bitcoin ETF Inflows Surge to $1.92 Billion Last Week. cryptonomist.ch
- [T8] Bitcoin Opens June Under Pressure as ETF Outflows Cross $2B. hedgeco.net
Disclaimer
This report is AI-generated and is for informational purposes only. It does not constitute investment advice, a recommendation, or an offer to buy or sell any asset. Figures may contain errors or omissions; readers should verify all data independently before making any investment decision. Past performance is not indicative of future results. Digital assets carry a high risk of capital loss.
Important Note / Wichtiger Hinweis:
EN: This report may have been generated using AI. It processes data from publicly available sources. The content is provided for informational purposes only.DE: Dieser Bericht kann mithilfe von KI erstellt worden sein. Dabei werden Daten aus öffentlich zugänglichen Quellen verarbeitet. Die Inhalte dienen ausschließlich Informationszwecken.
* DE: Die ergänzenden Inhalte können KI-generiert sein. EN: The additional content may be AI-generated.