
Listen to the summary
Key Data Snapshot
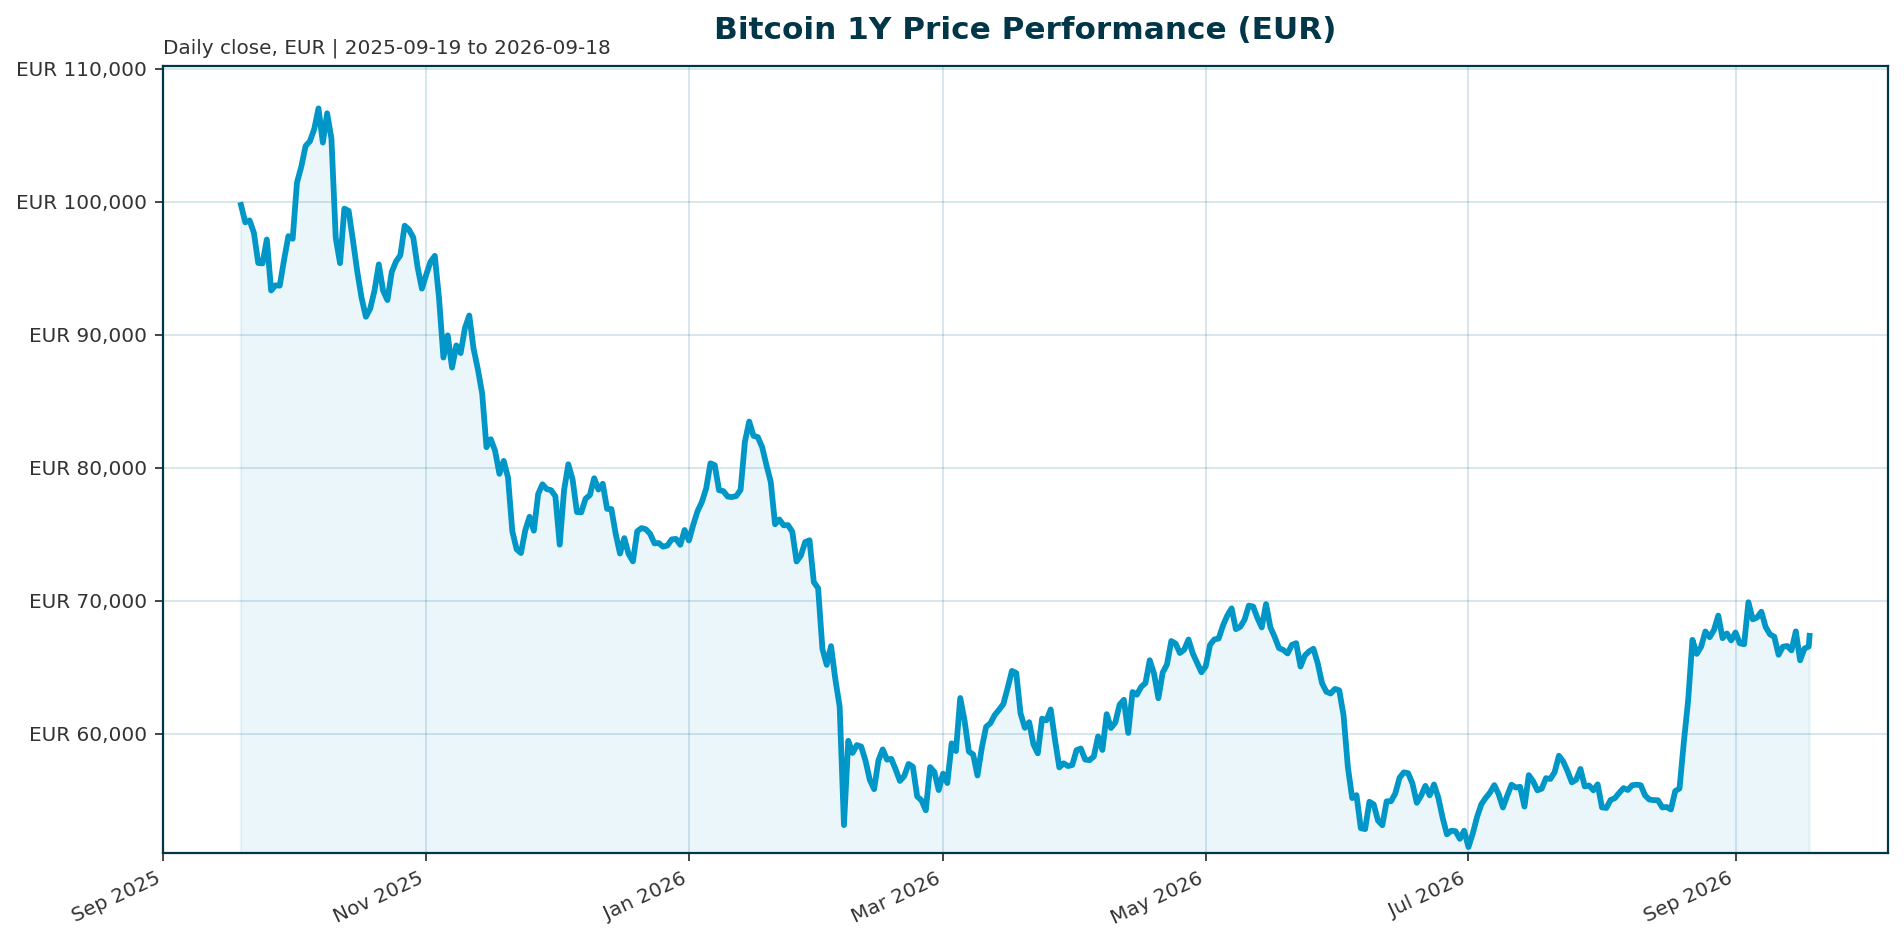
| Metric | Value | Note |
|---|---|---|
| Price | EUR 67,230 | As of 2026-09-18, 04:15 UTC |
| Market capitalization | EUR 1,350,006,619,376 | Rank 1 among cryptoassets |
| 24h volume | EUR 21,616,634,062 | Approx. 1.60% of market cap (21,616,634,062 / 1,350,006,619,376) |
| 24h range | EUR 66,117 to EUR 67,413 | Range EUR 1,296; price sits at approx. 85.9% of the range top |
| Performance 1h / 24h / 7d | +0.50% / +1.04% / +0.60% | Short-term tone positive |
| Performance 14d / 30d | -4.30% / +20.20% | Strong 30d rebound after 14d pullback |
| Performance 200d / 1y | +16.80% / -33.90% | Longer-term trend still damaged |
| All-time high | EUR 107,662 (2025-10-06) | Currently -37.55% below ATH; approx. +60.13% upside to regain it (107,662 / 67,230 – 1) |
| Circulating supply | 20,085,887 BTC | Approx. 95.65% of the 21,000,000 max supply; approx. 914,113 BTC remain to be issued |
| Fully diluted valuation | EUR 1,350,007,224,281 | FDV premium to market cap near zero; supply almost fully issued |
| BTC dominance | 58.03% | Total crypto market cap EUR 2,315,819,267,644 |
| BTC share of crypto 24h volume | Approx. 29.95% | 21,616,634,062 / 72,182,914,904 |
The snapshot shows a recovery-phase market: strong 30d and 200d momentum, but a still-negative 1y return and a 37.55% drawdown from the October 2025 peak. The 1y lens frames the current EUR 67,230 price as a rebound inside a broken trend; the 30d lens frames it as early recovery.
Market Setup
Cross-asset context is neutral rather than decisively supportive. Risk sentiment reads neutral and equity momentum is mixed: the Nikkei 225 leads on a 5-day basis at +2.91% while the Hang Seng is weakest at -0.71%, and DACH indicators average +0.14% over 5 days versus +0.57% globally, broadly in line. FX is mixed, with EUR/USD at 1.1514 after a -0.55% five-day move. The rates backdrop is unavailable in this dataset because ECB yield curve requests for euro area 2Y, 5Y, 10Y and 30Y tenors failed.
For Bitcoin, the macro backdrop remains the primary variable. Under Fed Chair Kevin Warsh, the central bank is expected to hold rates through Q3, limiting the policy easing that has historically supported risk-asset recoveries [T2]. ETF flows are the most tangible leading indicator of institutional rotation back into digital assets [T2], and performance remains tied to broader liquidity conditions amid inflation, energy prices and geopolitical tensions [T3]. Two EUR-specific implications follow: first, in a neutral-risk environment BTC trades mainly on crypto-native flow data rather than broad risk-on beta; second, persistent EUR strength versus the dollar means EUR-denominated BTC returns can diverge from the USD experience of US-based ETF holders.
Investment Thesis
The core case for Bitcoin as an institutional allocation rests on the combination of fixed scarcity and regulated access. Circulating supply stands at 20,085,887 BTC against a hard maximum of 21,000,000, with roughly 914,113 BTC left to be issued. By end-2025, an estimated 6.7 million BTC sat across ETFs, exchanges and corporate treasuries, a structure Glassnode described as Bitcoin’s institutional supply era [T1]. Spot ETFs, corporate treasuries and regulated vehicles have turned BTC into an allocatable line item for registered investment advisors, private banks and institutions [T1].
The market has also matured structurally. Reported volatility declined from 84% to 43% according to the Glassnode x Fasanara Digital Assets Report 2025, although Bitcoin remains a high-beta corner of global markets [T1]. Institutions now absorb far more daily supply than miners produce, often by multiples, making BTC a macro-sensitive reserve asset rather than a purely speculative one [T8]. The thesis therefore has a clear two-sided shape: institutionalization plus scarcity supports a structural allocation case, but returns remain hostage to capital-flow direction and macro liquidity. Regulated vehicles cut both ways; they channel inflows efficiently and transmit outflows just as fast.
Bullish Drivers
- ETF flow momentum. Crypto funds recorded a USD 3.2 billion weekly inflow, the largest since October 2025, per Bank of America data compiled from EPFR Global [T4]. Bitcoin ETFs took in nearly USD 2 billion in a single week, with roughly 70% routed through IBIT, showing institutional demand can return quickly when the macro backdrop shifts [T5].
- Sustained spot demand. Cumulative August 2026 spot Bitcoin ETF inflows were reported above USD 3 billion, including approximately USD 314 million of net inflows on August 25 and more than seven consecutive days of net inflows [T6].
- Regulatory catalyst. The CLARITY Act would establish a federal market-structure framework for digital assets and could unlock broader institutional participation if passed [T2]. Its Senate Banking Committee review was scheduled for May 2026, with passage framed as the key next unlock [T7].
- Infrastructure deepening. Fee competition among ETF providers, expanding custody and trading infrastructure, and embedding of crypto operations at major financial institutions lower implementation costs for allocators [T7].
- Supply constraint. With 95.65% of maximum supply already issued, marginal inflows have disproportionate price impact; supply remains structurally limited [T3].
- Sentiment rotation. Sentiment indicators moved decisively from fear toward greed, reflecting reasserting bullish structure as Bitcoin reclaimed the USD 80,000 level earlier in the year [T3, T6].
The bullish case is credible but conditional. It assumes inflows persist at a scale sufficient to absorb profit-taking and miner supply, and that regulatory visibility improves rather than stalls [T3].
Relative Positioning vs Gold and Ethereum
Quantitative benchmark comparison is unavailable in this dataset: no current gold or ETH/EUR price, market cap or performance data are included. Qualitative positioning can still be established.
Versus gold. Bitcoin is positioned as a scarce digital reserve asset against the established store-of-value benchmark. The 2025 experience was unfavorable: after the October peak, Bitcoin fell nearly 30% and lagged traditional assets like gold and bonds, erasing more than USD 1 trillion in market value in Q4 2025 [T1]. That episode is a reminder that even institutional-era Bitcoin behaves as high-beta risk exposure, whereas gold’s 2025 drawdown profile was materially shallower. Gold’s role as a portfolio hedge remains distinct from BTC’s asymmetric growth-and-scarcity profile.
Versus Ethereum. BTC holds clear dominance advantages: market cap rank 1, 58.03% dominance, and the deepest regulated-vehicle ecosystem. Q4 2025 record outflows hit U.S.-listed BTC and ETH ETFs simultaneously, showing both assets now share the same flow-driven regime [T1]. The structural difference is exposure type: BTC is a monetary-scarcity, ETF-led reserve asset, while ETH carries broader smart-contract and tokenization exposure. In Asia, pure bitcoin ETF plays a smaller strategic role than in North America and Europe, where tokenization of real-world assets and regulatory stablecoins serve as entry points for banks and asset managers [T2]. A relevant caution applies to the broader complex: liquidity is expected to concentrate on projects with clear adoption, making broad altcoin rallies unlikely and favoring BTC as the concentrated expression of institutional crypto demand [T8].
Scenario Framework
All scenario levels are anchored to the current EUR 67,230 spot and the EUR 107,662 ATH. These are scenarios, not forecasts.
| Scenario | Key assumptions | Reference level (EUR) | Implied move |
|---|---|---|---|
| Base: consolidation | ETF inflows continue at recent pace [T6], risk sentiment stays neutral, rates hold through Q3 [T2] | 60,000 to 75,000 | -10.7% to +11.6% |
| Bull: flow plus regulation | Sustained multi-week inflows [T4, T5], CLARITY Act progress [T2], stable risk appetite | 85,000 to 107,662 (ATH retest) | +26.4% to +60.1% |
| Bear: flow reversal | ETF outflows resume as in Q4 2025 [T1], liquidity tightens, risk-off | 50,000 to 58,000 | -25.6% to -13.7% |
| Stress: transmission shock | Rapid institutional outflows via regulated vehicles, leverage cascade, macro shock | Below 50,000 | Beyond -25.6% |
The bull case requires roughly 60% appreciation to regain the EUR ATH; that gap is the quantitative measure of how much cycle repair is still outstanding. The bear case is anchored by the observed 2025 pattern in which record ETF outflows coincided with support breaks and a near-30% peak-to-trough decline [T1]. Regime-shift research notes a USD 180,000 year-end forecast for 2026 on policy tailwinds and institutional demand [T8], and conservative analytical models project USD 85,000 to USD 118,000 during 2026 [T7]; these USD-based references cannot be directly converted to EUR targets without current FX-adjusted modeling and should be treated as directional context only.
Valuation Discussion
Bitcoin has no cash-flow metric in this dataset, so valuation must be framed through network value, scarcity, flow absorption and relative market capitalization.
Scarcity premium. With 95.65% of maximum supply issued and only about 914,113 BTC left, fully diluted valuation (EUR 1,350,007,224,281) sits essentially at parity with market cap (EUR 1,350,006,619,376), a premium near zero. Future issuance adds negligible dilution. This supports the argument that marginal ETF demand has outsized price impact, because float available for sale is the binding constraint rather than new supply.
Flow-led valuation. In the current regime, ETF flows function as Bitcoin’s macro indicator [T1] and the leading signal of institutional rotation [T2]. Valuation therefore tracks the marginal buyer: sustained inflows justify higher network value, while outflow episodes mechanically compress it, as the Q4 2025 episode demonstrated [T1].
ATH as reference, not fair value. The EUR 107,662 ATH is a relevant sentiment anchor but not a fair-value estimate without renewed flow confirmation. A mean-reversion case toward the ATH requires evidence that inflows are broadening beyond the recent weekly spikes.
De-rating risk. If Bitcoin continues to trade as high-beta risk exposure under restrictive policy [T2], its valuation multiple versus scarcity metrics compresses. The reported halving of volatility from 84% to 43% [T1] argues for a structurally higher allocation multiple over time, but that shift is gradual and not yet fully priced in either direction.
Risks
- Flow dependence. The balance of risks remains highly dependent on ETF flows and macro conditions; inflows cushion declines but do not fully offset macro pressure, profit-taking and derivatives liquidations [T3, T6]. Flows have been choppy since the October 2025 peak, with periodic outflows on profit-taking and monetary policy uncertainty [T4].
- Macro tightening. The Fed is expected to hold rates through Q3 under Chair Warsh, limiting easing support for risk assets [T2]. Inflation, energy prices, geopolitical tensions and fiscal pressures all weigh on liquidity-sensitive assets [T3]. Euro area rates data are unavailable in this dataset, so EUR rates risk cannot be quantified here.
- Regulatory disappointment. The CLARITY Act is a potential catalyst, not a certainty; delay or dilution would remove a key institutional-allocation trigger [T2, T7].
- High-beta drawdowns. Even in the institutional era, Bitcoin remains a high-beta corner of global markets [T1]. Q4 2025 erased more than USD 1 trillion in market value on a near-30% decline [T1].
- Positioning and leverage. A rapid fear-to-greed sentiment shift supports momentum but leaves the market vulnerable to profit-taking if price fails to break resistance [T6]. No derivatives data (open interest, funding, basis) are provided, limiting visibility on leverage build-up.
- Transmission risk. Regulated vehicles amplify both directions; record Q4 2025 outflows coincided with the break of USD 98,000 support and a retest of the low USD 90,000 range [T1].
- Data limitations. No on-chain metrics, volatility time series or benchmark (gold, ETH) market data are included in this bundle; quantitative benchmarking and market-structure depth are correspondingly constrained.
Appendix
Calculations
- 24h range: 67,413 – 66,117 = EUR 1,296.
- Position in 24h range: (67,230 – 66,117) / (67,413 – 66,117) = approx. 85.9%.
- Volume turnover: 21,616,634,062 / 1,350,006,619,376 = approx. 1.60%.
- Upside to ATH: 107,662 / 67,230 – 1 = approx. +60.13%; reported ATH drawdown -37.55% reconciles (1 – 1/1.6013).
- Circulating vs max supply: 20,085,887 / 21,000,000 = approx. 95.65%; remaining 914,113 BTC, approx. 4.35% of max.
- BTC share of total crypto volume: 21,616,634,062 / 72,182,914,904 = approx. 29.95%.
- FDV premium: 1,350,007,224,281 / 1,350,006,619,376 – 1 = approx. 0.0000045%, effectively zero.
- Validation check: market cap / total crypto market cap = 1,350,006,619,376 / 2,315,819,267,644 = approx. 58.29%, close to but not identical with the stated dominance of 58.03%, reflecting provider methodology differences in circulating-supply conventions.
Data Notes and Gaps
- Rates backdrop: unavailable. ECB yield curve requests for euro area 2Y, 5Y, 10Y and 30Y failed (including HTTP 504 errors), so no euro rates analysis is possible from this bundle.
- Benchmark data: gold and ethereum are specified benchmarks, but no current price or market cap data for either asset is included; the relative-positioning section is therefore qualitative only.
- Currency mixing: cited ETF flow figures and price levels are USD-denominated from narrative sources; they are reported as such and are not converted into EUR targets.
- Source recency: Tavily publication dates are null; recency cannot be independently verified beyond bundle retrieval on 2026-09-18.
- On-chain and derivatives metrics (exchange balances, realized cap, funding, open interest) are not provided in the bundle.
Data Provenance
- Report asset: Bitcoin (BTC), quoted in EUR. Bundle generated 2026-09-18T04:16:51Z.
- Market data retrieved 2026-09-18T04:15:15Z; market overview retrieved between 04:15:21Z and 04:16:51Z.
- News query: “Bitcoin institutional adoption ETFs fund flows regulation macro backdrop market structure.”
Sources
- [T1] Crypto Market 2025: Year-End Review & Expert Insights, TradingView: link
- [T2] Q2 2026 Digital Asset Review, CoinDesk Indices: link
- [T3] Bitcoin Holds Near $80K-$81K as ETF Inflows Revive Bullish Sentiment, HedgeCo: link
- [T4] Crypto funds see $3.2B weekly inflow, biggest since October 2025, CryptoRank: link
- [T5] Bitcoin ETFs attract $2 billion in inflows, Charles-Henry Monchau, LinkedIn: link
- [T6] Bitcoin (BTC) Daily Market Analysis, 27 August 2026, CoinStats: link
- [T7] Bitcoin Price Prediction 2026, Intellectia: link
- [T8] The Retail vs. Institutional Divide, Blockhead: link
Disclaimer: This report is AI-generated and for informational purposes only. It does not constitute investment advice, a recommendation, or an offer to buy or sell any security or asset. Data may be incomplete or subject to revision; readers should conduct their own due diligence and consult a licensed advisor before making investment decisions.
Important Note / Wichtiger Hinweis:
EN: This report may have been generated using AI. It processes data from publicly available sources. The content is provided for informational purposes only.DE: Dieser Bericht kann mithilfe von KI erstellt worden sein. Dabei werden Daten aus öffentlich zugänglichen Quellen verarbeitet. Die Inhalte dienen ausschließlich Informationszwecken.
* DE: Die ergänzenden Inhalte können KI-generiert sein. EN: The additional content may be AI-generated.