
Listen to the summary
Key Data Snapshot
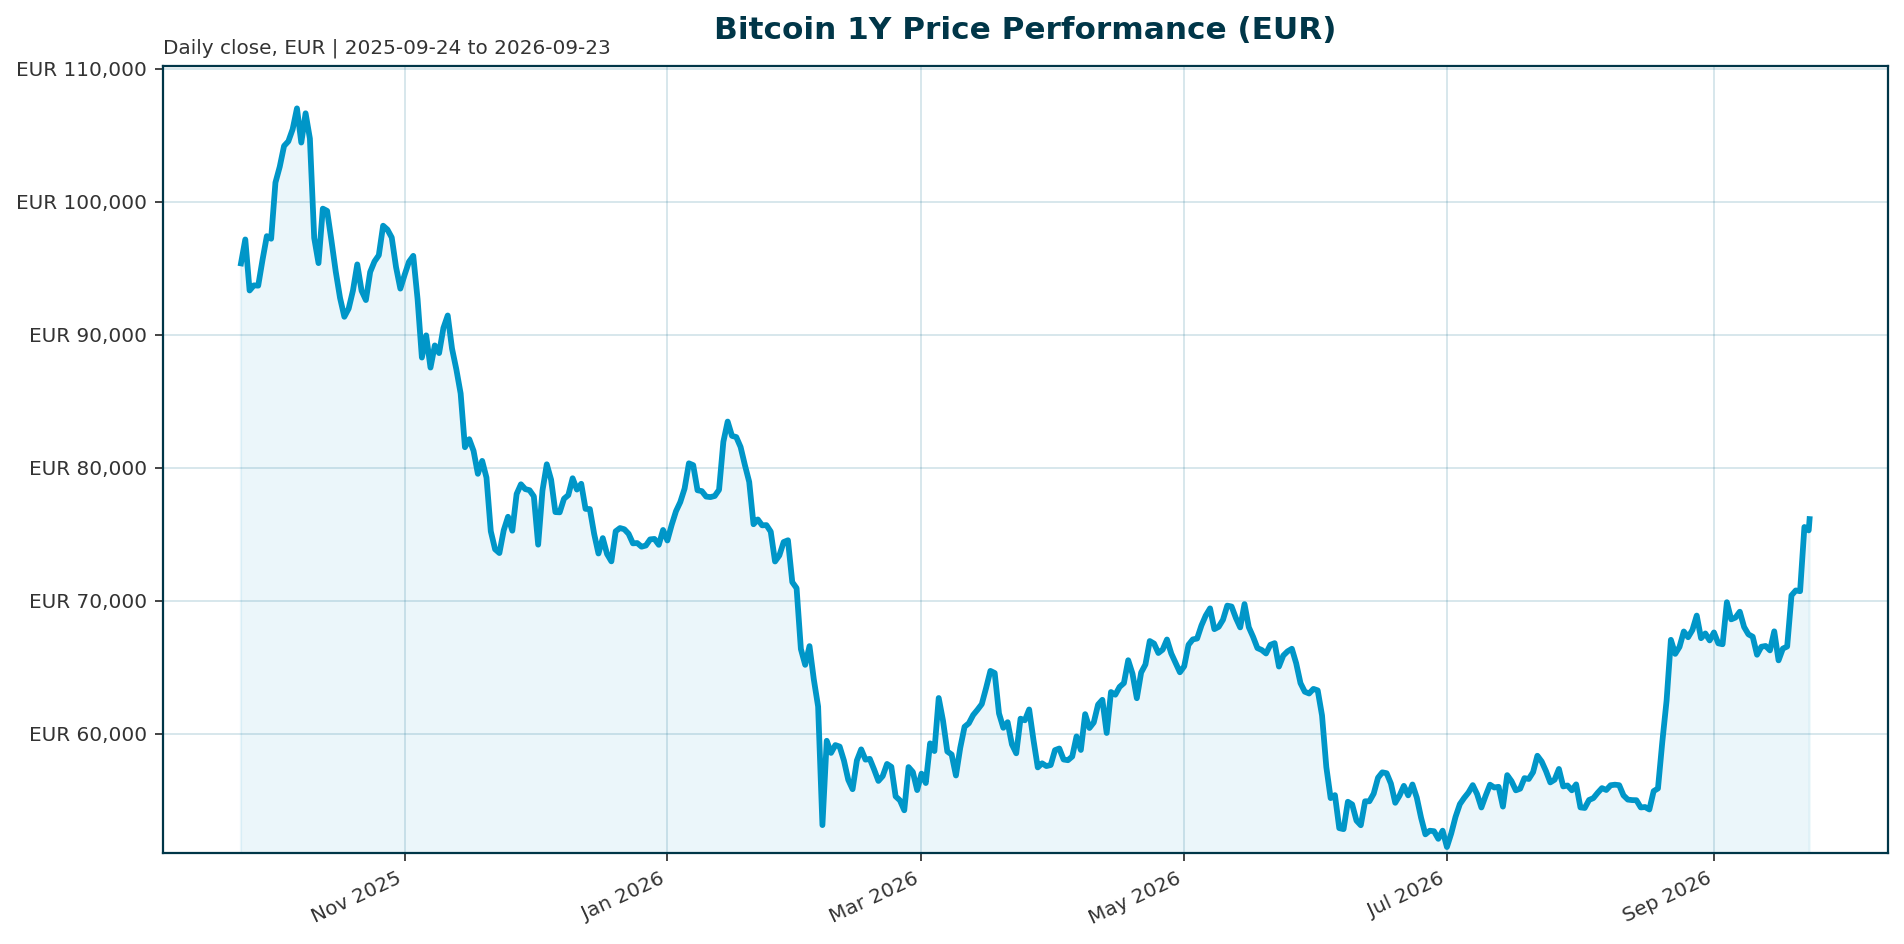
| Metric | Value |
|---|---|
| Price (EUR) | 75,990 |
| 24h High / Low (EUR) | 76,044 / 74,485 |
| 24h Change | +1.83% |
| 1h Change | +0.25% |
| 7d Change | +14.34% |
| 14d Change | +10.14% |
| 30d Change | +11.94% |
| 200d Change | +26.77% |
| 1y Change | -22.48% |
| Market Cap (EUR) | 1,526.3bn |
| Market Cap Rank | #1 |
| 24h Volume (EUR) | 36.53bn |
| Volume / Market Cap (24h) | 2.39% |
| Circulating Supply | 20,088,034 BTC |
| Max Supply | 21,000,000 BTC |
| Supply Mined | 95.66% (20,088,034 / 21,000,000) |
| Fully Diluted Valuation (EUR) | 1,526.2bn |
| BTC Dominance | 58.70% |
| Total Crypto Market Cap (EUR) | 2,594.2bn |
| All-Time High (EUR) | 107,662 (2025-10-06); current price -29.42% below |
| All-Time Low (EUR) | 51.30 (2013-07-04) |
Recovery required to regain the ATH: (107,662 − 75,990) / 75,990 = +41.68%. Implied USD price at EUR/USD 1.1480: 75,990 × 1.1480 = approx. USD 87,237. Circulating supply exceeds max-supply-minus-small-delta by only 131 BTC against total supply, confirming no meaningful unlocked-but-uncirculating overhang. Data retrieved 2026-09-23T04:15Z.
Market Setup
The cross-asset backdrop is neutral to positive but uneven. Risk sentiment is neutral_to_positive with mixed equity momentum: the Nasdaq Composite leads global equities over five days at +4.87% (27,244), the S&P 500 adds +2.82% (77,665, +13.43% YTD), while DACH lags, averaging +1.15% over five days versus +2.80% globally. The DAX is the weakest five-day performer at +0.68% (25,575, -2.15% over one month), while the ATX posts +4.35% on a one-month basis and +30.19% YTD. Euro rates are mixed: the euro area AAA 10Y yield stands at 3.47%, down 7.0 bp over five days, but up 52.6 bp YTD, and the 10Y-2Y spread sits at 32.6 bp after a 103.9 bp YTD rise in the 2Y. FX is mixed: EUR/USD at 1.1480 (-0.10% over five days, -2.31% YTD) is stable to slightly weaker, which amplifies EUR-quoted BTC gains when USD-denominated BTC strength persists; EUR/JPY shows the strongest five-day FX move at +0.21%.
The primary macro variable for digital assets remains Federal Reserve policy. Under Chair Kevin Warsh, the Fed is expected to hold rates through the current quarter, leaving limited room for the policy easing that has historically supported risk-asset recoveries [T2]. The five-day easing in euro yields provides a modest liquidity tailwind, but the YTD rise in euro yields keeps the discount-rate headwind intact.
Investment Thesis
Bitcoin has transitioned into an ETF-led, institutionally owned macro asset. ETF flows have replaced traditional cycle indicators as the primary signal: record Q4 2025 outflows from US-listed BTC and ETH ETFs coincided with the break of USD 98,000 support and a retest of the low USD 90,000s, underscoring how tightly price action now tracks regulated capital movement [T1]. Institutional ownership is structurally deep, with 6.7 million BTC held across ETFs, exchanges, and treasuries at end-2025, a phase Glassnode termed the “institutional supply era” [T1]. Realized volatility compressed from 84% to 43%, consistent with maturation toward a more stable, institutional asset profile [T1].
The current rebound, +14.34% over seven days to EUR 75,990, is flow-driven. Late-August 2026 weekly Bitcoin ETF inflows reached USD 1.92bn, dominated by BlackRock’s IBIT, and stood out against relatively low broader crypto volumes, suggesting positioning ahead of upside rather than reaction to it [T6]. The next liquidity test is the US Treasury’s bond buyback program beginning in September, which will determine whether flow-driven demand holds up [T6]. Regulation is the second catalyst: the CLARITY Act would establish a federal market-structure framework and potentially unlock broader institutional participation if passed [T2].
The thesis is therefore conditional, not unconditional. The base case is that ETF inflows hold through September, BTC consolidates the EUR 76,000 area, and works toward reclaiming prior supply zones supported by structural scarcity. The bullish case requires flows plus regulation plus macro softening to align. The bearish case is that flows stall or reverse as they did in Q4 2025 and again in June 2026, when outflows crossed USD 2bn, leaving BTC to retest lower support with no offsetting retail bid [T7].
Bullish Drivers
- Flow momentum. Late-August 2026 weekly Bitcoin ETF inflows of USD 1.92bn, with IBIT dominant, against low broader crypto trading volumes, indicate institutional positioning ahead of potential upside [T6].
- Demand exceeds issuance. In recent weeks, large buyers have absorbed two to three times more Bitcoin than miners create, creating genuine scarcity pressure [T8].
- Supply scarcity. 95.66% of the 21 million cap is mined; annual dilution is under 4.5%. Corporate treasuries increasingly treat BTC as a strategic reserve asset [T3].
- Sustained flow base. Daily ETF inflows consistently exceeded USD 400m in the 2026 adoption narrative [T3], with USD 467m net inflow on May 5 alone, the fourth consecutive positive day [T5].
- Sell-side targets. Standard Chartered and JPMorgan see steady annual inflows of USD 10-15bn pushing BTC toward USD 150,000; Citigroup’s base case is around USD 143,000 with a USD 189,000 bull case [T8].
- Regulatory catalysts. The CLARITY Act [T2], plus pending custody, market-structure, and tax clarity, could widen participation among sidelined institutions [T4]. Hong Kong’s Stablecoins Ordinance and Asian tokenization deployment signal structural adoption adjacent to BTC [T2].
Balance note: each driver has a mirror risk. Sustained multi-week inflows support rallies, especially with weak futures-driven liquidity, but if flows stall, BTC may need another catalyst [T4]. If the Treasury buyback’s liquidity impact disappoints in September, flow-driven demand could pause [T6].
Relative Positioning vs Gold and Ethereum
Vs Gold. During the 2025 correction, Bitcoin lagged traditional assets including gold and bonds, reinforcing its high-beta profile even in a more institutional era [T1]. Volatility compression from 84% to 43% narrows the risk gap with gold but leaves BTC materially more volatile [T1]. The constructive framing is asymmetric complementarity: gold won 2025 defensively; BTC offers rebound beta with a maturing volatility profile and a distinct correlation. The risk framing is that BTC underperforms gold and bonds precisely in macro-stress episodes, as late 2025 demonstrated. No direct gold price data is present in the bundle, so this comparison remains qualitative.
Vs Ethereum. Bitcoin and Ether ETF inflows rebound together, and ETH is increasingly bundled with BTC in flow narratives and multi-asset crypto index products [T4]. BTC retains the dominant institutional wrapper, with IBIT leading flows [T6], and the cleaner scarcity story via the fixed 21 million cap. ETH competes through tokenization and stablecoin utility narratives; notably, in Asia, pure bitcoin ETFs play a smaller strategic role than in North America and Europe, where tokenization and stablecoins are the institutional entry points [T2]. BTC dominance of 58.70% within the EUR 2.59trn total crypto market cap confirms capital concentration in Bitcoin relative to ETH and other assets. No direct ETH price data is in the bundle; positioning is assessed qualitatively via flow behavior.
Scenario Framework
| Scenario | Triggers | BTC Path |
|---|---|---|
| Bull | Sustained positive ETF flow streaks over 30 trading days [T4]; CLARITY Act progress [T2]; Fed softening; BTC reclaiming key supply zones [T8] | Path toward analyst targets in the USD 100,000-150,000 band, roughly EUR 87,000-131,000 at 1.1480; EUR terms amplified by current FX |
| Base | Fed holds through Q3 [T2]; flows choppy but net-positive; momentum +11.94% 30d persists | Consolidation in the USD 74,000-77,000 zone (April 2026 range [T8]); BTC ranges between recovery momentum and discount-rate headwinds |
| Bear | Renewed record outflow streaks (Q4 2025 precedent [T1]; June 2026 USD 2bn+ outflows [T7]); hawkish Fed; sticky oil-driven inflation; US-Israel-Iran geopolitical tension [T8] | Repeat of the Q4 2025 pattern: nearly 30% peak-to-trough, more than USD 1trn in crypto market value erased; BTC retests breakdown levels [T1] |
Technical reference levels, dated earlier in 2026 and in USD: USD 80,000 critical support and USD 85,000-90,000 resistance [T5], roughly EUR 69,700 and EUR 74,100-78,400 at 1.1480; the USD 98,000 prior breakdown [T1] is roughly EUR 85,400. These are historical reference levels, not live ones. Halving-based cycle timing is becoming less reliable, as BTC now reacts more to macro liquidity, ETF flows, and institutional behavior [T8].
Valuation Discussion
Bitcoin has no cash flows, so valuation is scenario analysis anchored to scarcity, flows, and drawdown position, not DCF.
- Drawdown position. EUR 75,990 is 70.6% of the EUR 107,662 ATH, a -29.42% drawdown. The 1-year return of -22.48% confirms no mean reversion has yet occurred; this is a rebound within a drawdown, not a confirmed new uptrend.
- Scarcity math. FDV of EUR 1,526.2bn essentially equals market cap. 95.66% of supply is circulating; future dilution is under 4.5%. The valuation argument rests on demand absorption of 2-3x miner issuance [T8] against a fixed float.
- Flow-based valuation. At USD 10-15bn annual inflows versus sub-4.5% remaining dilution, the flow/float imbalance supports sell-side targets of USD 143,000-150,000, roughly EUR 124,600-130,700 at 1.1480 [T8].
- Cross-check. The implied USD price of approx. 87,237 sits within the conservative platform range of USD 85,000-132,000 [T3] but below Citi’s USD 143,000 base case and the SC/JPM USD 150,000 path [T8]. No obvious overvaluation; momentum may already price the near-term recovery.
- Volatility-adjusted framing. At 43% realized volatility versus a prior 84% [T1], risk-adjusted attractiveness has improved for portfolio allocation, though BTC remains high-beta versus gold and bonds.
- Bear valuation. If ETF demand proves cyclical rather than structural, as the June 2026 outflow episode suggests is possible [T7], fair-value anchors retreat toward pre-institutional-era support and the -29.4% drawdown could extend.
Risks
- Macro. The Fed under Chair Warsh is expected to hold rates through the current quarter, limiting policy easing [T2]. A hawkish Fed and sticky oil-driven inflation are named as top risks [T8].
- Geopolitical. Prolonged US-Israel-Iran tensions fueling inflation [T8].
- Flow risk. Record ETF outflow streaks occurred in Q4 2025 [T1] and June 2026, when outflows crossed USD 2bn [T7]. The September Treasury buyback program is an untested liquidity variable [T6].
- Competitive capital rotation. BTC competes for capital against AI and other high-growth themes [T7]. In Asia, BTC ETFs play a smaller strategic role versus tokenization and stablecoin entry points [T2].
- Halving signal decay. Traditional cycle timing is less reliable; macro liquidity and flows dominate [T8].
- High-beta drawdown precedent. Q4 2025 erased more than USD 1trn in crypto market value with BTC down nearly 30% from peak [T1].
- Regulatory execution risk. The CLARITY Act is potential, not passed [T2]; custody, market-structure, and tax clarity remain pending for sidelined institutions [T4].
Compounding scenario: a hawkish Fed, flow reversal, and geopolitical shock together would repeat the correlated-deleveraging pattern of Q4 2025. Contained scenario: risks materialize individually and BTC absorbs them within the range set by flow momentum.
Appendix
Sources
- [T1] “Crypto Market 2025: Year-End Review & Expert Insights” – tradingview.com
- [T2] “Q2 2026 Digital Asset Review” – coindesk.com
- [T3] “Bitcoin Price Prediction 2026: Institutional Adoption” – intellectia.ai
- [T4] “Bitcoin and Ether ETF Inflows Rebound” – blockchain-council.org
- [T5] “Bitcoin Price Analysis May 2026” – intellectia.ai
- [T6] “Bitcoin ETF Inflows Surge to $1.92 Billion Last Week” – cryptonomist.ch
- [T7] “Bitcoin Opens June Under Pressure as ETF Outflows Cross $2B” – hedgeco.net
- [T8] “Will Bitcoin Hit $100K in 2026?” – bitcoinfoundation.org
Methodology and Data Notes
Market data retrieved 2026-09-23T04:15Z; bundle generated 2026-09-23T04:15:28Z. Quote currency is EUR. Benchmark assets are gold and ethereum; no direct price data for either is present in the bundle, so the Relative Positioning section is qualitative, drawing on [T1], [T2], and [T4].
Currency conversion. All news-source prices and targets are USD-denominated while the report quotes EUR. Conversions use the single spot rate EUR/USD 1.1480 with no forward FX adjustment; this is an explicit methodological assumption. Key conversions at 1.1480: USD 80,000 ≈ EUR 69,700; USD 85,000 ≈ EUR 74,080; USD 90,000 ≈ EUR 78,400; USD 98,000 ≈ EUR 85,370; USD 100,000 ≈ EUR 87,110; USD 143,000 ≈ EUR 124,560; USD 150,000 ≈ EUR 130,660; USD 189,000 ≈ EUR 164,570.
Data vintage caveats. Technical levels from [T5] and [T1] date from earlier in 2026 and may be stale relative to the current EUR 75,990 price. Analyst targets from [T8] are April 2026-dated; no more recent revisions are available in this bundle. Fed policy claims rest on a July 2026 CoinDesk review; the Q3 window is nearly closed as of publication, so the hold expectation is framed as extending into Q4 with appropriate caveat.
Unit inconsistencies. The total crypto 24h volume figure (104.46bn) appears USD-denominated in the source bundle despite the EUR quote currency; it is presented as approximate. The market cap 24h change of +1.41% sits slightly below the price change of +1.83%, a minor supply and rounding discrepancy. Claims from lower-authority blog sources, such as “94% of institutional investors” and “daily inflows exceeding USD 400m” [T3], are treated as unverified secondary claims. ETF flow data is episodic across sources; scenario triggers reference flow direction rather than precise magnitudes.
Return windows. The 1-year return of -22.48% compares the EUR price to its level 365 days ago, not to the ATH; the -29.42% figure measures the drawdown from the 2025-10-06 ATH. The +0.25% 1h change is tactical color only and is not extrapolated.
Disclaimer
This report is AI-generated and provided for informational purposes only. It does not constitute investment advice, a recommendation, or an offer to buy or sell any financial instrument. Readers should conduct their own research and consult a licensed financial advisor before making investment decisions.
Important Note / Wichtiger Hinweis:
EN: This report may have been generated using AI. It processes data from publicly available sources. The content is provided for informational purposes only.DE: Dieser Bericht kann mithilfe von KI erstellt worden sein. Dabei werden Daten aus öffentlich zugänglichen Quellen verarbeitet. Die Inhalte dienen ausschließlich Informationszwecken.
* DE: Die ergänzenden Inhalte können KI-generiert sein. EN: The additional content may be AI-generated.