
The altii-BTC-Report: Bitcoin in EUR
As of: 7 October 2026. Quote currency: EUR.
Watch the video
This player shows only the Bitcoin chapter of the daily altii market briefing. Watch the full video on tube.altii.de.
Key Data Snapshot
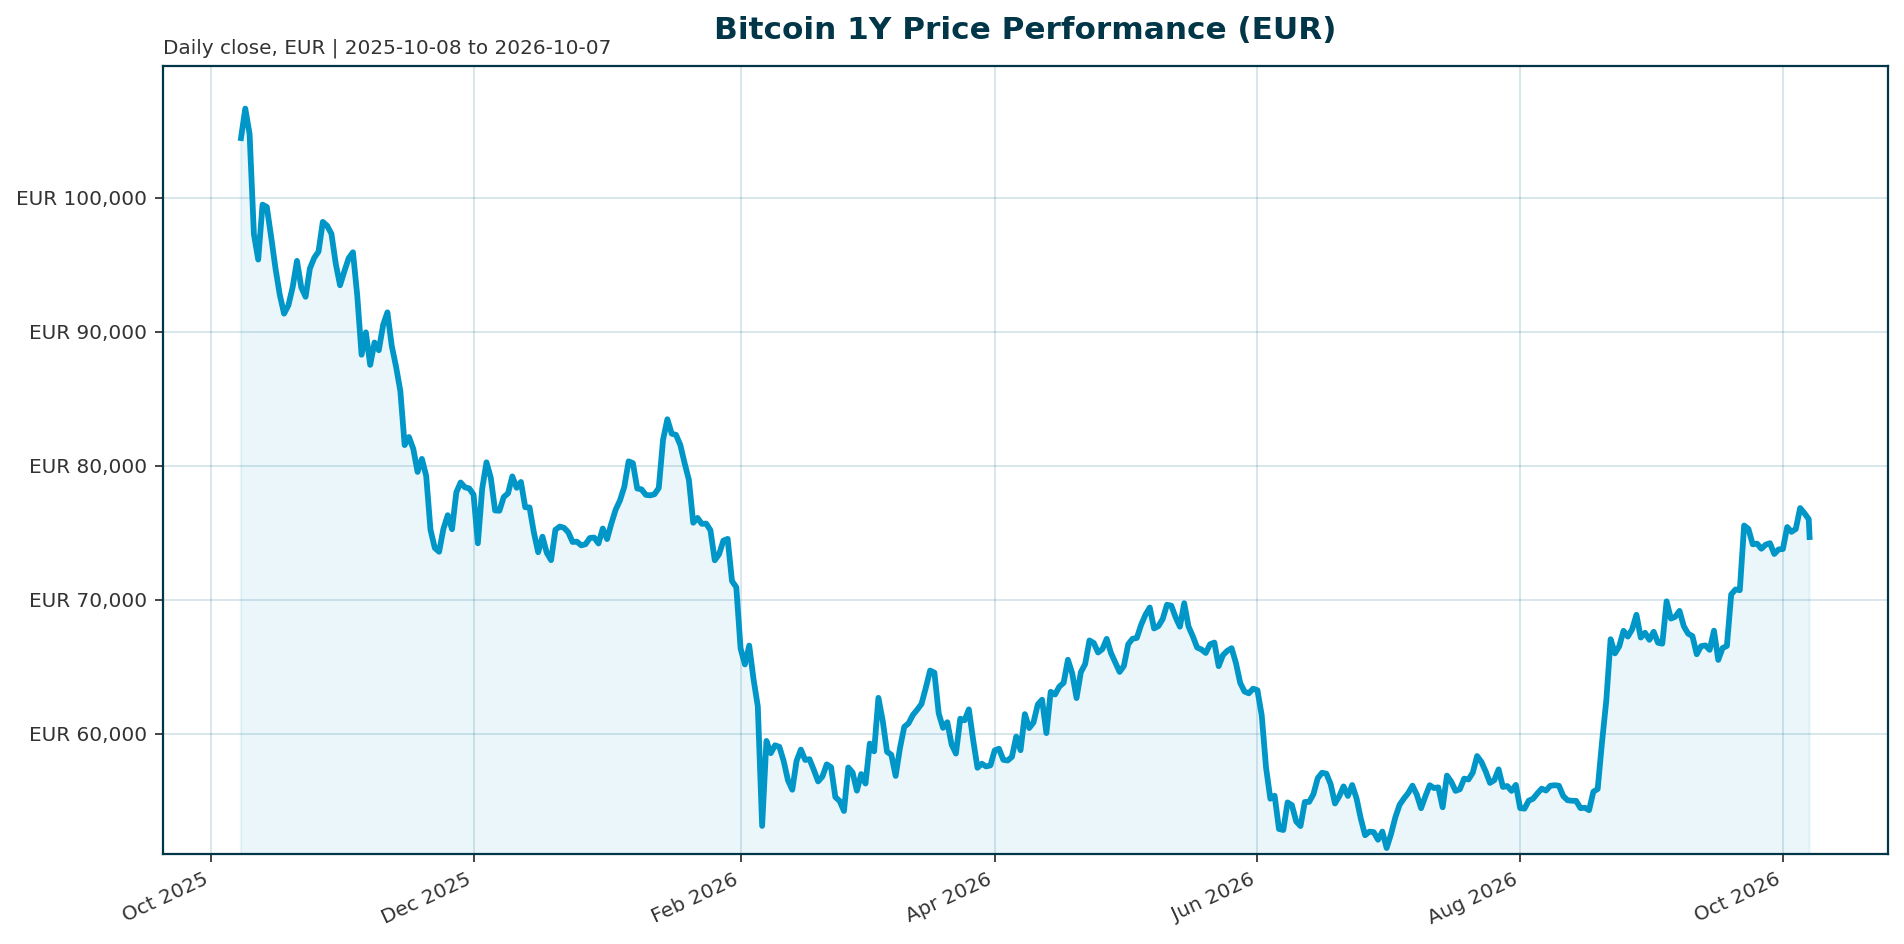
| Metric | Value | Interpretation |
|---|---|---|
| Price | EUR 74,861 | Down 1.88% over 24h, up 5.37% over 30d |
| 24h range | EUR 74,433 to EUR 77,102 | Current price is near the lower end: (74,861 – 74,433) / (77,102 – 74,433) = 16.0% |
| Performance | 1h +0.34%, 7d +0.94%, 14d -2.76%, 30d +5.37%, 200d +18.99%, 1y -32.35% | Short-term stabilization, but still a deep 1-year drawdown |
| Market cap | EUR 1,504.25bn | Rank 1 crypto asset |
| FDV | EUR 1,504.26bn | FDV is almost equal to market cap, indicating minimal remaining issuance dilution |
| 24h volume | EUR 27.80bn | Daily turnover: 27.80 / 1,504.25 = 1.85% of market cap |
| Supply | 20,094,475 circulating / 21,000,000 max | 20,094,475 / 21,000,000 = 95.69% issued |
| All-time high | EUR 107,662 on 6 October 2025 | Drawdown: (74,861 – 107,662) / 107,662 = -30.47% |
| BTC dominance | 58.79% | BTC remains the core allocation vehicle in crypto |
| Total crypto market | EUR 2,556.36bn market cap, EUR 79.25bn 24h volume | BTC market cap / total crypto market cap = 58.85%, close to reported dominance after timing and rounding |
Market Setup
Bitcoin trades in a mixed but not hostile macro setup. The broader market overview shows neutral risk sentiment, mixed equity momentum, and DACH underperformance versus global equities. The Nasdaq Composite has the strongest 5-day move at +2.75%, while DACH indicators average only +0.03% over 5 days versus +1.17% for global equity indicators. Euro rates are falling with curve steepening: the euro area AAA 10Y yield is 3.50%, down 10.6 bp over 5 days, while the 10Y-2Y spread is 50.5 bp. FX is mixed: EUR/USD is 1.1239, down 0.40% over 5 days and 3.25% over 1 month.
For BTC, this is a two-sided setup. Falling euro yields give a modest liquidity tailwind to European investors, but neutral risk sentiment limits directional conviction. The key macro risk remains the global rates channel. Reports of higher US Treasury yields and tightening liquidity have made institutional buyers more selective because government debt offers a stronger return profile [T2]. Bitcoin also increasingly trades like a macro-liquidity asset, reacting to ETF flows, Treasury operations, regulation, and financial conditions, not only crypto-native positioning [T5].
The EUR lens matters. A weaker EUR/USD can mechanically lift USD-denominated crypto values when translated into EUR, but it can also signal tighter global dollar conditions. The net effect is therefore not automatically bullish.
Investment Thesis
Bitcoin’s institutional thesis remains intact, but its timing has become more flow-dependent. BTC is no longer driven only by retail cycles, exchange leverage, and halving narratives. The market has moved into an institutional supply regime in which ETFs, treasuries, custody channels, and regulated investment vehicles increasingly set marginal demand.
Glassnode data cited in market commentary indicate that 6.7 million BTC sat across ETFs, exchanges, and treasuries by the end of 2025, a period described as Bitcoin’s “institutional supply era” [T1]. Separately, institutional entities including ETFs, governments, and public and private companies reportedly hold about 18.5% of Bitcoin’s 21 million supply cap, equal to roughly 3.89 million BTC, calculated as 21,000,000 x 18.5% [T4]. These figures measure different universes and should not be conflated, but both support the same conclusion: institutional balance sheets now matter for price discovery.
The bullish thesis rests on scarcity plus adoption. Supply is 95.69% issued, FDV is almost identical to market cap, and ETF access has made BTC easier to own in regulated portfolios. IBIT reportedly reached USD 10bn in assets in 49 trading days, the fastest such ETF milestone cited in the source material [T4]. Regulatory clarity, dollar-debasement concerns, and institutional inflows are also cited as defining themes for crypto markets in 2026 [T8].
The bearish counterpoint is equally important. ETF flows have become Bitcoin’s de facto macro indicator: record Q4 2025 outflows from US-listed BTC and ETH ETFs coincided with BTC breaking USD 98,000 support and retesting the low USD 90,000 area [T1]. At EUR/USD 1.1239, those USD reference levels equal approximately EUR 87,107 and EUR 80,078, for context only. Flow-led markets can reprice quickly when the marginal buyer steps back.
Bullish Drivers
- Institutional access: Spot ETFs, corporate treasuries, and regulated investment vehicles have turned BTC into an allocatable line item for RIAs, private banks, and institutions [T1].
- Regulatory pipeline: The Digital Asset Market Clarity Act was scheduled for Senate Banking Committee review on 14 May 2026, and broader US market-structure legislation remains a potential institutional catalyst [T3]. Grayscale also cited the GENIUS Act on stablecoins and expected bipartisan crypto market-structure legislation as factors that could further integrate blockchain finance into mainstream capital markets [T8].
- Scarcity: 95.69% of the fixed maximum supply has been issued. With FDV almost equal to current market cap, the investment debate centers on demand absorption rather than future token dilution.
- Volatility maturation: Glassnode x Fasanara figures cited in source material show Bitcoin volatility falling from 84% to 43%, suggesting a more institutionally mature asset, even if it remains high beta [T1].
- Debasement hedge demand: Grayscale argues that concerns about dollar debasement and fiat credibility could support alternative monetary assets such as bitcoin and ether [T8].
- ETF economics: Fee compression and product innovation among ETF providers may expand the addressable market for cost-sensitive institutional allocators [T3].
Third-party forecasts should be treated as scenario inputs, not altii house views. One source cites conservative 2026 model ranges of USD 85,000 to USD 118,000 and more aggressive 2029 pathways of USD 300,000 to USD 500,000, contingent on favorable Federal Reserve policy [T3]. At EUR/USD 1.1239, those levels equal approximately EUR 75,629 to EUR 104,991 for the 2026 range and EUR 266,927 to EUR 444,879 for the 2029 range, before transaction costs, tax, and FX movement.
Relative Positioning vs Gold and Ethereum
Bitcoin remains dominant within crypto: BTC dominance is 58.79%, and its market cap of EUR 1.50tn represents roughly 58.85% of the EUR 2.56tn total crypto market cap. That supports BTC’s role as the default crypto reserve asset.
Relative to gold, the message is less clear. During the 2025 correction, Bitcoin lagged traditional assets such as gold and bonds, reminding investors that even in an institutional era BTC remains a high-beta asset [T1]. In a risk-off or real-yield shock, gold can still attract defensive capital ahead of BTC. In a fiat-debasement regime, however, BTC may compete more directly with gold as an alternative monetary asset.
Relative to Ethereum, Bitcoin currently has the stronger market-share signal. However, ETF flow cycles link the two assets: record Q4 2025 outflows from both US-listed BTC and ETH ETFs coincided with the broader crypto correction [T1]. Grayscale also groups bitcoin and ether within the alternative monetary-asset universe that could benefit from fiat-credibility concerns [T8]. The relative call therefore depends on mandate: BTC offers cleaner monetary scarcity and higher institutional reserve status, while ETH offers broader smart-contract and on-chain activity exposure.
Data limitation: current gold and Ethereum spot prices are unavailable in the provided bundle. This section therefore uses BTC dominance and qualitative source evidence rather than point-in-time gold/BTC or ETH/BTC valuation ratios.
Scenario Framework
| Scenario | Conditions | BTC/EUR Implication |
|---|---|---|
| Bear case | US yields stay elevated, liquidity tightens, ETF outflows accelerate, and geopolitical uncertainty rises. One report cited BTC ETF weekly outflows above USD 700m during a period when BTC struggled to reclaim USD 82,000 and its 200-day moving average [T2]. | BTC loses current consolidation support. USD 82,000 equals about EUR 72,960 at EUR/USD 1.1239. Sustained trading below this EUR-equivalent area would weaken the recovery signal. |
| Base case | Risk sentiment stays neutral, euro yields fall gradually, and ETF flows remain mixed. Recent reported US spot BTC ETF data showed USD 134.4m inflows over the first two October trading days, after a USD 148.7m outflow on 30 September and a USD 89.9m outflow on 5 October [T6]. | BTC consolidates around current levels. A broad EUR 70,000 to EUR 85,000 working range is consistent with post-drawdown stabilization, not a formal price target. |
| Bull case | Regulatory progress accelerates, ETF inflows resume, and the Fed turns more supportive. One source cites daily ETF inflows above USD 500m as part of a constructive institutional setup [T3]. | BTC retests prior resistance zones and moves toward third-party USD 85,000 to USD 118,000 2026 scenario levels, equal to approximately EUR 75,629 to EUR 104,991 at EUR/USD 1.1239 [T3]. |
The framework is deliberately flow-sensitive. ETF data can swing from heavy buying to heavy selling within weeks and should be evaluated alongside rates, regulation, leverage, and sentiment [T6].
Valuation Discussion
Bitcoin has no earnings, cash flows, book value, or issuer balance sheet. Traditional discounted cash-flow valuation is therefore unavailable. The relevant valuation framework is scarcity, liquidity, adoption, and marginal flow.
The scarcity argument is strong on the data. Circulating supply is 20,094,475 BTC versus a 21,000,000 maximum, meaning 95.69% has already been issued. FDV of EUR 1,504.26bn is almost identical to market cap of EUR 1,504.25bn. Unlike many crypto assets, BTC has little remaining issuance dilution.
The flow argument is constructive but cyclical. Institutional entities reportedly hold around 18.5% of the fixed supply cap [T4], while 6.7 million BTC reportedly sits across ETFs, exchanges, and treasuries [T1]. If regulated demand expands against near-fixed supply, the price response can be convex. If ETF demand reverses, the same fixed-supply structure offers less protection against drawdowns because the marginal buyer disappears.
The current price of EUR 74,861 is 30.47% below the EUR 107,662 all-time high. That is not a simple “cheap” signal. It shows that BTC has already repriced materially lower, but it also confirms that drawdown risk remains large. In 2025, the broader correction erased more than USD 1tn of market value and BTC fell nearly 30% from peak levels in source commentary [T1].
On risk-adjusted terms, volatility compression from 84% to 43% improves the institutional case if it persists [T1]. However, a 43% volatility asset still requires disciplined sizing, liquidity governance, and clear rebalancing rules.
Risks
- Rates and liquidity risk: Higher Treasury yields can make institutional buyers more selective and reduce the appeal of non-yielding assets such as BTC [T2].
- ETF flow reversal: ETF flows can shift from heavy buying to heavy selling within weeks, and flows are only one input alongside rates, leverage, regulation, and sentiment [T6].
- High beta: Bitcoin remains a high-beta corner of global markets despite institutional adoption [T1]. The 1-year EUR return of -32.35% confirms that point.
- Regulatory execution risk: The CLARITY Act was scheduled for review, not guaranteed passage [T3]. Regulatory uncertainty still constrains short-term price growth [T4].
- Geopolitical risk: An unresolved Iran-US conflict has been cited as adding uncertainty around growth and inflation [T2].
- Leverage and liquidation risk: Centralized-exchange derivatives can amplify squeezes and liquidations, as seen around the August 2026 USD 70,000 short-squeeze episode [T5].
- Cycle risk: It is too early to declare Bitcoin’s four-year cycle obsolete, even if institutional flows now rival halving effects [T4].
- FX risk for EUR investors: BTC liquidity and reference levels are often USD-denominated. EUR returns depend on both BTC price movement and EUR/USD translation.
Appendix
Methodology and Data Notes
- Primary BTC market data are EUR-quoted and were retrieved at 2026-10-07T04:15:14Z.
- Market overview data use equity observations from 6 to 7 October 2026, ECB yield-curve data as of 5 October 2026, and FX data as of 7 October 2026.
- USD price references from sources are not EUR market data. Where shown, they are converted using EUR/USD 1.1239 for illustration only.
- Benchmark assets are gold and Ethereum. Current gold and ETH spot levels are unavailable in the bundle.
- On-chain valuation ratios, realized cap, MVRV, funding rates, options skew, and exchange reserve data are unavailable in the bundle.
Selected Calculations
- ATH drawdown: (EUR 74,861 – EUR 107,662) / EUR 107,662 = -30.47%.
- Supply issued: 20,094,475 / 21,000,000 = 95.69%.
- Daily turnover: EUR 27.80bn / EUR 1,504.25bn = 1.85%.
- 24h range position: (74,861 – 74,433) / (77,102 – 74,433) = 16.0%.
- BTC share of total crypto market cap: EUR 1,504.25bn / EUR 2,556.36bn = 58.85%, versus reported dominance of 58.79% due to timing and rounding.
Sources
- [T1] Crypto Market 2025: Year-End Review & Expert Insights
- [T2] US Treasury yields surge to new highs as liquidity tightens, pushing Bitcoin back below $82,000 resistance
- [T3] Bitcoin Price Prediction 2026 May 10
- [T4] The End of Bitcoin’s Four-Year Cycle? How ETFs and Institutions Are Reshaping the Market
- [T5] Bitcoin Tests $70,000 As Intraday Squeeze Lifts Market
- [T6] Bitcoin ETF Inflows: How Institutional Money Affects BTC Price
- [T8] Grayscale outlines two drivers behind its bullish crypto outlook for 2026
Disclaimer
This report is AI-generated, for informational purposes only, and does not constitute investment advice, investment research, an offer, or a solicitation to buy or sell any financial instrument or crypto asset. Digital assets are volatile and may not be suitable for all investors. Third-party forecasts are presented only as scenario inputs and are not altii house views.
Important Note / Wichtiger Hinweis:
EN: This report may have been generated using AI. It processes data from publicly available sources. The content is provided for informational purposes only.DE: Dieser Bericht kann mithilfe von KI erstellt worden sein. Dabei werden Daten aus öffentlich zugänglichen Quellen verarbeitet. Die Inhalte dienen ausschließlich Informationszwecken.
* DE: Die ergänzenden Inhalte können KI-generiert sein. EN: The additional content may be AI-generated.