
The altii-BTC-Report: Bitcoin (BTC) in EUR
Report date: 8 October 2026. Market data as of 2026-10-08 04:15 UTC. Quote currency: EUR.
Watch the video
This player shows only the Bitcoin chapter of the daily altii market briefing. Watch the full video on tube.altii.de.
Key Data Snapshot
| Metric | Value | Note |
|---|---|---|
| Price (BTC/EUR) | EUR 73,749 | 24h change -1.48% |
| Market cap | EUR 1,481.99 bn | Rank 1, dominance 58.66% |
| 24h volume | EUR 32.06 bn | Turnover ratio: 32.06 bn / 1,481.99 bn = 2.16% |
| 24h range | EUR 73,778 to 75,273 | Range 2.03% of low; reported spot sits marginally below stated low, a data-inconsistency flag |
| 7d / 14d / 30d | -0.86% / -1.93% / +4.81% | Soft near term, positive medium term |
| 200d / 1y | +19.48% / -32.20% | Medium-term gain, deep one-year drawdown |
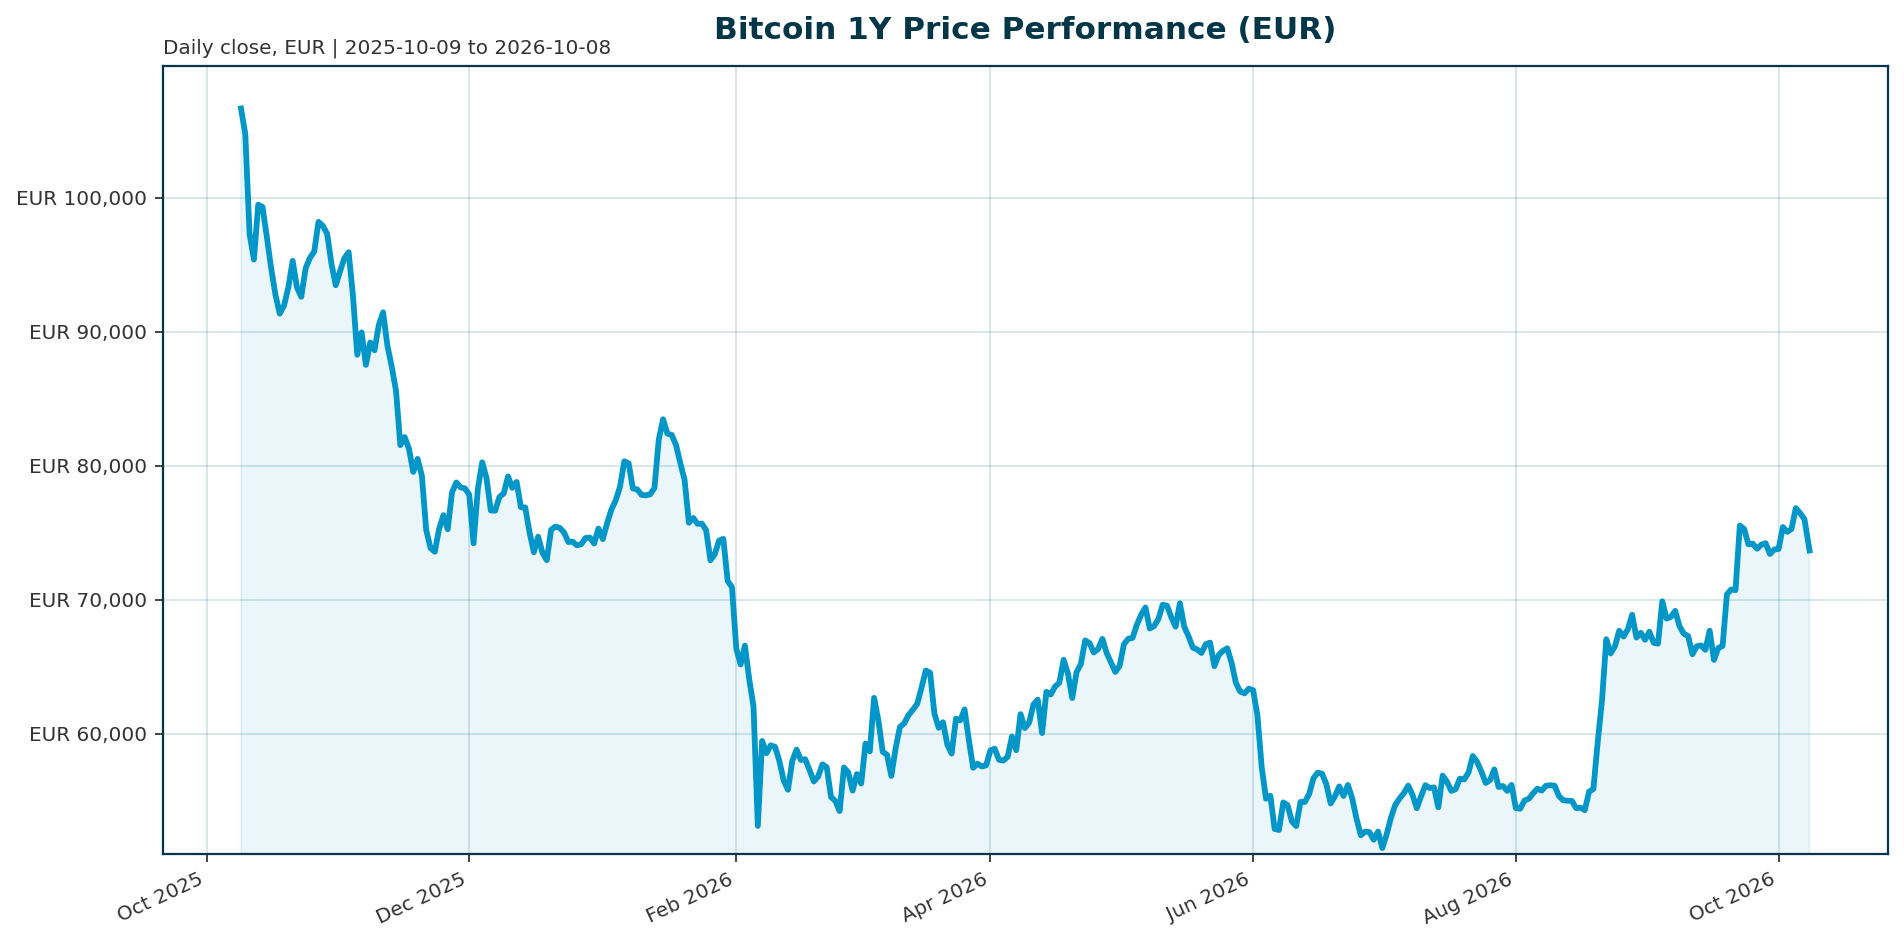
| All-time high | EUR 107,662 (6 Oct 2025) | -31.50%; absolute gap EUR 33,913 |
| Circulating supply | 20,095,031 BTC | 95.69% of 21m cap; 904,969 BTC left to mine |
| Fully diluted valuation | EUR 1,481.99 bn (reported) | Check: price x 21m = EUR 1,548.73 bn; reported FDV instead matches market cap, methodology flagged |
| Total crypto market cap | EUR 2,519.73 bn | BTC dominance cross-check: 1,482.0 / 2,519.7 = 58.82%, vs reported 58.66% |
All-time low of EUR 51.30 (July 2013) implies a cumulative gain of roughly +143,665%. This is historical context, not a valuation anchor.
Market Setup
Cross-asset context is neutral. Risk sentiment is neutral and equity momentum is mixed: the Nasdaq Composite leads on a 5-day basis at +2.48% while the ATX is weakest at -0.99%, and DACH indicators average -0.17% over 5 days versus +1.32% for global equity peers. Rates are mixed: the euro area AAA 10Y yield sits at 3.52%, down 6.3 bp over 5 days, with a 10Y-2Y spread of 46.6 bp. FX is mixed, with EUR/USD at 1.1233, down 0.41% over 5 days. This backdrop neither confirms nor refutes the crypto narrative; it leaves ETF flows and regulation as the decisive BTC variables [T2].
Against that neutral canvas, BTC trades with modest negative momentum: -0.50% over 1 hour, -1.48% over 24 hours, -0.86% over 7 days and -1.93% over 14 days, but +4.81% over 30 days and +19.48% over 200 days. The one-year return of -32.20% is the dominant statistical fact: BTC remains in a deep drawdown from its October 2025 peak even as institutional infrastructure keeps expanding. Sources agree the macro backdrop, particularly rates, remains the primary variable, with the Fed under Chair Warsh expected to hold rates and limit the easing that historically supported risk recoveries [T2]. Bitcoin also remains tied to ETF flows as a tangible leading indicator of institutional rotation [T2][T7].
Investment Thesis
BTC is a scarce, liquid, benchmark crypto asset with a structurally institutional ownership base. Its rank 1 status and 58.66% dominance make it the entry point for nearly all regulated crypto capital. Roughly 95.69% of maximum supply already circulates, and only 904,969 BTC remain to be issued, so the marginal price is set almost entirely by demand, and that demand is now institutional [T1][T4].
The 2025 evidence is unambiguous on structure: ETF flows effectively became Bitcoin’s new macro indicator, and 6.7 million BTC sat across ETFs, exchanges and treasuries at year end, a regime Glassnode called the “institutional supply era” [T1]. Spot ETFs, corporate treasuries and regulated vehicles turned BTC into an allocatable line item for advisers, private banks and institutions [T1]. One 2026 outlook argues institutions absorbed multiples of daily miner issuance, converting BTC into a macro-sensitive reserve asset rather than a purely speculative one [T6].
The bearish counterweight is that institutionalization cuts both ways. The same regulated channels that pulled capital in during 2025 pushed record sums out in Q4 2025, coinciding with BTC breaking support near $98,000 and retesting the low $90,000 range [T1]. ETF outflows above $2bn again tested the market in June 2026 [T8]. The thesis therefore rests on a tension: long-term structural adoption versus near-term flow cyclicality, and BTC currently sits in the drawdown phase of that cycle at EUR 73,749, 31.50% below its ATH.
Bullish Drivers
- Regulatory catalyst. The CLARITY Act would establish a federal market-structure framework for digital assets and could unlock broader institutional participation if passed [T2]. Senate Banking Committee review was scheduled for May 2026, making legislative progress the most concrete upside trigger [T5].
- Institutional absorption of supply. With 6.7 million BTC in ETFs, exchanges and treasuries [T1] and projections of corporate holdings surpassing $250 bn alongside more than 100 new crypto-linked ETFs [T4], structural demand continues to build even while price is under pressure [T2].
- Derivatives maturity. Deep options markets on regulated BTC ETFs now support covered-call, buffered and other income or hedging strategies [T2], and CME’s proposed Bitcoin volatility index would let institutions trade volatility separately from directional exposure, easing a key risk-committee constraint, though adoption is expected to be gradual and final CFTC approval was still pending [T7].
- Supply scarcity. 904,969 BTC remain unissued out of a 21 million cap (calculation: 21,000,000 – 20,095,031). Issuance pressure is de minimis relative to a 24h turnover of EUR 32.06 bn.
- Volatility compression. BTC volatility fell from 84% to 43% per the Glassnode x Fasanara 2025 report [T1], potentially supporting higher acceptable portfolio weights over time.
Balance: none of these drivers has yet reversed the one-year return. Daily ETF inflows above $400m cited in one analysis [T3] conflict with the outflow evidence in [T8]; the flow picture is regime-dependent, not one-way.
Relative Positioning vs Gold and Ethereum
Data caveat: the bundle contains no current gold or Ethereum price, market-cap or return data. Quantitative relative-performance claims are therefore unavailable; positioning is qualitative and source-based.
vs Gold: BTC lagged gold and bonds during the Q4 2025 correction, a reminder that even in an institutional era it remains a high-beta corner of global markets [T1]. The bullish framing is that BTC offers higher-beta store-of-value convexity with improving volatility characteristics (84% to 43% [T1]). The bearish framing is that in genuine risk-off or liquidity-stress episodes, gold retains its defensive bid while BTC trades like a macro risk asset and draws down with equities. For EUR-based allocators, gold competes for the same “monetary hedge” mandate with materially lower drawdown risk.
vs Ethereum: BTC remains the scarcity and store-of-value benchmark, while value increasingly accrues to Ethereum for staking and DeFi infrastructure [T6]. Notably, record outflows hit both BTC and ETH ETFs in Q4 2025 [T1], so the drawdown is an asset-class phenomenon, not BTC-specific. In Asia, institutional adoption is channelling through tokenization and regulated stablecoins, where pure bitcoin ETF plays a smaller strategic role than in North America and Europe [T2]; this is a modest structural headwind for BTC’s share of global institutional flows.
Scenario Framework
FX anchor for all USD-to-EUR translations: EUR/USD 1.1233, held static. Current implied USD reference: 73,749 x 1.1233 = ~$82,843 (context only).
| Scenario | Drivers | Reference level (EUR, static FX) | vs spot |
|---|---|---|---|
| Bear | ETF outflows persist [T8], macro deteriorates, regulation stalls; BTC stays below ATH | Below EUR 73,749; risk toward retest of cycle lows | Downside |
| Base | Consolidation; neutral macro, two-sided ETF flows; 30d/200d trends offset 1y damage | EUR 70,000 to 80,000 range | Flat |
| Bull | ETF inflows resume, CLARITY Act passes; analytics-platform range of $85,000 to $132,000 [T3] | $85,000 = ~EUR 75,672; $132,000 = ~EUR 117,507 | +3% to +59% |
| Strong bull | Policy tailwinds plus sustained institutional demand; $180,000 2026 forecast [T6]; $150,000 marker = ~EUR 133,531 [T3] | $180,000 = ~EUR 160,238 | +117% |
| Long-dated optionality | $300,000 to $500,000 by 2029 contingent on favorable Fed policy shifts [T5] | ~EUR 267,063 to 445,105 | +262% to +503% |
Interpretation: the conservative model range of $85,000 to $118,000 [T5] translates to roughly EUR 75,672 to 105,043, implying only modest upside before price must clear its EUR-denominated ATH gap of EUR 33,913. Scenarios above the base case should be treated as conditional paths, not forecasts; the +503% long-dated scenario carries the widest confidence interval and depends on Fed easing that current policy guidance does not support [T2].
Valuation Discussion
BTC has no cash flows, so valuation rests on scarcity, network dominance, liquidity depth and flow regime rather than earnings multiples. The available anchors:
- Scarcity: 95.69% of max supply circulating; annual issuance is a rounding error against EUR 32.06 bn daily turnover (turnover ratio 2.16%).
- Dominance: 58.66% of a EUR 2,519.73 bn crypto market; BTC remains the risk asset through which regulated capital expresses crypto exposure [T4].
- Drawdown position: -31.50% from ATH (EUR 107,662 to EUR 73,749). Historically, institutional-era drawdowns of this depth have preceded recovery phases, but the one-year return of -32.20% shows the correction is still live, and Q4 2025 erased more than $1 trillion in market value as BTC fell nearly 30% peak-to-trough [T1].
- Volatility regime: the fall from 84% to 43% annualized volatility [T1] is the strongest re-rating argument: lower volatility raises the weight a mean-variance allocator can assign at equal risk budget. Counterpoint: BTC still produces frequent double-digit moves on ETF-flow or regulatory headlines [T7], so volatility compression is cyclical as much as structural.
- Flow multiple: the institutional premium in BTC’s valuation is effectively a function of ETF net flows. If flows turn structurally negative, as in the $2bn+ outflow episode of June 2026 [T8], the premium compresses despite fixed supply.
Valuation cross-check: reported FDV of EUR 1,481.99 bn is inconsistent with price x max supply of EUR 1,548.73 bn; the reported figure matches market cap instead. This does not change the market-cap anchor but should be reconciled in any downstream model.
Risks
- ETF flow risk (primary). Record Q4 2025 outflows broke key support near $98,000 [T1], and outflows above $2bn renewed pressure in mid-2026 [T8]. The burden of proof is on bulls to show outflows slowing and buyers stepping in at lower levels [T8].
- Rate sensitivity. The Fed is expected to hold rates through Q3, limiting the easing that historically supported risk recoveries [T2]. Fed funds at 3.50% to 3.75% [T5] keeps the opportunity cost of zero-yield BTC exposure elevated.
- Drawdown risk. A -32.20% one-year return and a -31.50% drawdown from ATH demonstrate that institutionalization did not remove tail risk; Q4 2025 alone wiped out more than $1 trillion in crypto market value [T1].
- Regulatory risk. The CLARITY Act is a catalyst, not a certainty; delays or adverse market-structure rules would cap institutional participation despite mature infrastructure [T2][T5].
- Market-structure dependence. BTC’s volatility profile still exceeds traditional assets, with double-digit swings driven by flows, macro data and headlines [T7]. The CME Bitcoin VIX remains pre-approval and unproven in a stress event [T7].
- Competition for capital. BTC must compete with AI and other high-growth equity themes for institutional risk budgets [T8], and Asian adoption channels favour tokenization and stablecoins over pure BTC exposure [T2].
- Operational and technology risk. Custody, exchange and protocol dependencies persist even in a matured market; technology-risk monitoring should cover protocol dependencies and security posture [T4].
- Data risk (report-specific). Reported spot (EUR 73,749) sits below the reported 24h low (EUR 73,778), and reported FDV methodology is inconsistent; both flags should temper precision in any derived metrics.
Appendix
Methodology. Quantitative anchors come from the bundle’s CoinGecko-sourced market data (retrieved 2026-10-08 04:15:07 UTC) and the market-overview module (rates as of 2026-10-06, equities as of 2026-10-07/08). Narrative support comes from eight Tavily-sourced articles (retrieved 2026-10-08 04:15:13 UTC), several without publication dates; these are used as directional context, not as data feeds. Quote currency is EUR throughout.
Calculations shown. Turnover ratio: 32,062,356,567 / 1,481,993,567,031 = 2.16%. Distance to ATH: (73,749 / 107,662 – 1) x 100 = -31.50%. ATH gap: 107,662 – 73,749 = EUR 33,913. Circulating share of max supply: 20,095,031 / 21,000,000 = 95.69%; remaining 904,969 BTC. Dominance cross-check: 1,481,993,567,031 / 2,519,731,802,243 = 58.82% vs reported 58.66%. 24h range: (75,273 – 73,778) / 73,778 = 2.03%. Implied USD spot: 73,749 x 1.1233 = ~$82,843. FDV check: 73,749 x 21,000,000 = EUR 1,548.73 bn vs reported EUR 1,481.99 bn.
Data caveats. No current gold or Ethereum market data were supplied, so benchmark positioning is qualitative. No ETF daily flow table, on-chain metrics, futures basis, options skew or custody data were provided. ETF-flow evidence is directionally mixed across sources ([T3][T5] cite large inflows; [T8] cites outflows above $2bn) and is treated as regime-dependent. USD scenario levels are translated at a static EUR/USD of 1.1233 and are sensitivities, not forecasts.
Sources
- [T1] Crypto Market 2025: Year-End Review & Expert Insights. tradingview.com
- [T2] Q2 2026 Digital Asset Review. coindesk.com
- [T3] Bitcoin Price Prediction 2026: Institutional Adoption. intellectia.ai
- [T4] Crypto Analysis for 2026: Bitcoin, ETFs, Regulation. blockchain-council.org
- [T5] Bitcoin Price Prediction 2026. intellectia.ai
- [T6] The Retail vs. Institutional Divide: How Trading Patterns Reveal Two Completely Different Markets. blockhead.co
- [T7] CME Is Launching a Bitcoin VIX: Here’s Why That Changes Wall Street’s Bitcoin Game. 247wallst.com
- [T8] Bitcoin Opens June Under Pressure as ETF Outflows Cross $2B. hedgeco.net
Disclaimer. This report is AI-generated and is for informational purposes only. It does not constitute investment advice, a recommendation, or an offer to buy or sell any financial instrument. Market data may contain inconsistencies as flagged above, and scenario levels are conditional sensitivities rather than forecasts. Readers should conduct their own due diligence and consult licensed advisers before making allocation decisions.
Important Note / Wichtiger Hinweis:
EN: This report may have been generated using AI. It processes data from publicly available sources. The content is provided for informational purposes only.DE: Dieser Bericht kann mithilfe von KI erstellt worden sein. Dabei werden Daten aus öffentlich zugänglichen Quellen verarbeitet. Die Inhalte dienen ausschließlich Informationszwecken.
* DE: Die ergänzenden Inhalte können KI-generiert sein. EN: The additional content may be AI-generated.