
Watch the video
This player shows only the Bitcoin chapter of the daily altii market briefing. Watch the full video on tube.altii.de.
Key Data Snapshot
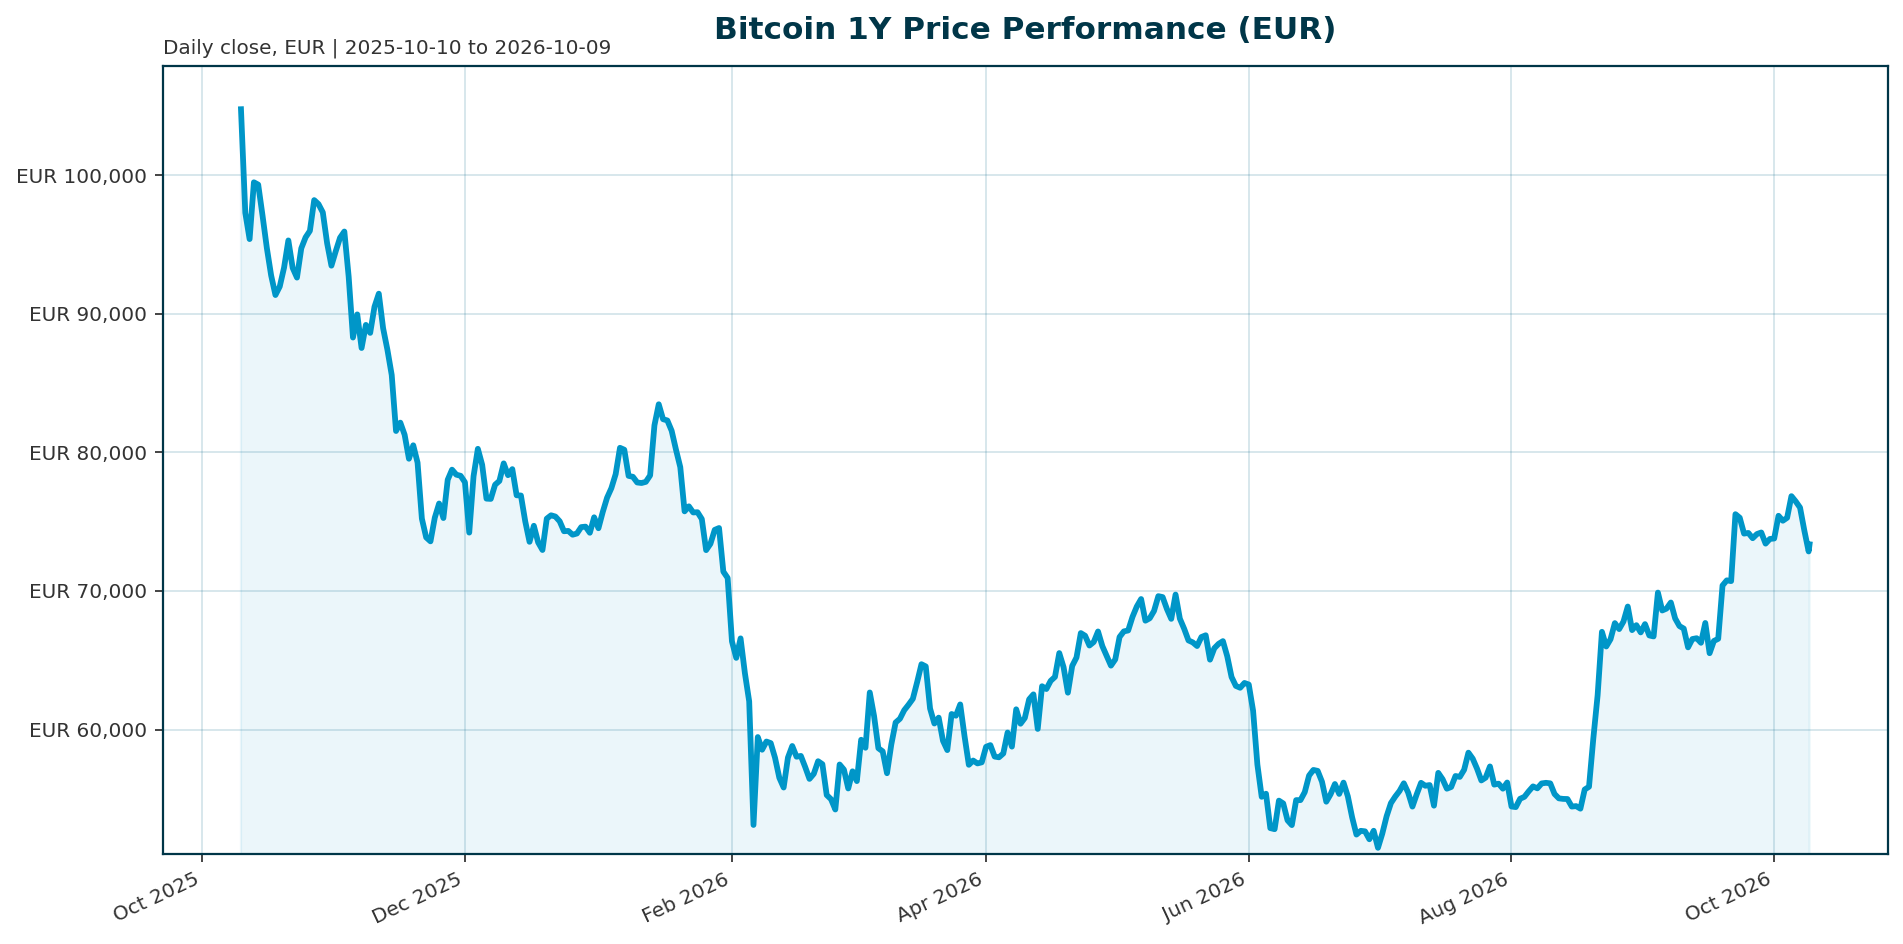
| Metric | Value | Institutional read |
|---|---|---|
| BTC/EUR price | €73,437 | Near-term consolidation after recent weakness. |
| Market cap | €1.476 trillion | Rank 1 crypto asset by market capitalization. |
| 24h volume | €37.75 billion | Volume-to-market-cap ratio: €37.75bn / €1.476tn = 2.56%. |
| Performance | 24h: -0.41%; 7d: -3.29%; 30d: +4.62%; 200d: +20.31%; 1y: -32.38% | Mixed profile: short-term pressure, positive medium-term trend, negative one-year drawdown. |
| 24h range | Low €71,640; high €74,122 | Range: €74,122 – €71,640 = €2,482, or 3.38% of spot price. |
| All-time high | €107,662 on 2025-10-06 | Current discount: -31.79%. Upside to regain ATH: (€107,662 / €73,437) – 1 = 46.60%. |
| Supply | 20,095,465 BTC circulating; 21,000,000 BTC maximum | Circulating supply equals 95.69% of max supply; remaining issuance is 904,535 BTC. |
| FDV | €1.476 trillion | FDV premium to market cap is approximately 0.00017%, so dilution from remaining issuance is minimal. |
| BTC dominance | 59.10% | Confirms Bitcoin as the anchor asset within a €2.492 trillion crypto market. |
Market Setup
Bitcoin trades in a cross-asset setting that is not clearly risk-on. The market overview shows neutral to negative risk sentiment, mixed euro yields with curve steepening, and a mixed FX backdrop. DACH equity indicators are down an average of 2.01% over five days versus -0.30% for global equity indicators. The euro area AAA 10-year yield is 3.54%, down 5.4 bp over five days, while the 10-year minus 2-year spread is 54.2 bp. EUR/USD is 1.1204, down 0.27% over five days.
This backdrop matters because Bitcoin now behaves as both a crypto asset and a macro liquidity asset. Sources describe ETF flows, Treasury yields, liquidity conditions and regulatory developments as increasingly important drivers of Bitcoin price action [T3][T4]. A more supportive policy and liquidity environment would likely help risk appetite, while higher real and nominal yields can make government debt more competitive relative to Bitcoin for institutional allocators [T3][T7].
The immediate market message is balanced. The positive 30-day and 200-day performance argues against a fully bearish setup. However, the negative 24-hour, 7-day and one-year performance shows that the market still discounts meaningful drawdown risk.
Investment Thesis
The institutional case for Bitcoin rests on four pillars: scarcity, liquidity, market leadership and regulated access.
- Scarcity: Circulating supply is 20,095,465 BTC versus a maximum supply of 21,000,000 BTC. With 95.69% of maximum supply already circulating, Bitcoin’s supply profile is materially more fixed than most financial assets.
- Market leadership: Bitcoin has a €1.476 trillion market cap, rank 1 crypto status and 59.10% crypto dominance. It remains the primary institutional gateway to digital assets.
- Regulated access: Spot ETFs, corporate treasuries and regulated investment vehicles have made Bitcoin easier to integrate into traditional financial workflows [T1].
- Liquidity infrastructure: Bitcoin offers deep spot liquidity, futures markets, custody infrastructure and regulated trading venues, making it more institutionally usable than most crypto assets [T8].
The thesis is constructive but conditional. Bitcoin can serve as a strategic digital scarcity asset for portfolios willing to tolerate high volatility. Yet its realized return path increasingly depends on capital flows, ETF demand, macro liquidity and regulatory clarity rather than scarcity alone [T1][T7].
Bullish Drivers
- ETF flows as marginal demand: ETF flows have become a key market-structure indicator for Bitcoin. A cited review describes 2025 as the first full year in which crypto operated in an ETF- and macro-led regime [T1].
- Institutional supply era: By end-2025, 6.7 million BTC reportedly sat across ETFs, exchanges and treasuries, according to the cited Glassnode summary [T1]. This supports the view that Bitcoin supply is increasingly intermediated through institutional channels.
- Recent flow signals: One cited flow summary reports U.S. spot Bitcoin ETFs recorded $190.65 million of net inflows in one day and six consecutive trading days of inflows, while Ethereum ETFs recorded $66.01 million that day [T5]. Treat this as a positive but lower-confidence social-source datapoint.
- Broader fund participation: A cited report states crypto funds saw $3.55 billion of inflows, with Bitcoin leading and Bitcoin ETF inflows helping return cumulative 2026 flows to positive [T8].
- Regulatory clarity: Market-structure legislation and the CLARITY Act are cited as potential catalysts for institutional capital because predictable rules reduce allocation frictions [T6].
- Macro optionality: A growing economy and more supportive Fed policy are cited as conditions consistent with stronger risk appetite for crypto assets [T7].
The bullish case requires persistence. Episodic inflows can support rallies, but a durable repricing likely needs repeated ETF demand, healthier spot volume and lower macro stress.
Relative Positioning vs Gold and Ethereum
Versus gold: Bitcoin remains a higher-beta store-of-value proxy rather than a pure safe-haven substitute. A cited 2025 review states Bitcoin lagged traditional assets such as gold and bonds during a bearish Q4 correction, despite greater institutional adoption [T1]. Current gold price, gold returns, gold volatility and gold flow data are unavailable in the provided bundle, so a quantitative BTC/gold comparison is unavailable.
Versus Ethereum: Bitcoin retains the institutional anchor role within crypto. It has 59.10% dominance and rank 1 market-cap status. The cited ETF flow snapshot shows Bitcoin ETFs attracting $190.65 million in one day versus $66.01 million for Ethereum ETFs [T5]. Another cited report states Ethereum funds attracted $702 million as institutional demand returned, indicating that ETH also benefits from the regulated-product channel [T8]. Current ETH/EUR price, ETH market cap, ETH performance and ETH valuation data are unavailable in the provided bundle.
Portfolio interpretation: Bitcoin should be framed as the liquid core exposure within crypto. Ethereum can offer differentiated smart-contract and staking-related exposure, but the data supplied here are insufficient to quantify relative valuation. Gold remains the conventional store-of-value benchmark, but Bitcoin’s drawdown profile and flow sensitivity make it meaningfully more cyclical.
Scenario Framework
| Scenario | Conditions | BTC/EUR implication |
|---|---|---|
| Base case | ETF flows stabilize but remain uneven; macro sentiment stays neutral to negative; positive 30-day and 200-day momentum offsets short-term weakness. | BTC consolidates around current levels. The €73,437 spot price remains supported by institutional infrastructure, but the market requires fresh demand to challenge higher levels. |
| Bull case | Spot ETF inflows persist, regulatory clarity improves, liquidity conditions ease and risk appetite broadens across digital assets. | BTC recovers a larger share of its 31.79% ATH drawdown. Regaining the €107,662 ATH requires a 46.60% move from current levels. |
| Bear case | ETF outflows resume, yields rise, risk sentiment deteriorates or leverage-led rallies fail to attract sustained spot demand. | BTC retests lower support zones. Sources note that weaker ETF flows remove a clear source of marginal demand, while leveraged intraday moves require real spot confirmation [T3][T4]. |
The key swing factor is the interaction between flows and macro. Bitcoin’s 200-day gain of 20.31% shows medium-term resilience, but the one-year decline of 32.38% confirms that institutionalization has not eliminated drawdown risk.
Valuation Discussion
Bitcoin cannot be valued with conventional discounted cash flow methods. A practical institutional valuation framework should focus on scarcity, market share, liquidity, adoption and capital flows.
- Scarcity value: Remaining supply to maximum is 904,535 BTC. Calculation: 21,000,000 – 20,095,465 = 904,535 BTC.
- Dilution profile: FDV is €1,475,808,117,831 versus market cap of €1,475,805,547,441. FDV premium: (€1,475,808,117,831 – €1,475,805,547,441) / €1,475,805,547,441 = 0.00017%.
- Market-share signal: Reported BTC dominance is 59.10%. Using provided market caps gives €1.476tn / €2.492tn = 59.22%, broadly consistent with the reported dominance figure.
- Liquidity share: BTC 24-hour volume share of total crypto volume is €37.75bn / €108.61bn = 34.76%. This is below its market-cap share, suggesting trading activity is spread across the wider crypto market despite BTC’s dominance.
- ATH reference: Current price is €34,225 below the ATH. Calculation: €107,662 – €73,437 = €34,225.
The valuation case is therefore not that Bitcoin is statistically cheap in an equity-style sense. The case is that a scarce, liquid, institutionally accessible asset can re-rate if regulated demand expands. The bearish counterpoint is equally important: if ETF flows weaken, liquidity tightens or investors demand higher compensation for volatility, valuation can compress quickly [T1][T3][T7][T8].
Risks
- Flow reversal: Sources cite episodes of large ETF outflows, including more than $700 million in weekly outflows in one period and over $4 billion of outflows since April in another cited period [T3][T6]. Because ETF demand is now central to market structure, flow reversals can have immediate price impact.
- Macro tightening: Higher yields can make institutional buyers more selective because government debt offers a stronger return profile [T3].
- Volatility and drawdown: BTC is 31.79% below its ATH and down 32.38% over one year. Institutionalization has reduced some access frictions, but not the asset’s high-beta character.
- Leverage risk: Short squeezes and derivatives activity can generate rapid intraday rallies that still need sustained spot demand to confirm a durable breakout [T4].
- Regulatory risk: Changes to ETFs, custody, taxation or trading rules could affect institutional demand and fund flows [T8].
- Relative safe-haven risk: Bitcoin can lag gold and bonds during correction phases, even when long-term adoption trends improve [T1].
- Data limitations: No on-chain metrics, futures basis, options skew, ETF AUM, exchange reserve data, live gold data or live Ethereum market data are included in the bundle.
Appendix
Report Parameters
- Asset: Bitcoin (BTC)
- Quote currency: EUR
- Market data retrieved: 2026-10-09T04:15:07.384624Z
- Report generated: 2026-10-09T04:15:25.544490Z
- Market overview data retrieved between 2026-10-09T04:15:13.669931Z and 2026-10-09T04:15:25.542012Z
Key Calculations
- 24h trading range: €74,122 – €71,640 = €2,482.
- 24h range as percentage of price: €2,482 / €73,437 = 3.38%.
- Volume-to-market-cap ratio: €37,751,171,496 / €1,475,805,547,441 = 2.56%.
- Remaining supply: 21,000,000 BTC – 20,095,465 BTC = 904,535 BTC.
- Circulating supply as percentage of maximum supply: 20,095,465 / 21,000,000 = 95.69%.
- Distance to ATH: €107,662 – €73,437 = €34,225.
- Upside required to regain ATH: (€107,662 / €73,437) – 1 = 46.60%.
- BTC market-cap share using supplied caps: €1,475,805,547,441 / €2,492,243,105,961 = 59.22%.
- BTC volume share of total crypto volume: €37,751,171,496 / €108,605,268,122 = 34.76%.
- Euro area 10Y-2Y spread validation: (3.5383512187% – 2.9964565821%) x 100 = 54.19 bp.
Data Caveats
Several Tavily sources have no published_at value in the provided source list. ETF flow references come from different points in time and may not be directly comparable without a unified flow dataset. One cited source is a social-media post and should be treated as weaker evidence than institutional research or primary fund-flow data. No live gold or Ethereum market data is provided, so relative positioning versus those benchmarks is necessarily qualitative.
Compliance Statement
This report is AI-generated, for informational purposes only, and does not constitute investment advice, an offer, a solicitation or a recommendation to buy or sell any financial instrument or digital asset.
Sources
- [T1] Crypto Market 2025: Year-End Review & Expert Insights
- [T3] US Treasury yields surge to new highs as liquidity tightens, pushing Bitcoin back below $82,000 resistance
- [T4] Bitcoin Tests $70,000 As Intraday Squeeze Lifts Market | Cryptocurrency Market News liquidations | CryptoRank.io
- [T5] 🚨 INSTITUTIONAL MONEY IS STILL FLOWING… – Shah Faisal Shah
- [T6] Bitcoin Bear Market: Milder Trend Signals Institutional Shift
- [T7] 2026 Digital Asset Outlook: Dawn of the Institutional Era
- [T8] Crypto Funds See $3.55B Inflows: Bitcoin Leads as Ethereum and Solana Surge
Important Note / Wichtiger Hinweis:
EN: This report may have been generated using AI. It processes data from publicly available sources. The content is provided for informational purposes only.DE: Dieser Bericht kann mithilfe von KI erstellt worden sein. Dabei werden Daten aus öffentlich zugänglichen Quellen verarbeitet. Die Inhalte dienen ausschließlich Informationszwecken.
* DE: Die ergänzenden Inhalte können KI-generiert sein. EN: The additional content may be AI-generated.