
Listen to the summary
Key Data Snapshot
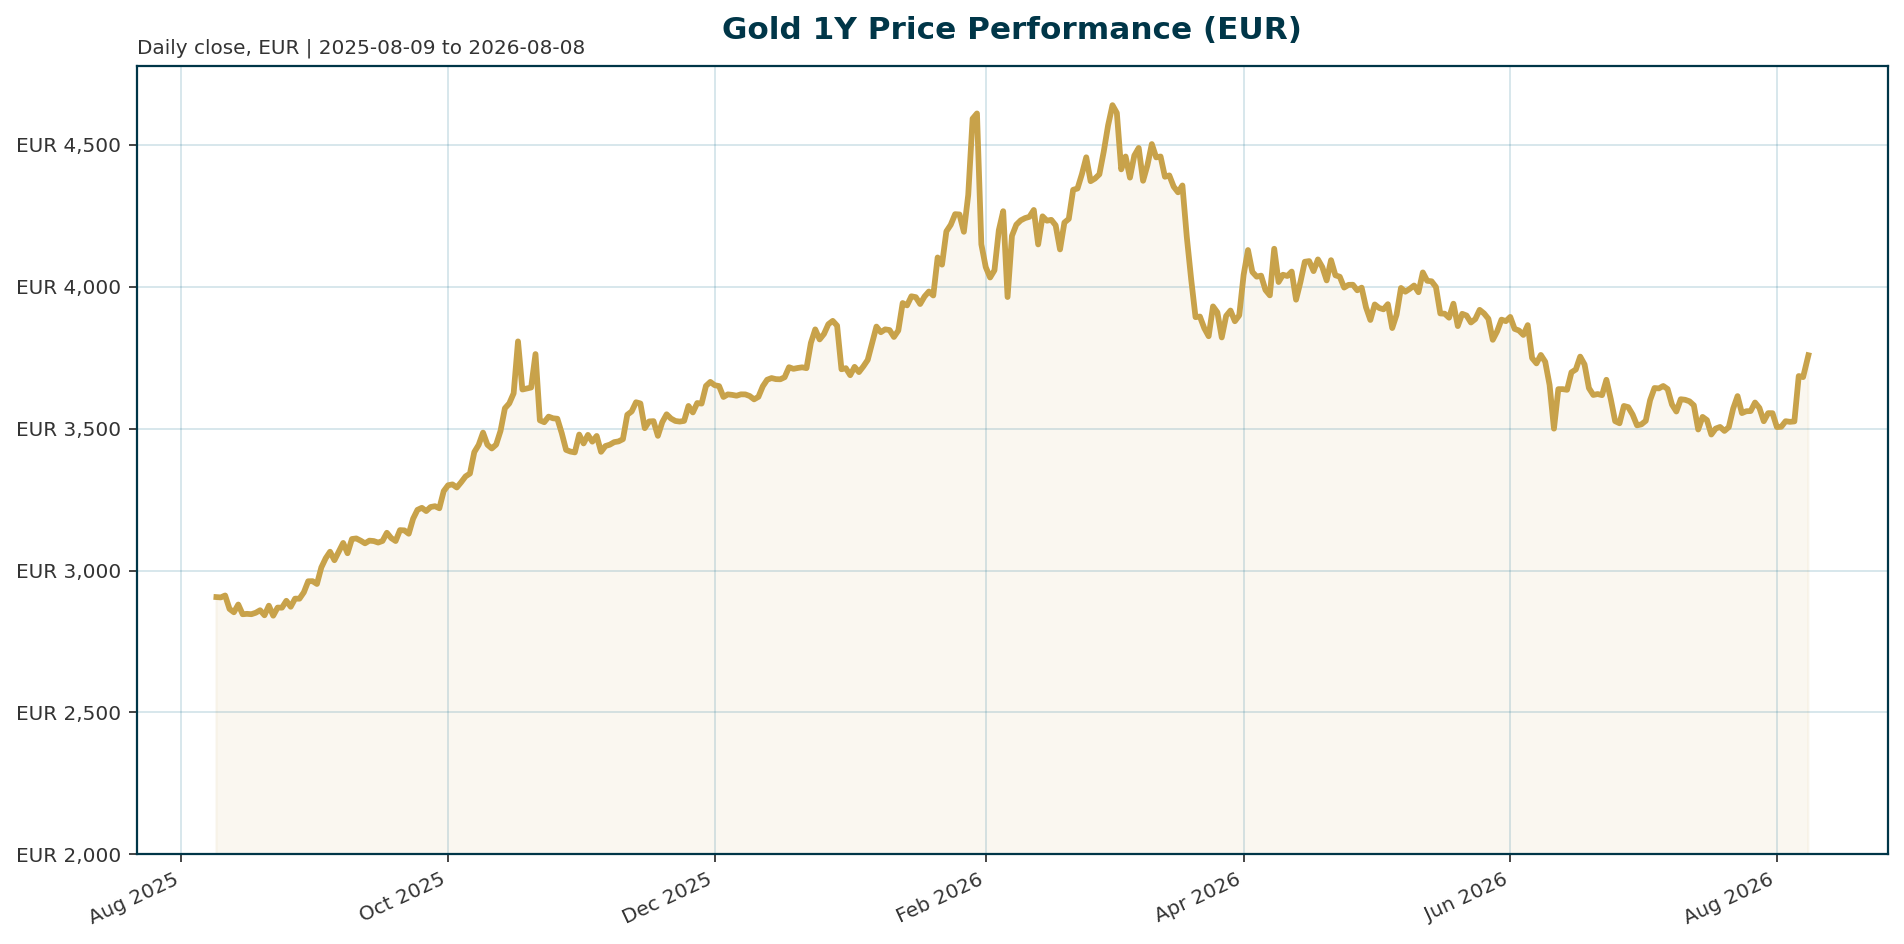
| Metric | Value | Interpretation |
|---|---|---|
| XAU/EUR spot | €3,750.72 | Near the 24h high of €3,769.55, signalling firm short-term momentum. |
| Performance | 24h: +2.1%; 7d: +7.3%; 14d: +7.1%; 30d: +6.9%; 200d: -6.7%; 1y: +28.2% | Strong recent rebound, but the 200d return remains negative. |
| 24h range | Low: €3,680.56; high: €3,769.55 | Range width: €88.99, equal to 2.37% of spot. Current price sits 78.8% through the 24h range. |
| All-time high | €4,688.32 on 2026-01-28 | Drawdown: (3,750.72 / 4,688.32 – 1) x 100 = -20.0%. Upside to regain ATH: +25.0%. |
| All-time low | €1,265.28 on 2019-11-17 | Gain from ATL: (3,750.72 / 1,265.28 – 1) x 100 = +196.4%. |
| Tokenized gold proxy market cap | €1.638bn | Refers to the listed/tokenized gold proxy in the bundle, not the global physical gold market. |
| 24h volume proxy | €134.9mn | Volume-to-market-cap ratio: 134.9mn / 1,637.7mn = 8.2%. |
| Supply proxy | Circulating supply: 436,554.238069; total supply: 436,554.238069 | Fully diluted valuation equals market cap. Max supply unavailable. |
| EUR investor context | EUR/USD: 1.1546; 5d: +0.24%; YTD: -1.76% | EUR translation remains relevant because most gold macro commentary is USD and Fed centred. |
Macro Backdrop
The immediate cross-asset backdrop is supportive but not decisive for gold. Risk sentiment is positive, equity momentum is moderately positive, and DACH indicators are broadly in line with global equities. The Nasdaq Composite has the strongest 5-day move at +3.00%, while the Hang Seng is the weakest at -1.31% over 5 days but leads on a 1-month basis at +6.07%. Euro area rates are mixed: the AAA 10Y yield is 3.15%, down 8.1 bp over 5 days, and the 10Y-2Y spread is 47.4 bp. FX is mixed: EUR/USD is 1.1546, up 0.24% over 5 days, while EUR/JPY has the strongest 5-day FX move at +0.54%.
For gold, the macro question is narrower: how inflation, energy prices and monetary-policy expectations affect real yields and the USD. Sources repeatedly identify real yields as the core cyclical driver because higher real yields raise the opportunity cost of holding a non-yielding asset such as gold [T1][T4]. Inflation data matter less as a standalone variable and more because they reshape expectations for Fed policy, Treasury yields and USD direction [T1]. Energy prices complicate this path by feeding inflation persistence and potentially delaying monetary easing [T5].
For EUR-based investors, the EUR/USD channel can either cushion or dilute the USD gold move. If EUR/USD weakens while USD gold is stable, XAU/EUR can rise mechanically. If EUR/USD strengthens, XAU/EUR can lag USD gold. Direct USD gold spot data are unavailable in the bundle, so this report keeps FX translation as a scenario variable rather than a measured attribution.
Investment Thesis
The central thesis is balanced: gold remains structurally supported by reserve diversification and portfolio demand, but tactically exposed to real-yield and USD shocks.
The bullish side rests on official-sector demand, debt sustainability concerns, inflation volatility and the role of gold as a real-asset diversifier. Several sources describe central banks as systematic buyers of gold as they diversify reserves away from dollar-based assets [T4][T6][T8]. This reserve-flow channel can reduce gold’s sensitivity to short-term rate expectations, although it does not eliminate it [T6].
The bearish side is cyclical. Gold does not generate income. When real yields rise, investors receive more compensation for holding inflation-adjusted fixed income, and the opportunity cost of gold rises [T1][T4]. A firmer USD and higher Treasury yields can therefore pressure bullion even when the long-term strategic case remains intact [T3].
At €3,750.72, XAU/EUR is up +28.2% over 1 year but down -6.7% over 200 days. This combination argues against chasing the move uncritically. It frames gold as a recovering long-cycle winner, not an asset already back at cycle highs. The base case is constructive but selective: maintain strategic exposure, add on real-yield relief or pullbacks, and reduce tactical aggressiveness if policy expectations turn hawkish again.
Bullish Drivers
- Reserve diversification: Central banks continue to diversify reserves, while sovereign debt levels and geopolitical fragmentation remain long-term tailwinds [T3].
- Visible official-sector demand: Recent commentary citing World Gold Council data states that central bank purchases rebounded in April after a March decline, with Poland remaining a major buyer and China extending its buying streak to 18 consecutive months [T3].
- Forward reserve intentions: The World Gold Council’s annual Central Bank Gold Reserves Survey is cited as showing that more global central banks are poised to increase gold reserves over the next year [T8]. Another source states that nearly 90% of respondents expect gold reserves to increase in the coming year [T7].
- Real-yield relief: If inflation moderates without second-round effects, policy expectations may shift toward a more moderate stance and real yields may become less burdensome for gold [T4].
- Stagflation hedge: A backdrop of slower growth with persistent inflation would remain supportive for gold over the longer term, even if the near-term rate path stays complicated [T5].
- Portfolio diversification: In a regime of volatile inflation, high public debt and concentration risk, gold retains a role as a diversifier across currencies and real assets [T8].
Momentum also supports the bullish case tactically. The 7-day gain of +7.3% exceeds the 30-day gain of +6.9% by 0.4 percentage points, showing recent acceleration. The 30-day return exceeds the 200-day return by 13.6 percentage points, suggesting a repair phase after a medium-term drawdown.
Relative Positioning vs Bitcoin and Ethereum
Gold should be positioned as a reserve asset and real-asset diversifier, not as a proxy for crypto beta. The bundle provides aggregate crypto context but no direct Bitcoin or Ethereum price, return, volatility or flow series. Bitcoin price data are unavailable. Bitcoin performance data are unavailable. Ethereum price data are unavailable. Ethereum performance data are unavailable.
| Metric | Available value | Implication |
|---|---|---|
| Bitcoin dominance | 56.76% | Crypto market concentration is high, but this does not support a direct BTC return comparison. |
| Total crypto market cap | €1.987tn equivalent in bundle context | Provides broad digital-asset scale, not BTC or ETH valuation detail. |
| Total crypto 24h volume | €45.89bn equivalent in bundle context | Shows aggregate crypto liquidity, not asset-specific liquidity. |
| Tokenized gold proxy market cap as share of total crypto market cap | 1.6377bn / 1,986.5bn x 100 = 0.082% | Only a proxy comparison. It is not a physical gold market share calculation. |
The evidence base for gold is fundamentally different from the evidence base available here for Bitcoin and Ethereum. Gold’s current support is linked to official-sector buying, reserve diversification and real-yield dynamics [T6][T8]. The bundle does not provide comparable BTC or ETH macro-flow evidence. If investors prioritise reserve diversification, debt concerns and real assets, gold has the clearer support in the supplied data. If risk appetite remains strong, Bitcoin and Ethereum may remain relevant alternatives, but no relative performance conclusion can be drawn from this bundle.
Scenario Framework
| Scenario | Macro conditions | XAU/EUR implication |
|---|---|---|
| Bull case | Inflation moderates, easing expectations revive, real yields soften, EUR translation does not offset gains, and central bank demand remains visible. | Gold can extend the repair phase. A return to the ATH of €4,688.32 requires +25.0% from spot. |
| Base case | Structural reserve demand offsets some cyclical pressure, while inflation data and rate expectations remain two-sided. | XAU/EUR remains range-bound but supported. The recent +7.3% 7-day move may slow without fresh real-yield relief. |
| Bear case | Inflation or energy shocks push real yields higher, the USD strengthens, and Fed expectations turn more hawkish. | Gold consolidates despite long-term diversification demand. A stronger EUR would add a further headwind for EUR-denominated returns. |
| Stagflation case | Growth slows while inflation remains sticky, creating policy uncertainty and demand for real assets. | Gold can retain medium-term support, but near-term price action may remain volatile if nominal and real yields rise first [T5]. |
Current rates and FX inputs matter for scenario calibration. Euro area AAA 10Y yield is 3.1467%, down 8.06 bp over 5 days. The 10Y-2Y spread equals (3.146678757 – 2.6725142222) x 100 = 47.4 bp. The 30Y-10Y spread equals (3.5969961326 – 3.146678757) x 100 = 45.0 bp. EUR/USD is 1.1546, up 0.24% over 5 days but down 1.76% YTD.
Valuation Discussion
Gold has no cash-flow valuation anchor. Valuation therefore depends on opportunity cost, reserve demand, portfolio insurance value and currency translation.
The opportunity-cost channel is the primary cyclical valuation input. One source cites 10-year TIPS real yields around 2%, high by recent standards but still within a historical band where gold has compounded [T2]. Other sources note that when real yields rise rapidly, gold comes under pressure because investors can earn higher real returns elsewhere [T4]. The bundle does not include a full real-yield time series, so this report cannot quantify the current real-yield impulse directly.
The reserve-demand channel is the key structural offset. Societe Generale commentary describes central bank purchases as a structural backstop that can absorb supply and reduce sensitivity to short-term interest-rate expectations [T6]. This is important for valuation: persistent reserve flows may allow gold to tolerate a higher real-yield environment than in older cycles. That remains a scenario, not a proven equilibrium.
Price levels show a mixed valuation signal. XAU/EUR is 20.0% below its January 2026 ATH, leaving meaningful recovery potential. It is also 196.4% above its 2019 ATL, so long-horizon appreciation has already been substantial. The tokenized gold proxy market cap is €1.638bn and FDV is also €1.638bn, but these figures describe the proxy market structure and should not be interpreted as the valuation of the global physical gold market.
Risks
- Real-yield shock: A renewed rise in real yields would raise the opportunity cost of holding gold and pressure valuation [T1][T4].
- Hawkish Fed repricing: If inflation surprises higher, markets may delay easing expectations, Treasury yields and the USD may rise, and gold would normally face pressure [T1].
- USD strength: Rising Treasury yields and a firmer USD are cited as near-term headwinds for bullion [T3].
- Geopolitical disappointment: Geopolitical headlines alone may not lift gold if they also raise energy prices, complicate inflation and keep rates higher for longer [T5].
- Central-bank demand concentration: Official-sector buying may slow or remain concentrated in a few countries, which would weaken the perceived structural backstop [T5][T3].
- Profit-taking: XAU/EUR is up +7.3% over 7 days and +6.9% over 30 days but remains -6.7% over 200 days. The rally may be vulnerable if it fails near the 24h high.
- EUR translation: EUR/USD is up 0.24% over 5 days but down 1.76% YTD. A material EUR strengthening could cause XAU/EUR to underperform USD gold.
- Data limitation: Direct real-yield data, Fed funds futures, ECB policy-rate expectations, oil prices, BTC prices and ETH prices are unavailable in the bundle.
Appendix
Data and methodology
- Report generated at: 2026-08-08T04:31:05.095025Z.
- Market data retrieved at: 2026-08-08T04:30:58.696204Z.
- Market overview data retrieved between: 2026-08-08T04:31:02.593602Z and 2026-08-08T04:31:05.092832Z.
- Asset: Gold, symbol XAU, quote currency EUR, coingecko_id pax-gold.
- Market cap, supply, volume and FDV metrics refer to the listed/tokenized gold proxy in the bundle, not the total physical gold market.
- Real-yield discussion relies on cited market commentary because the bundle does not include a real-yield time series.
- Bitcoin and Ethereum relative positioning is constrained by missing direct BTC and ETH price and return data.
Key calculations
- ATH drawdown: (3,750.72 / 4,688.32 – 1) x 100 = -20.0%.
- Distance to ATH: 4,688.32 – 3,750.72 = €937.60.
- Upside to ATH: (4,688.32 / 3,750.72 – 1) x 100 = +25.0%.
- Gain from ATL: (3,750.72 / 1,265.28 – 1) x 100 = +196.4%.
- 24h range width: 3,769.55 – 3,680.56 = €88.99.
- 24h range width as % of spot: 88.99 / 3,750.72 x 100 = 2.37%.
- Current location in 24h range: (3,750.72 – 3,680.56) / (3,769.55 – 3,680.56) x 100 = 78.8%.
- Euro area AAA 10Y-2Y spread: (3.146678757 – 2.6725142222) x 100 = 47.4 bp.
- Euro area AAA 30Y-10Y spread: (3.5969961326 – 3.146678757) x 100 = 45.0 bp.
- Tokenized proxy volume-to-market-cap ratio: 134,884,460 / 1,637,677,167 = 8.2%.
- Tokenized proxy market cap as share of total crypto market cap: 1,637,677,167 / 1,986,532,493,880.7349 x 100 = 0.082%.
Sources
- [T1] Gold approaches macro inflection as PCE data tests Fed outlook
- [T2] Central Banks Are Snapping Up Gold, ETF Investors Are Just Waking Up: The Best Gold ETFs to Own Before It Hits $5,000 – 24/7 Wall St.
- [T3] Central banks keep gold bullish long term | The Star
- [T4] Gold: Between inflation fears and diversification of reserves
- [T5] Geopolitics alone isn’t enough to lift gold | articles | ING THINK
- [T6] Gold’s Dual Drivers: Central Bank Flows and Real Yields, According to Societe Generale
- [T7] Both Gold and Silver Lose Key Support Levels! Has Last Year’s Get-Rich-Quick Myth Finally Ended? | Bitget News
- [T8] Gold suffers worst quarter in 13 years amid interest rate hike fears
This report is AI-generated, for informational purposes only, and does not constitute investment advice, an offer, or a solicitation to buy or sell any financial instrument.
Important Note / Wichtiger Hinweis:
EN: This report may have been generated using AI. It processes data from publicly available sources. The content is provided for informational purposes only.DE: Dieser Bericht kann mithilfe von KI erstellt worden sein. Dabei werden Daten aus öffentlich zugänglichen Quellen verarbeitet. Die Inhalte dienen ausschließlich Informationszwecken.
* DE: Die ergänzenden Inhalte können KI-generiert sein. EN: The additional content may be AI-generated.