
Listen to the summary
Key Data Snapshot
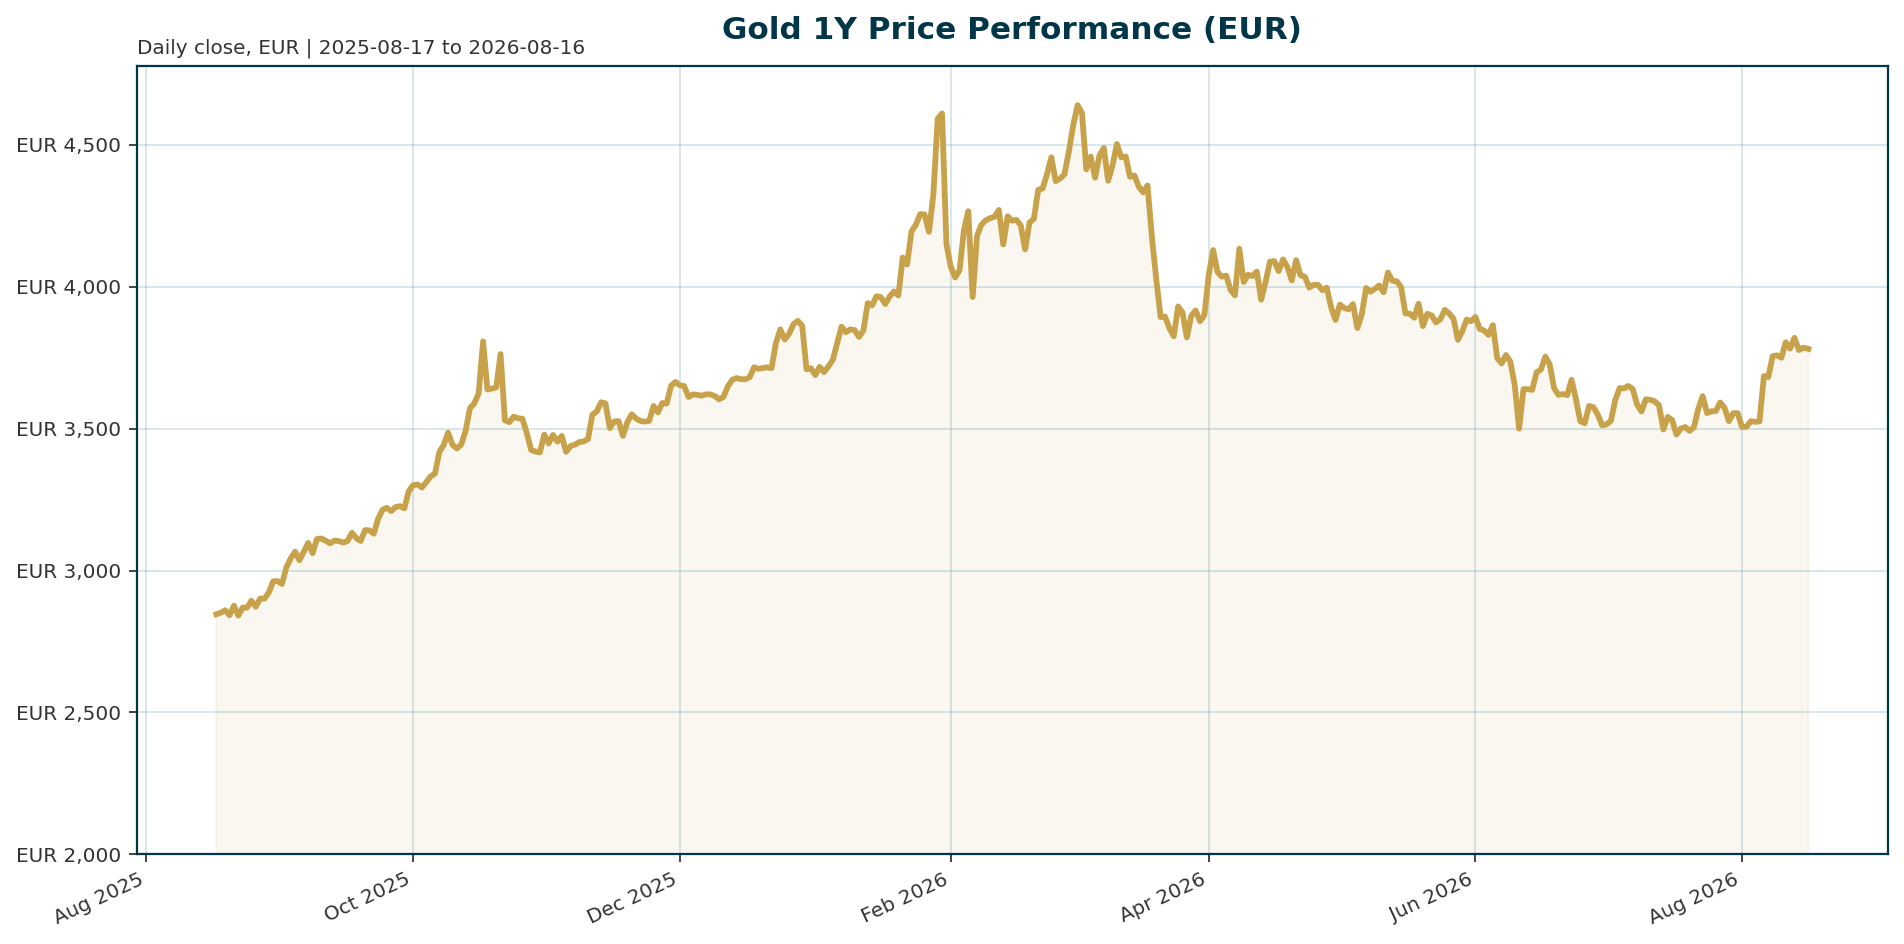
Gold (XAU) is consolidating at 3780.96 EUR after a robust 31.1% year-to-date rally, currently correcting 19.35% from its January 2026 all-time high of 4688.32 EUR. The asset remains in a pullback phase, evidenced by a negative 200-day return of -16.6%.
| Metric | Value | Change / Context |
|---|---|---|
| Spot Price (EUR) | 3,780.96 | Consolidating within 24h range (3,778.15 – 3,782.79) |
| Year-to-Date | +31.1% | Strong performance, trailing 200-day returns negative |
| ATH (Jan 2026) | 4,688.32 | -19.35% from current levels |
| 200-Day Return | -16.6% | Confirming ongoing correction phase |
Macro Backdrop
Risk sentiment is broadly neutral-to-positive, driven by strong equity momentum in DACH and Japan. The Nikkei 225 leads with a 5-day gain of 4.74%, while the DAX is up 5.76% over one month. The Euro area AAA 10Y yield sits at 3.16%, with the 10Y-2Y spread at 46.5 bp. FX markets are mixed, with EUR/CHF showing strength at 0.93873, while EUR/USD remains flat at 1.1553. Despite these positive equity signals, the backdrop for gold is complicated by a hawkish Fed stance and elevated real yields, which have triggered a worst-quarter performance in 13 years [T4].
Investment Thesis
Gold serves as a hedge against USD debasement and inflation volatility, supported by structural central bank diversification away from dollar-denominated assets [T5][T6]. The thesis relies on the decoupling of gold from equity markets, where traditional correlations are breaking down [T4]. While short-term headwinds from real yields persist, the fundamental shift in global reserve management provides a consistent floor under prices.
Bullish Drivers
- Structural Central Bank Demand: Global monetary authorities remain aggressively bullish, with 89% of respondents in the WGC survey expecting gold reserves to increase over the next 12 months [T8]. Central banks have accelerated accumulation to an average of 1,000t over the past four years, up from 500t in the preceding decade [T6][T8].
- Stagflationary Environment: A backdrop of slower growth alongside persistent inflation would bolster gold’s inflation hedge appeal [T2].
- Monetary Easing Expectations: The Federal Reserve is expected to deliver two 25bp rate cuts in September and December, which would lower real yields and make gold more attractive relative to interest-bearing assets [T2].
- Geopolitical Instability: Escalation of tensions provides a safe-haven premium, particularly for emerging markets prioritizing reserves for crisis hedging [T6].
Relative Positioning vs Bitcoin and Ethereum
While Bitcoin and Ethereum remain tightly correlated with risk-on market moves (evidenced by the strength of the Nasdaq and Nikkei), Gold is currently decoupling, offering distinct diversification benefits [T4]. Gold’s performance is driven by reserve diversification and geopolitical hedging, whereas crypto assets are primarily driven by speculative flows and technological innovation.
Scenario Framework
- Base Case: The Fed delivers two 25bp cuts (Sept/Dec). Real yields normalize. Gold consolidates 6-8% before rallying to USD 4800 [T1].
- Bull Case: Stagflation takes hold. Real yields collapse. Geopolitical risks spike. Gold breaks ATH and targets USD 5500+.
- Bear Case: Real yields spike due to sticky inflation. Fed delays cuts. USD strengthens. Gold suffers deeper correction.
Valuation Discussion
Current levels represent a 19% discount from the January 2026 ATH of 4688.32 [T4]. The negative 200-day return (-16.6%) suggests the market has fully priced in the correction. The 6-8% correction range cited by MOFSL aligns with the current pullback from peak levels [T1]. Valuation is supported by structural flows (CBs) rather than speculative excess, though short-term sentiment is cautious.
Risks
- Real Yield Headwinds: A sharp reversal in monetary policy leading to a rapid rise in real yields would be a severe headwind [T3][T5].
- Fed Hawkishness: Stronger-than-expected US economic data could delay Fed cuts, prolonging the high-for-longer rate environment [T2].
- Profit-Taking: Gold is up roughly 6% year-to-date, leaving the market vulnerable to bouts of profit-taking [T2].
Appendix
Sources
- [T1] Gold looks beyond war as inflation, monetary policy steer prices: Report | Commodity News – Business Standard
- [T2] Geopolitics alone isn’t enough to lift gold
- [T3] Both Gold and Silver Lose Key Support Levels! Has Last Year’s Get-Rich-Quick Myth Finally Ended?
- [T4] Gold suffers worst quarter in 13 years amid interest rate hike fears
- [T5] Gold’s Dual Drivers: Central Bank Flows and Real Yields, According to Societe Generale
- [T6] Central Bank Gold Purchases Hit 1,000t Average: WGC Survey
- [T7] Is it a golden era for gold? | J.P. Morgan Private Bank U.S.
- [T8] Central Bank Gold Reserves Survey 2026 | World Gold Council
This report is AI-generated for informational purposes only and does not constitute investment advice. The analysis is based on data available as of 2026-08-16 and should be independently verified before making investment decisions.
Important Note / Wichtiger Hinweis:
EN: This report may have been generated using AI. It processes data from publicly available sources. The content is provided for informational purposes only.DE: Dieser Bericht kann mithilfe von KI erstellt worden sein. Dabei werden Daten aus öffentlich zugänglichen Quellen verarbeitet. Die Inhalte dienen ausschließlich Informationszwecken.
* DE: Die ergänzenden Inhalte können KI-generiert sein. EN: The additional content may be AI-generated.