
Listen to the summary
Key Data Snapshot
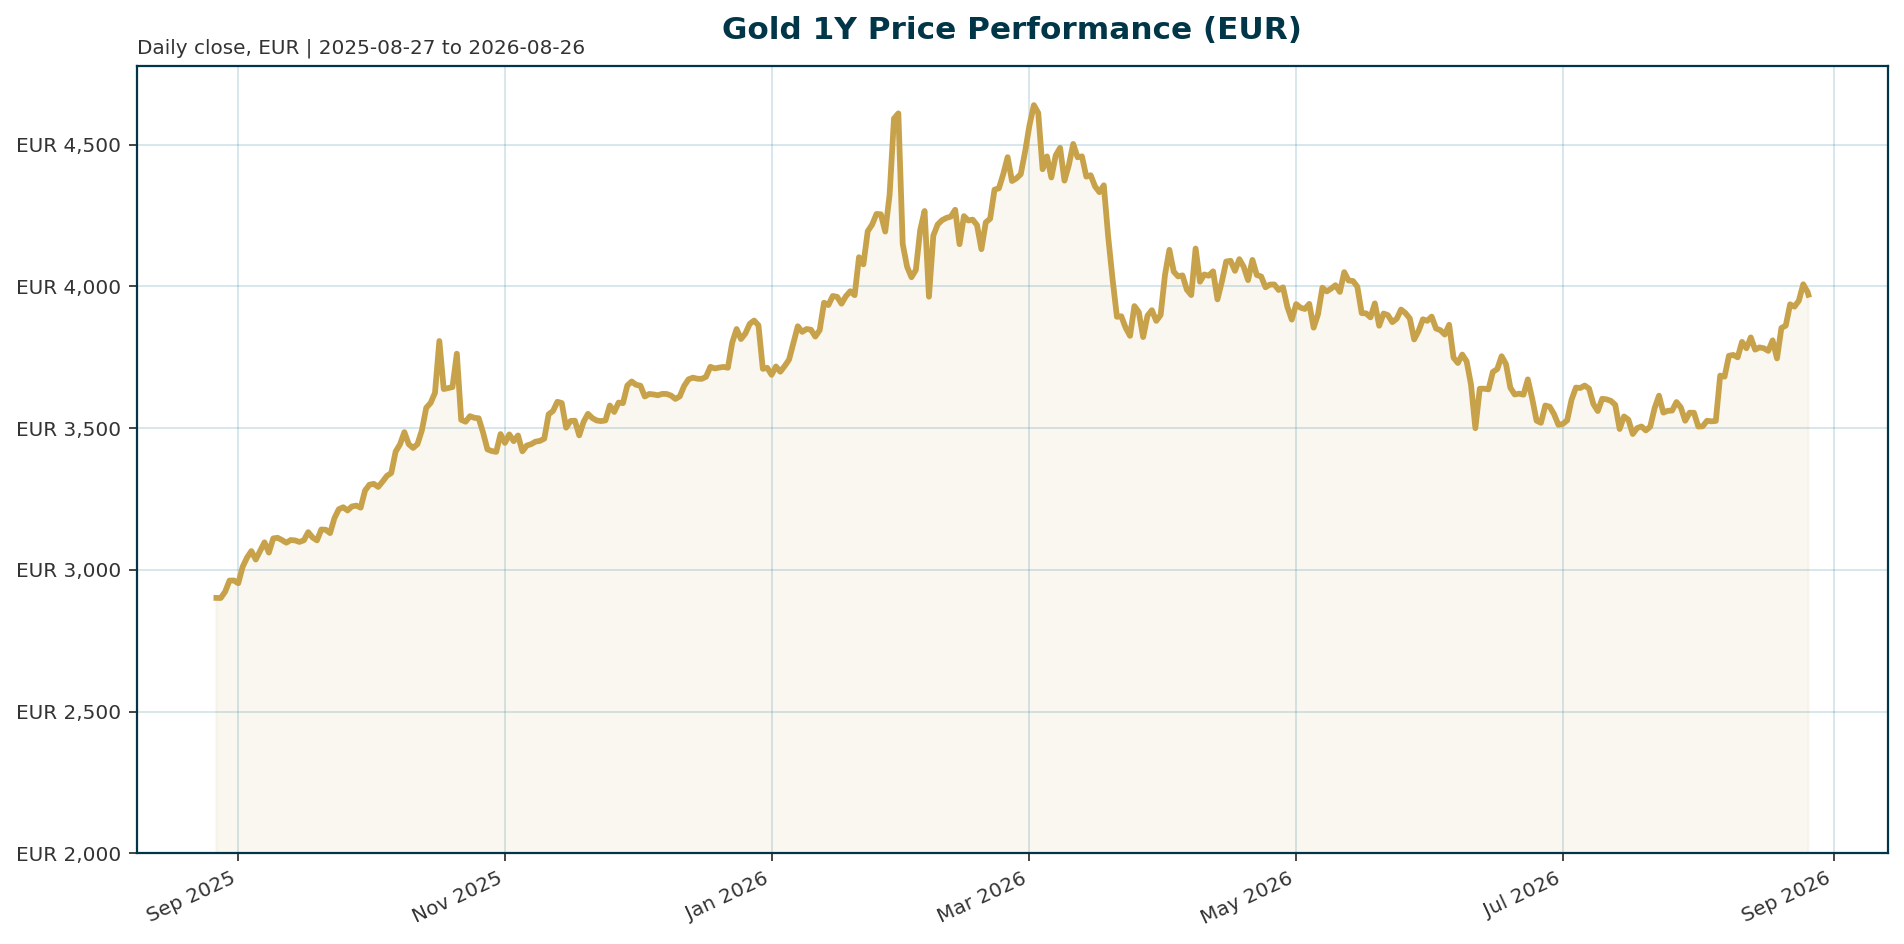
| Asset | Value |
|---|---|
| Current Price (XAU/EUR) | 3,974.55 |
| All-Time High (ATH) | 4,688.32 (Jan 2026) |
| 30-Day Change | +13.4% |
| 1-Year Change | +37.9% |
| Year-to-Date Change | -7.76% |
| Market Cap | 1.72 Billion EUR |
| BTC Dominance | 59.28% |
Macro Backdrop
Global risk sentiment remains neutral to positive with DACH equities outperforming global peers. The Euro Area AAA 10Y yield sits at 3.28% with mixed signals, while the EUR/USD pair trades at 1.1672. The ATX index leads regional performance with a 5-day gain of 1.20%, contrasting with the Nasdaq Composite which is the weakest 5-day performer at -0.68%. This divergence highlights a preference for regional stability over high-beta tech exposure.Investment Thesis
The investment thesis for Gold is anchored on a dual-driver framework. The primary structural support comes from persistent central bank diversification away from the US dollar, while the cyclical driver is the level of real interest rates. Despite a challenging monetary policy backdrop, real yields on the 10-year TIPS remain around 2% [T2], a level historically conducive to gold accumulation. The market is currently pricing in a “higher for longer” stance from the Federal Reserve, with inflation expectations remaining sticky due to elevated energy costs [T3][T8].Bullish Drivers
- Structural Central Bank Demand: The World Gold Council survey indicates nearly 90% of global central banks expect to increase reserves, providing a consistent floor under prices [T6][T7].
- Stagflationary Risks: A backdrop of slower growth alongside persistent inflation supports gold as a defensive hedge [T3].
- Policy Uncertainty: Ongoing debates regarding Federal Reserve leadership, such as the nomination of Kevin Warsh, introduce volatility that often benefits safe-haven assets [T8].
- ETF Awakening: Institutional capital is beginning to flow back into gold ETFs, suggesting the “hot money” phase is just starting [T2].
Relative Positioning vs Bitcoin and Ethereum
Gold maintains a distinct correlation profile compared to major cryptocurrencies. While Bitcoin dominance stands at 59.28%, gold’s performance is more closely tied to real yields and inflation data rather than pure risk sentiment. During periods of equity volatility, such as the Nasdaq’s recent underperformance, gold benefits from its traditional safe-haven status, whereas crypto assets often exhibit higher beta sensitivity to market liquidity and sentiment shifts [T6].Scenario Framework
- Bullish Case: Inflation moderates and the Federal Reserve begins a rate-cut cycle. Real yields fall below 1.5%, removing the opportunity cost of holding non-yielding assets and supporting XAU/EUR above 4,200.
- Bearish Case: Energy prices spike, reigniting inflation fears. The Fed maintains restrictive policy, causing real yields to rise above 2.5%. This environment favors the US dollar and could push XAU/EUR toward the 3,800 support level.
- Base Case: Inflation remains sticky but contained. The Fed holds rates steady, allowing real yields to hover near the 2% mark. Central bank buying absorbs selling pressure, resulting in price consolidation between 3,900 and 4,200.
Valuation Discussion
Current valuations reflect a market that has priced in significant structural shifts. Gold is trading approximately 15.2% below its January 2026 ATH of 4,688.32 EUR, despite a strong 1-year performance of +37.9%. The recent Q2 2026 performance, which saw the worst quarter since 2013, has reset some leverage, yet the asset remains significantly above its 2019 lows. The current price level suggests investors are paying a premium for the structural insurance provided by central bank diversification and potential stagflation risks.Risks
- Real Yield Spike: A hawkish pivot by the Federal Reserve could push real yields significantly higher, creating immediate headwinds for the metal [T1].
- USD Strength: A weakening EUR/USD could compress XAU/EUR prices, even if the metal performs well in USD terms.
- Profit Taking: The substantial year-to-date gains of 37.9% leave the market vulnerable to profit-taking from short-term speculative flows [T3].
- Geopolitical De-escalation: A reduction in global tensions could diminish the safe-haven premium without a corresponding drop in inflation or real yields.
Appendix
Sources
- [T1] Gold approaches macro inflection as PCE data tests Fed outlook
- [T2] Central Banks Are Snapping Up Gold, ETF Investors Are Just Waking Up
- [T3] Geopolitics alone isn’t enough to lift gold
- [T4] Gold looks beyond war as inflation, monetary policy steer prices: Report
- [T5] Gold’s Dual Drivers: Central Bank Flows and Real Yields, According to Societe Generale
- [T6] Both Gold and Silver Lose Key Support Levels! Has Last Year’s Get-Rich-Quick Myth Finally Ended?
- [T7] Gold suffers worst quarter in 13 years amid interest rate …
- [T8] Bank of America stands firm on 12-month $6,000 gold
This report is AI-generated for informational purposes only and does not constitute investment advice. Always conduct your own due diligence before making financial decisions.
Important Note / Wichtiger Hinweis:
EN: This report may have been generated using AI. It processes data from publicly available sources. The content is provided for informational purposes only.DE: Dieser Bericht kann mithilfe von KI erstellt worden sein. Dabei werden Daten aus öffentlich zugänglichen Quellen verarbeitet. Die Inhalte dienen ausschließlich Informationszwecken.
* DE: Die ergänzenden Inhalte können KI-generiert sein. EN: The additional content may be AI-generated.