
The altii-Gold-Report: Consolidation Within a Regime Shift
Date: 2026-09-23 | Asset: Gold (XAU) quoted in EUR | Spot: EUR 3,800.76
Listen to the summary
Key Data Snapshot
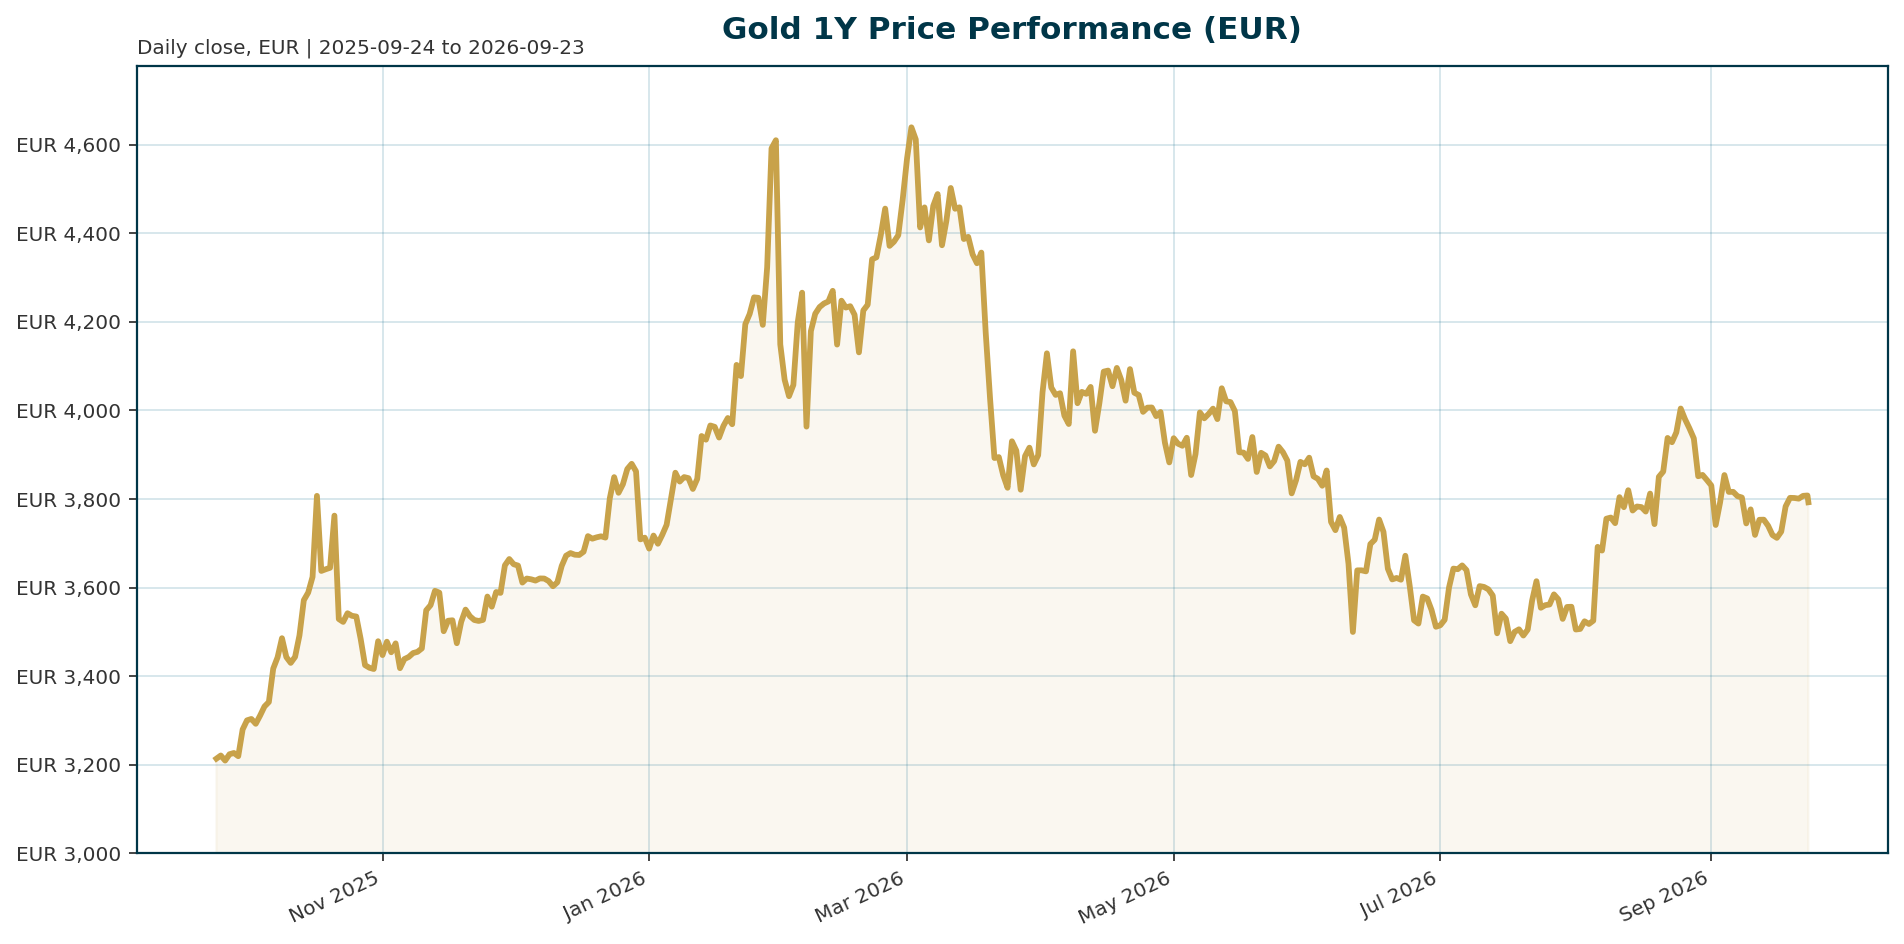
| Metric | Value | Comment |
|---|---|---|
| Spot XAU/EUR | EUR 3,800.76 | +0.52% 24h |
| 24h range | EUR 3,759.00 to 3,821.08 | Close sits ~67% of range: (3,800.76 − 3,759.00) / (3,821.08 − 3,759.00) |
| 7d / 14d | +0.42% / −0.94% | Short-term momentum stabilised |
| 30d / 200d | −6.33% / −15.94% | Orderly correction within the annual uptrend |
| 1y | +15.66% | Structural uptrend intact; 31.6pp swing between 200d and 1y readings |
| All-time high | EUR 4,688.32 (2026-01-28) | −18.93% below; +23.36% needed to reclaim (4,688.32 / 3,800.76 − 1) |
| All-time low | EUR 1,265.28 (2019-11-17) | +200.39% above |
| PAXG proxy market cap | EUR 1.653bn | 434,903.6 tokens × 3,800.76; tokenized segment only, not total gold market |
| PAXG 24h volume | EUR 158.8m | Tokenized venue only |
| BTC dominance / total crypto cap | 58.7% / USD 2.60tn | Cross-asset context |
Data note: Market data is sourced via the PAX Gold (PAXG) token proxy. Prices track spot XAU/EUR, but market cap, volume and rank reflect tokenized gold only. Short-term stabilisation after the 30-day pullback puts the metal in a EUR 3,750 to 3,850 near-term band; a close above EUR 3,850 to 3,900 would signal the correction from the January record is complete, while a loss of EUR 3,750 opens a retest of the 30-day trough zone.
Macro Backdrop
Market overview: Risk sentiment is neutral to positive with mixed equity momentum. The Nasdaq Composite leads five-day performance at +4.87% and the S&P 500 is up 2.82% over five days (+13.4% YTD), while DACH lags: the DAX manages only +0.68% over five days and the DACH average is 1.15% versus 2.80% for global indicators. Euro-area rates are mixed: the AAA 10Y yield is 3.47%, down 7.0bp over five days but up 52.6bp YTD, and the AAA 10Y-2Y spread sits at 32.6bp. FX is mixed: EUR/USD at 1.1480 is down 0.10% over five days and 2.31% YTD, with EUR/JPY the strongest five-day mover at +0.21%. For gold, the softer EUR and the near-term dip in euro yields are a modest translation and opportunity-cost tailwind for XAU/EUR right now, while firm global risk appetite diverts momentum capital elsewhere.
US policy is the swing factor. The Federal Reserve cut 75bp over six months to a 3.75% upper bound, then held for five months; 10-year TIPS real yields sit around 2%, and CPI remains in the 91st percentile of its 12-month range [T1]. The Fed held again this week, with Powell requiring clearer inflation progress; ING still expects two 25bp cuts in September and December [T3]. SocGen notes markets have shifted from pricing easing to debating whether the Fed hikes once or twice more, pushing two-year yields back above 4% [T2]. Energy prices rising on Middle East tensions keep inflation elevated and complicate easing [T3]. The ECB has turned neutral amid improved data and German fiscal stimulus, while the BoJ is normalising and several other central banks have signalled the end of their easing cycles [T5]. Underneath sits a heavily indebted sovereign backdrop, with advanced-economy debt ratios at or near post-war highs and debt burdens historically resolved through financial repression, inflation or currency depreciation [T4]. No current euro-area real yield or breakeven data is available in this bundle, so the real-yield analysis is USD-anchored.
Investment Thesis
The core thesis is a post-2022 regime shift that has decoupled gold from real yields. SocGen remains “strategically bullish,” arguing that despite persistently positive real yields gold trades near record highs because sustained central bank purchases, dedollarisation, geopolitical uncertainty and sovereign debt concerns provide a higher price floor that historical models do not capture [T2]. The flow evidence is substantial: central banks accumulated an average of 1,000t of gold over the past four years, double the 500t average of the preceding decade, and a record 43% of 73 surveyed monetary authorities expect to raise their own gold reserves over the next year [T6] [T7]. Per one report, central banks now hold more gold than Treasuries [T4].
Tactically, the metal is digesting the 2025 rally, which ended the year up roughly 65% with a fifth consecutive monthly gain in December, and the 2026 backdrop is more finely balanced [T5]. The bundle data confirms this: +15.66% over one year but −18.93% from the January record and −6.33% over 30 days is consolidation, not a trend break. Base case: the structural bid plus a neutral-to-easier policy path keeps gold in a range with upward drift, holding above EUR 3,500. Bull case: a faster Fed pivot combined with continued 1,000t-pace official buying challenges the EUR 4,688 record within 12 months. Bear case: higher-for-longer real yields, fading ETF flows and slower official accumulation at elevated prices allow a deeper mean-reversion.
Bullish Drivers
Weighted by evidence strength:
1. Central bank reserve accumulation. The strongest structural driver. 1,000t average purchases over four years versus 500t in the prior decade, with 92% of surveyed institutions citing interest rate levels and 90% citing gold’s crisis performance following the Middle East escalation; 95% of EMDE institutions view geopolitical instability as a key allocation driver versus 67% in advanced economies [T6].
2. Reserve diversification and sanctions hedging. States are reducing dollar reserve exposure to lower sanctions vulnerability, and countries near the Russia-Ukraine war zone are adding gold [T7].
3. Fiscal dominance risk. Post-war-high debt ratios imply financial repression or inflation as resolution channels, both gold-favourable [T4].
4. Inflation persistence and the Taylor Rule gap. SocGen argues even expected Fed hikes would not align policy with the Atlanta Fed’s Taylor Rule model, meaning inflation risks remain underpriced [T2]. Real yields around 2% are high by recent standards but still inside the band where gold has historically compounded [T1].
5. Q4 easing window. ING expects two 25bp cuts in September and December; a stagflationary mix of slower growth and persistent inflation would support gold longer-term [T3]. Lombard Odier sees current headwinds from higher yields and a stronger dollar as short-term rather than structural, with the macro context favouring real assets amid gradual purchasing-power erosion [T8].
Key caveat to each: central bank demand may prove less relentless at elevated prices, and much of the global easing cycle is already priced [T5].
Relative Positioning vs Bitcoin and Ethereum
Quantitative comparison is limited in this bundle: BTC/ETH price and performance series are unavailable, so positioning rests on aggregates and qualitative structure. BTC dominance stands at 58.7% and total crypto market capitalisation at USD 2.60tn with USD 106bn of 24h volume, territory that remains high-beta and risk-asset driven. With risk sentiment neutral to positive and the Nasdaq up 4.87% over five days, momentum capital typically favours crypto over gold in such regimes. On drawdown behaviour the contrast is stark: gold’s 30-day move of −6.33% and 18.93% distance from its record is an orderly correction, milder than typical crypto drawdowns. Structurally, gold holds a role no crypto asset replicates: central bank reserve status with zero counterparty risk [T6] [T7]. ETH offers staking yield but carries smart-contract and regulatory risk; BTC is a fixed-supply monetary asset but lacks official-sector adoption. Lower volatility is improving gold’s appeal to longer-term reserve managers rather than momentum traders [T2]. Net positioning: gold underperforms BTC and ETH tactically in risk-on windows but wins on a drawdown-adjusted and reserve-relevance basis. A sustained liquidity-driven melt-up favours crypto; a risk-off shock or a real-yield rally would see gold outperform both sharply.
Scenario Framework
Base (consolidation, highest probability weight). The Fed holds through Q3 then cuts modestly in September and December [T3]; 10y real yields stay in a 1.75% to 2.25% band [T1]; central bank buying continues near the 1,000t pace [T6]; ETF inflows stay positive though moderated [T2]. XAU/EUR ranges EUR 3,600 to 4,100 with upward drift. Monitoring: Fed dot plots, ETF flow weekly data, WGC quarterly demand reports.
Bull (regime acceleration). Triggers: an inflation shock paired with slowing growth forces earlier or deeper easing, real yields fall below roughly 1.5%, and the EUR stabilises. Official buying re-accelerates on reserve policy announcements from Asian and Middle Eastern holders [T4]. XAU/EUR retests and potentially exceeds the EUR 4,688 record; in USD terms, the USD 5,000 hurdle implies roughly 10% above the December high on some analyst targets [T5], translatable to EUR only with an explicit FX assumption since EUR/USD sits at 1.1480.
Bear (higher-for-longer). Triggers: energy-driven inflation forces a hawkish Fed reversal, real yields push above roughly 2.5%, ETF outflows persist, and central bank buying slows at elevated prices [T5] [T8]. XAU/EUR corrects toward the EUR 3,400 to 3,500 structural-support zone. SocGen’s counterargument bounds this case: it would take a materially larger inflation shock and a much more aggressive Fed response to generate another significant rates repricing, so downside risk appears increasingly limited [T2].
Valuation Discussion
Gold is best assessed as fairly valued within the new regime, with the key debate being the size and durability of the regime premium. Traditional real-yield models break down here: J.P. Morgan notes the inverse gold-real-yield relationship has broken down for two years [T7], and SocGen states explicitly that gold near record highs “breaking away from historical models that would imply significantly lower prices” reflects a structural floor [T2]. That gap between model-implied value and market price is the regime premium; it compresses the bear case but quantifies it. If the premium mean-reverts, traditional frameworks imply materially lower prices, which is why the EUR 3,400 to 3,500 bear target is credible despite structural support. On momentum-adjusted valuation, the 2025 entry conditions were overbought after a ~65% annual gain [T5]; the current 200d reading of −15.94% against +15.66% over one year shows the excess has partially reset without breaking the trend. At ~2% real yields, the opportunity-cost headwind is present but not prohibitive [T1] [T8]. Bull-valuation case: if dedollarisation accelerates or financial repression emerges, the regime premium expands and USD 5,000 becomes a magnet [T5]. One currency caveat: the ING figure of roughly +6% YTD is USD-denominated while the bundle quotes EUR; part of the EUR-quoted 1y return of +15.66% is currency translation given EUR/USD is 2.31% lower YTD, so the two must not be conflated.
Risks
Downside risks with monitoring indicators:
1. Higher-for-longer real yields. Lombard Odier’s primary risk list includes persistently elevated real yields, a prolonged ETF demand decline and lower physical jewellery demand [T8]. Monitor: 10y TIPS real yields above 2.5%.
2. Hawkish Fed reversal. A materially larger inflation shock forcing aggressive Fed tightening is the key tail risk; SocGen concedes this is what would trigger significant rates repricing [T2]. A single hot CPI print plus hawkish guidance could crystallise the bear path. Monitor: CPI, energy prices [T3].
3. Fading structural flows. Central bank demand may slow at elevated prices, and the easing cycle is largely priced [T5]. Monitor: WGC quarterly data, reserve policy announcements from Asia and the Middle East [T4].
4. Currency and rates headwinds. A stronger dollar and two-year yields back above 4% reassert if the hiking debate returns [T2]; euro-area AAA 2Y yields are up 103.9bp YTD, showing the yield reset is real even as five-day momentum is lower. A EUR appreciation would also subtract from EUR-quoted returns.
5. Profit-taking. With gold up roughly 6% YTD in USD terms, the market remains vulnerable to bouts of profit-taking, though deeper pullbacks should attract central bank and longer-term buyers [T3].
Appendix
Data provenance. Market data retrieved 2026-09-23T04:53Z via the PAX Gold (PAXG) token proxy (coingecko_id: pax-gold) as the spot XAU/EUR series; the token may trade at a small premium or discount to spot and its EUR 1.653bn market cap is not comparable to total above-ground gold value. Market-overview data sources: ECB AAA euro-area yield curve (2Y, 5Y, 10Y, 30Y, as-of 2026-09-21), Frankfurter FX rates (as-of 2026-09-23), FMP and Yahoo equity indices (as-of 2026-09-18 to 2026-09-22), Wiener Börse ATX (as-of 2026-09-22). The WGC 2026 Central Bank Gold Reserves Survey drew 76 respondents, collected between 5 February and 19 May 2026, the highest participation in the survey’s nine-year history [T6]. Source articles span May to September 2026 and reflect an evolving policy consensus, reconciled above by date and framing. Current EUR-denominated real yields and euro-area breakevens, and current BTC/ETH price series, are unavailable in this dataset.
Sources
- [T1] Central Banks Are Snapping Up Gold, ETF Investors Are Just Waking Up: The Best Gold ETFs to Own Before It Hits $5,000 (24/7 Wall St.)
- [T2] It’s time to get bullish on gold again, says SocGen (Kitco News)
- [T3] Geopolitics alone isn’t enough to lift gold (ING THINK)
- [T4] Report: Central Banks Now Hold More Gold Than Treasuries (CEOWORLD magazine)
- [T5] Gold 2026 Outlook: Fundamental XAU/USD analysis (Forex.com)
- [T6] Central Bank Gold Purchases Hit 1,000t Average: WGC Survey (Mexico Business News)
- [T7] Is it a golden era for gold? (J.P. Morgan Private Bank)
- [T8] Gold’s slowdown doesn’t signal a reversal (Lombard Odier)
Disclaimer: This report is AI-generated and for informational purposes only. It does not constitute investment advice, an offer, or a solicitation to buy or sell any asset. Data may contain errors or reflect proxy pricing; readers should verify figures independently and consult a licensed financial advisor before making investment decisions.
Important Note / Wichtiger Hinweis:
EN: This report may have been generated using AI. It processes data from publicly available sources. The content is provided for informational purposes only.DE: Dieser Bericht kann mithilfe von KI erstellt worden sein. Dabei werden Daten aus öffentlich zugänglichen Quellen verarbeitet. Die Inhalte dienen ausschließlich Informationszwecken.
* DE: Die ergänzenden Inhalte können KI-generiert sein. EN: The additional content may be AI-generated.