
Listen to the summary
Key Data Snapshot
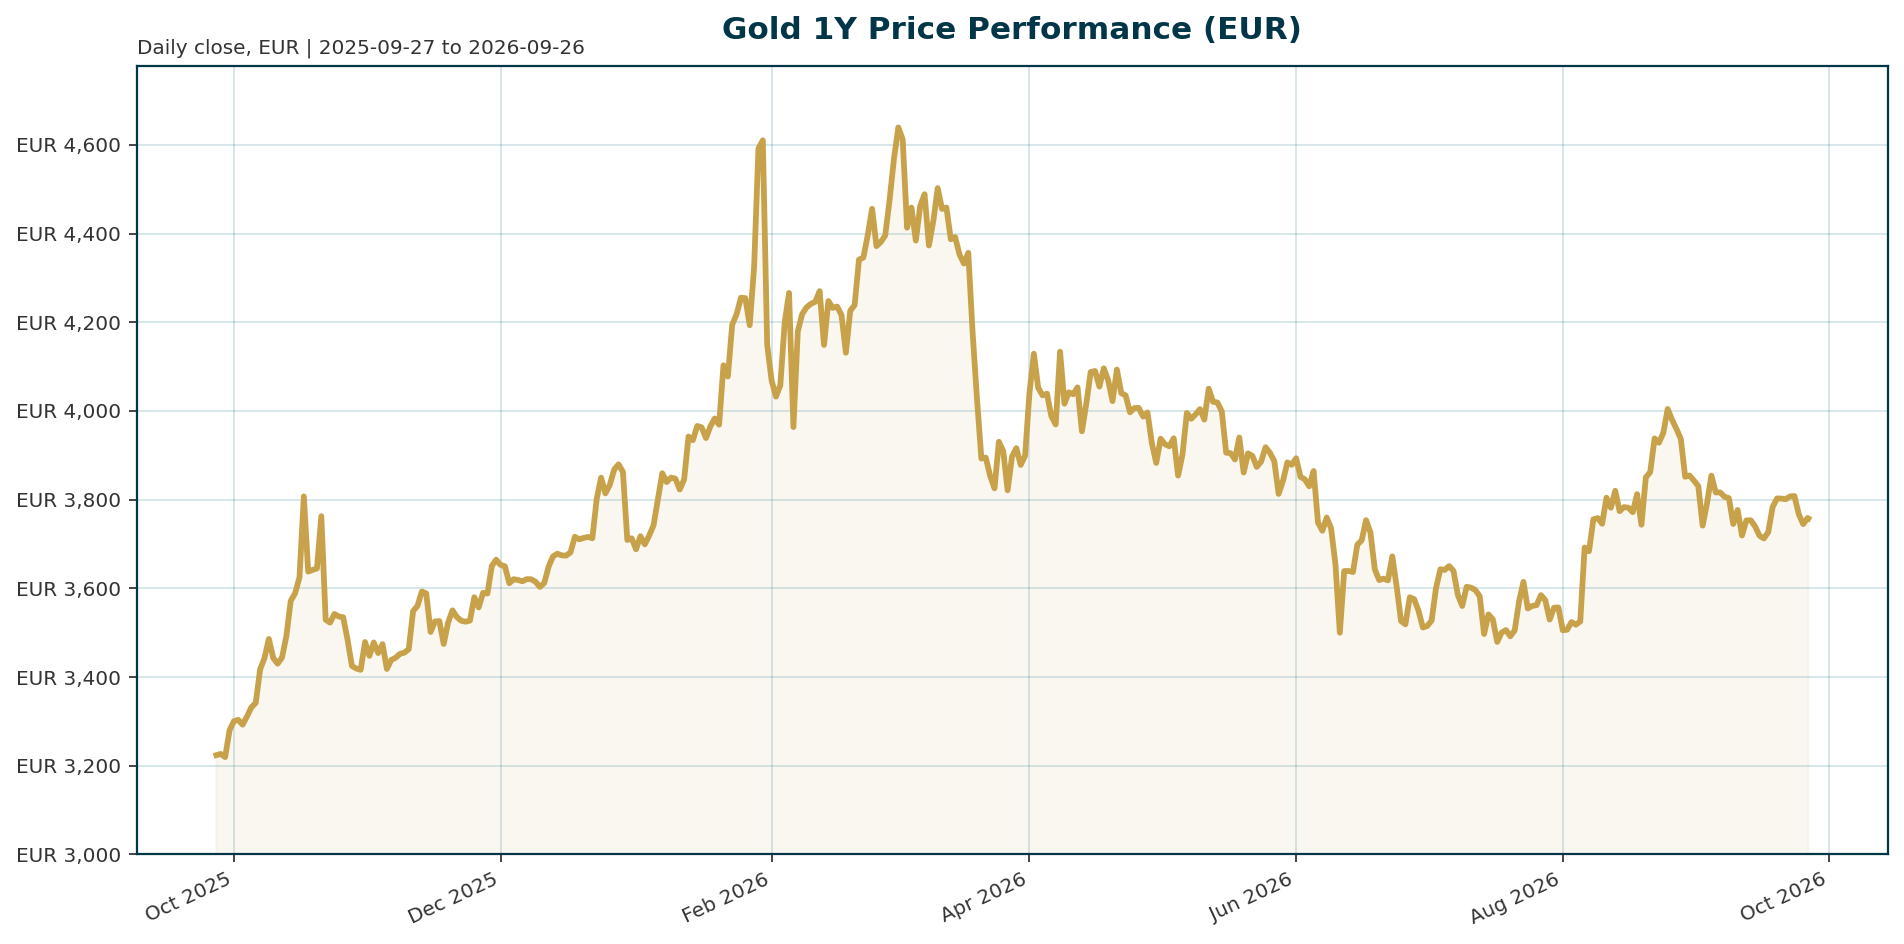
The altii-Gold-Report tracks XAU quoted in euro via tokenized gold (PAXG) as a proxy for spot LBMA gold. Data retrieved 2026-09-26 04:23 UTC.
| Metric | Value |
|---|---|
| Price (EUR) | 3,759.02 |
| 24h change | +0.25% (high 3,781.32 / low 3,732.88) |
| 7d / 14d change | -1.89% / -1.66% |
| 30d change | -7.34% |
| 200d change | -17.18% |
| 1y change | +14.31% |
| All-time high | EUR 4,688.32 (28 Jan 2026), price -19.82% below |
| All-time low | EUR 1,265.28 (17 Nov 2019), price +197.09% above |
| Proxy market cap / rank | EUR 1.63 bn, rank 55 |
| 24h volume | EUR 112.87 mn |
| Euro AAA 2Y / 10Y yield | 3.23% (+112 bp YTD) / 3.57% (+62 bp YTD) |
| Euro 10Y-2Y spread | 33.7 bp |
| EUR/USD | 1.1398 (-0.72% 5d, -3.01% YTD) |
Drawdown decomposition: the -17.18% move over 200 days against a +14.31% return over 12 months shows the correction is concentrated in the last six to seven months, i.e. after the January 2026 peak. The 1y gain net of the 200d loss implies an earlier-year appreciation on the order of +38% before the correction began. Implied value per token: EUR 1,634,791,263 / 434,898.62 tokens = EUR 3,759.02, consistent with a one-to-one ounce peg.
Macro Backdrop
Risk sentiment is neutral and equity momentum is mixed, with DACH indices broadly in line with global peers (DAX -0.65% over 5 days versus +0.31% for global equity indicators). Euro rates are the dominant local driver: the euro area AAA 10Y yield sits at 3.57%, up 62 bp year to date and 32 bp over the past month, while the 2Y has jumped 48 bp in a month, lifting the opportunity cost of holding non-yielding gold in euro terms. The FX backdrop is mixed: EUR/USD at 1.1398 has lost 2.22% over a month and 3.01% year to date, a weaker euro that mechanically supports the EUR-quoted gold price. Nikkei 225 leads on 5 days (+3.82%), Hang Seng lags (-2.13%), and the Nasdaq Composite leads one-month momentum (+3.59%). This environment gives gold neither a strong safe-haven bid nor a strong risk-off headwind; the rates channel is the most active variable.
The global framing: the historical inverse relationship between gold and real yields broke down after 2022. US ten-year real yields rose from roughly -1.2% to +2.5% between 2022 and 2023, conditions that historically crush gold, yet the metal held near record highs [T3]. ING notes gold’s direction now depends less on geopolitical headlines and more on how events shape inflation, monetary policy expectations and real rates [T2]. Note that euro-area inflation expectations data is not available in this bundle, so euro real-yield statements here are directional, not computed.
Investment Thesis
Gold has transitioned from a pure macro trade on real yields to a reserve cornerstone asset. The recent EUR-quoted correction, -19.82% from the January ATH and -7.34% over 30 days, is best read as tactical consolidation within a structurally supported market, not a regime reversal. The core argument: Société Générale identifies a clear post-2022 regime shift in which sustained central bank purchases, de-dollarisation trends, geopolitical uncertainty and sovereign debt concerns provide a higher price floor, limiting the downside impact of elevated real rates [T1]. The bank frames central bank flows and real yields as the two primary drivers, with official-sector buying absorbing supply and reducing gold’s sensitivity to short-term rate expectations [T4].
Supporting evidence: a record 43% of 73 surveyed monetary authorities expect their own gold reserves to increase over the next year [T6], and one report indicates central banks now hold more gold than US Treasuries in aggregate, a single-source claim we treat as indicative rather than verified [T5]. The bear-side counterweight is real: with gold up roughly 6% year to date in dollar terms, the market is vulnerable to profit-taking, and rising euro yields (+112 bp on the 2Y this year) steadily raise the EUR opportunity cost [T2]. The thesis holds if official-sector accumulation continues absorbing supply irrespective of rate expectations; it weakens if ETF inflows turn negative and central bank buying moderates as reserve values appreciate [T2][T3].
Bullish Drivers
- Structural official-sector demand. Emerging-market central banks diversifying away from the dollar provide a consistent price floor, a trend SocGen sees showing no signs of abating [T4].
- De-dollarisation and debt overhang. Public debt-to-GDP ratios at or near post-war highs in advanced economies historically resolve through financial repression, inflation or currency depreciation, all gold-favorable regimes [T5]. Sanctions risk pushes non-aligned nations toward gold reserves [T6].
- Stagflationary potential. Slower growth alongside persistent inflation, amplified by geopolitically driven energy prices, would support gold over the longer term [T2].
- Rate-cut optionality. ING’s US economists still expect two 25 bp Fed cuts (September and December), and Lombard Odier sees the Fed on hold for most of 2026 with a cut more likely late year; falling real yields re-assert the inverse relationship and support prices [T2][T7].
- Demand breadth. ETF inflows remain positive despite moderating, and lower volatility improves gold’s appeal to longer-term reserve managers [T1].
- Buy-the-dip structure. Deeper pullbacks likely attract central bank and long-term investor demand [T2]. Crux Investor frames the bull triggers explicitly: a dovish pivot before inflation is fully controlled, inflation moderation without aggressive hikes, or real-yield decline on economic weakness [T8].
Relative Positioning vs Bitcoin and Ethereum
Scale and liquidity differ by orders of magnitude. The total crypto market cap stands at EUR 2.54 trn with 24h volume of EUR 91.4 bn and Bitcoin dominance at 58.27%. The gold proxy’s EUR 1.63 bn market cap equals roughly 0.064% of the crypto complex, and its EUR 112.9 mn 24h volume is about 0.12% of crypto volume. These figures reflect the tokenized proxy, not the physical gold market, which trades in the trillions globally, but they illustrate why the proxy can gap and why crypto benchmarking of this instrument is directional at best. Ethereum-specific price data is not available in this bundle, so the comparison uses aggregates and qualitative sourcing.
Strategically, the two assets occupy opposite ends of the risk spectrum. Gold’s -19.8% drawdown from its January ATH is modest by crypto historical standards, where drawdowns of 50-80% are routine. Gold’s valuation rests on a reserve-driven floor and negative sensitivity to risk appetite; crypto valuations are pro-cyclical and flows-driven. In a broad risk-on environment, hedging demand for gold erodes and crypto outperforms [T3]. In a stagflation or tightening-stress scenario, gold’s official-sector floor should hold better than crypto’s flows-driven valuation, though both face pressure from rising real yields [T8]. For a EUR-based allocator, gold functions as portfolio insurance with a price, while crypto is a high-beta risk asset.
Scenario Framework
Probabilities below are analyst assumptions, not market-implied; no options or futures positioning data is available in this bundle.
- Base case (~50%): The Fed and ECB stay on hold, euro real yields plateau near current levels, and official-sector buying continues. EUR-gold ranges between roughly EUR 3,600 and EUR 4,100, below the ATH, with central bank bids capping downside [T2][T7].
- Bull case (~25-30%): A dovish pivot before inflation is fully controlled, or a stagflationary mix of slower growth and sticky inflation, pushes real yields lower. EUR-gold retests and challenges the EUR 4,688 ATH. Requires any one of the three Crux bull triggers to activate [T8].
- Bear case (~20-25%): The case futures positioning currently reflects: oil-driven inflation persists, the Fed, ECB, BoE and BoJ maintain or extend tightening, and real yields rise while risk-on equity markets reduce hedging demand [T8]. EUR-gold breaks the 30-day trend toward a deeper correction; the January ATH floor at roughly EUR 3,730-3,600 is tested.
- Tail case (low probability): A major sovereign liquidates reserves to stabilize public finances. The US, Germany and Italy held approximately 8,133 t, 3,350 t and 2,451 t respectively as of December 2025; any large-scale sale would weaken the structural price floor built over the past three years [T8].
Valuation Discussion
Gold has no cashflows, so discount-based valuation does not apply. Two anchors matter. First, the opportunity-cost anchor: euro nominal yields at 3.57% (10Y AAA) set the carry forgone by EUR holders, and the +112 bp YTD rise in the 2Y means the drag has intensified all year. Second, the reserve-flow anchor: gold is currently priced not by speculative flows alone but by fundamental shifts in global reserve management [T4].
The most informative valuation signal is the model gap. Historical real-yield models would imply significantly lower prices than today’s, and gold’s persistent break from those models is itself information about a structural floor [T1]. Against that framing, EUR 3,759 sits mid-range: 19.82% below the January ATH and 197.09% above the 2019 ATL. If the regime-shift premium is durable, current levels are fair, not stretched. If the floor erodes, through demand moderation as rising reserve values temper official buying [T3] or through sovereign liquidation [T8], fair-value anchors revert toward real-yield models at materially lower prices. We flag that euro-area inflation expectations are unavailable, so the euro real-rate picture cannot be quantified here.
Risks
- Higher-for-longer real yields. Extended tightening keeps the opportunity cost elevated. Crux Investor’s bear case assumes oil-driven inflation persists through mid-2026 and four major central banks hold or extend hawkish stances [T8]; energy-driven inflation complicates the easing path [T2].
- EUR-quote-specific drag. Rising euro nominal yields (2Y +112 bp YTD, 10Y +62 bp YTD) raise the EUR opportunity cost even if USD-gold holds steady. This is the active headwind in the snapshot data.
- Profit-taking after strong YTD gains. With gold up roughly 6% YTD in dollar terms, momentum unwinds are plausible, though central bank bids cushion deeper pullbacks [T2].
- Demand moderation. Appreciating reserve values may temper official buying, and ETF inflows could fade; a stronger dollar or US-China de-escalation would strip out embedded risk premium [T3].
- Sovereign reserve liquidation. A low-probability supply shock from any major holder, given US holdings of roughly 8,133 t, would undermine the structural floor [T8].
- Compound scenario. An oil spike, hawkish Fed/ECB and risk-on equities arriving together would simultaneously remove the safe-haven bid, raise the opportunity cost and erode hedging demand. If only one or two channels activate, the central bank floor limits downside [T4][T8].
- Proxy risk. The tracked instrument is tokenized gold, which can trade at a premium or discount to LBMA spot; the 1:1 peg currently holds arithmetically but is not guaranteed under stress.
Appendix
Data provenance. Market data retrieved 2026-09-26 04:23 UTC via CoinGecko for pax-gold; tokenized gold serves as a EUR-quoted proxy, not LBMA spot XAU/EUR. Euro area AAA yields are ECB yield-curve data as of 2026-09-24. FX comes from Frankfurter (EUR/USD, EUR/GBP as of 2026-09-26; EUR/JPY as of 2026-09-25). Equity indices as of 2026-09-25. Source vintage caveats: T2 references September and December rate-cut expectations and T8 references a -10% two-week drawdown and a mid-2026 oil-inflation base case; these items may predate the current date and should be treated as historical context, not live forecasts. All scenario probabilities are analyst assumptions with no market-implied calibration data available.
Compliance. This report is AI-generated, for informational purposes only, and does not constitute investment advice, a solicitation, or a recommendation to buy or sell any asset. Figures may contain errors; verify independently before acting.
Sources
- [T1] It’s time to get bullish on gold again, says SocGen | Kitco News
- [T2] Geopolitics alone isn’t enough to lift gold | ING THINK
- [T3] Gold in review: from pure macro trade to cornerstone asset | Saxo
- [T4] Gold’s Dual Drivers: Central Bank Flows and Real Yields, According to Societe Generale | CryptoRank.io
- [T5] Report: Central Banks Now Hold More Gold Than Treasuries | CEOWORLD magazine
- [T6] Is it a golden era for gold? | J.P. Morgan Private Bank U.S.
- [T7] Gold’s slowdown doesn’t signal a reversal | Lombard Odier
- [T8] Gold Declined 10% Over Two Weeks on Rising Oil Prices and Interest Rate Pressure | Crux Investor
Important Note / Wichtiger Hinweis:
EN: This report may have been generated using AI. It processes data from publicly available sources. The content is provided for informational purposes only.DE: Dieser Bericht kann mithilfe von KI erstellt worden sein. Dabei werden Daten aus öffentlich zugänglichen Quellen verarbeitet. Die Inhalte dienen ausschließlich Informationszwecken.
* DE: Die ergänzenden Inhalte können KI-generiert sein. EN: The additional content may be AI-generated.