
Watch the video
This player shows only the Gold chapter of the daily altii market briefing. Watch the full video on tube.altii.de.
Key Data Snapshot
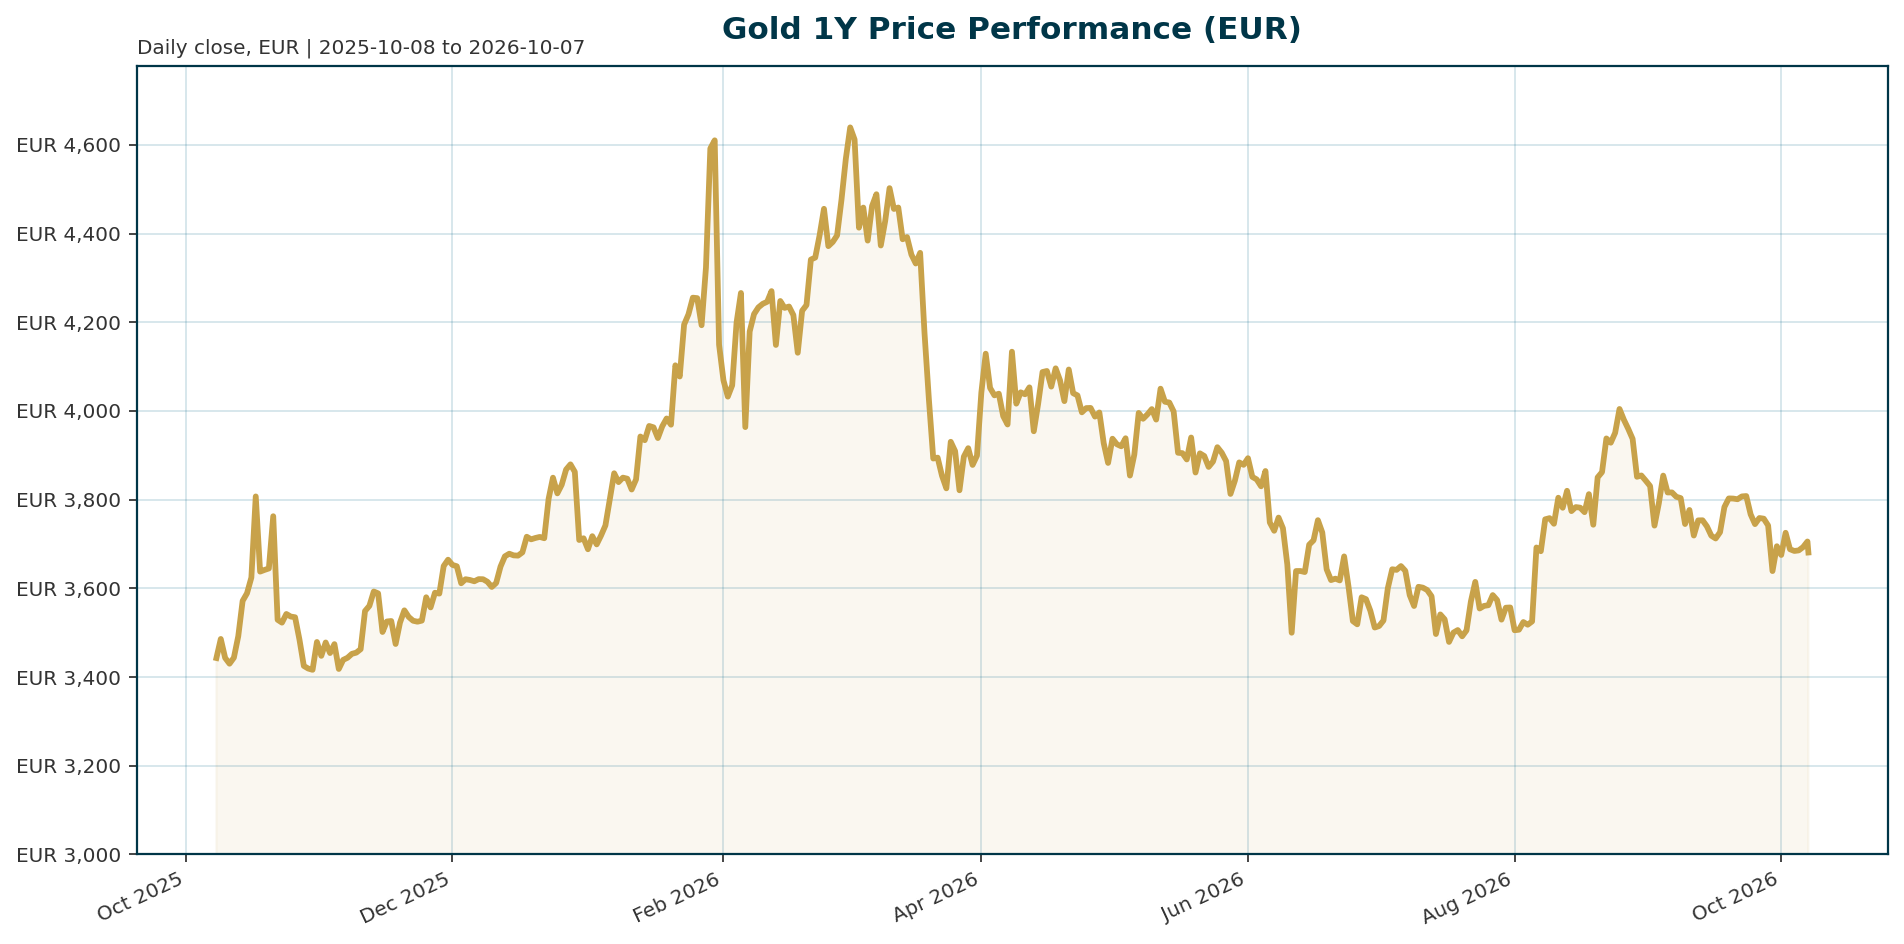
Data as of 2026-10-07 (04:48 UTC). The EUR-quoted series tracks the PAXG token (1 token = 1 fine troy ounce) as a gold proxy, not LBMA spot.
| Metric | Value | Note |
|---|---|---|
| Price (XAU-EUR) | EUR 3,690.47 | 24h range EUR 3,674.05 to 3,725.29 |
| 24h change | +0.24% | 1h +0.03% |
| 7d / 14d change | -0.87% / -4.19% | Short-term downtrend |
| 30d / 200d change | -5.83% / -8.13% | Mid-cycle correction |
| 1Y change | +4.34% | Modestly positive |
| All-time high | EUR 4,688.32 (2026-01-28) | Current price -21.28% |
| All-time low | EUR 1,265.28 (2019-11-17) | Current price +191.67% |
| Market cap | EUR 1,606.9m | Check: 3,690.47 x 435,445.99 = EUR 1.607bn, matches bundle |
| 24h volume | EUR 99.65m | Token-level, not spot-market liquidity |
| Circulating supply | 435,445.99 units | Approx. 13.5 tonnes backing (435,446 ozt / 32,150.7 ozt per tonne) |
| Euro AAA 10Y yield | 3.50% (-10.6bp over 5d) | As of 2026-10-05, ECB curve |
| Euro AAA 10Y-2Y spread | 50.5bp | 2Y at 2.997% |
| EUR/USD | 1.1239 | -0.40% 5d, -4.35% YTD |
30d EUR-terms drawdown decomposition: EUR-quoted change (-5.83%) minus EUR/USD 1m change (-3.25%) implies USD-terms gold fell roughly 2.6% over the month (approx. -5.83% + 3.25%, ignoring cross terms). About 3.3 percentage points of the EUR-quoted drawdown came from EUR strength, not USD-terms gold selling. A full 1Y decomposition is unavailable because the bundle lacks a 1Y EUR/USD change.
Macro Backdrop
Market overview. Risk sentiment is neutral and equity momentum is mixed, with DACH indicators lagging global equities (5-day average +0.03% versus +1.17%). The rates backdrop is constructive at the margin: euro area yields are falling with the curve steepening, the AAA 10Y at 3.50% down 10.6bp over 5 days and the 10Y-2Y spread at 50.5bp. FX is mixed, with EUR/USD at 1.1239 (-0.40% 5d, -4.35% YTD). Notable cross-asset observations: Nasdaq leads 5-day moves at +2.75%, Hang Seng is weakest at -2.02%, and Nikkei leads on a 1-month basis at +5.69%. This is context for the gold analysis below, not a substitute for it.
Global rates regime. The dominant macro force for gold is the hawkish repricing in USD rates. Markets have moved from pricing Fed easing to debating one or two further hikes, pushing the 2Y Treasury yield back above 4% [T1], and the US 10Y yield has broken above 5% while gold held above USD 4,000/oz [T2]. SocGen argues that with much of the hawkish adjustment already in the price, it would take a materially larger inflation shock and a far more aggressive Fed response to generate another significant rates repricing [T1].
Euro area. The ECB raised rates by 25bp in both June and September 2026 and remains data-dependent [T2]. Bundesbank President Nagel flagged supply-side inflation risks (energy inventories, refining capacity, fertilizer shortages) and oil rising from roughly USD 70 to above USD 100 following the US-Iran conflict, keeping the inflation narrative relevant for the foreseeable future [T2]. ING’s US economist still expects two 25bp Fed cuts later in the year, while a higher-for-longer environment would keep real yields elevated and pose a headwind for gold [T3].
Investment Thesis
The core thesis: gold is being re-anchored by structural reserve-management demand that overrides the traditional real-yield opportunity-cost model, making EUR-quoted gold a strategic hedge despite tactical rate headwinds. SocGen describes a post-2022 regime shift in which gold trades near record highs despite positive real yields, breaking away from historical models, with a structural floor from central bank purchases, dedollarisation, geopolitical uncertainty and sovereign debt concerns [T1]. Its dual-driver framework identifies central bank flows and real yields as the two primary forces, with official-sector buying reducing gold’s sensitivity to short-term rate expectations [T4].
The structural evidence is substantial. Gold’s share of global central bank reserves has risen from roughly 14% in 2023 to nearly 25%, and the Bundesbank sees the case for further diversification as strong [T2]. A record 43% of 73 surveyed monetary authorities expect their own gold reserves to increase over the next year [T6]. Central banks are reportedly on course for roughly 850 tonnes of net purchases in 2026, a third consecutive year of elevated accumulation, while global ETF holdings sit at a record 4,189 tonnes and US M2 grows at roughly 5.7% YoY [T7]. Public debt-to-GDP ratios in advanced economies at or near post-war highs suggest debt burdens will be resolved through some mix of financial repression, inflation and currency depreciation, all historically gold-favourable [T5].
The bear counterweight: the thesis weakens if a materially larger inflation shock forces a much more aggressive Fed response [T1], or if ETF demand enters a prolonged decline alongside weaker physical demand [T8]. Both conditions are stated as scenarios, not base conclusions.
Bullish Drivers
- Official-sector floor. Central bank buying provides a consistent price floor, absorbing supply and damping rate sensitivity [T4]. Gold now reportedly exceeds Treasuries in aggregate central bank reserves [T5].
- Reserve logistics signal urgency. The Dutch central bank moved roughly 86 tonnes from the US and Canada to London between March and August 2026 (over a quarter of its ~313 tonnes held in New York and Ottawa), cutting the US storage share from 31.3% to 18.5% and lifting London to 32.1% as part of crisis preparedness [T2].
- Inflation-hedge demand persists. Oil above USD 100 post US-Iran conflict, ECB hikes in June and September, and supply-side price risks keep the inflation narrative intact [T2].
- ETF flows recovered. After June’s -74 tonne outflow, September saw a +121 tonne recovery to a record 4,189 tonnes, showing structural demand reasserting itself through yield stress [T7].
- Monetary expansion. US M2 growth of roughly 5.7% YoY supports the debasement trade, though money growth alone is necessary but not sufficient [T7].
- EUR-specific cushions. EUR/USD weakness YTD (-4.35%) mechanically supports EUR-quoted prices versus USD terms, and the recent 10.6bp fall in the euro AAA 10Y yield eases the local opportunity-cost picture.
- Asymmetric risk after repricing. SocGen holds that with hawkish adjustment largely priced, downside risk for gold appears increasingly limited [T1].
Relative Positioning vs Bitcoin and Ethereum
The bundle declares ethereum as a benchmark asset but contains no ETH price, performance or market cap data, so the ETH leg of this comparison is explicitly unavailable and kept qualitative. Available anchors: total crypto market cap USD 2.554 trillion, 24h volume USD 80.3bn, and BTC dominance 58.79%.
Against that context, XAU-EUR’s 30d return of -5.83% and 1Y return of +4.34% describe a low-beta, consolidation-phase profile. The driver distinction matters: gold is priced by reserve flows and real yields [T4], while crypto assets are priced primarily by liquidity conditions and risk appetite. In the current neutral-risk, mixed-equity regime with DACH lagging global equities, gold’s lower volatility favours it as the defensive allocation; SocGen notes that lower volatility is improving gold’s appeal to longer-term reserve managers rather than short-term momentum traders [T1]. A risk-on pivot led by Nasdaq (+2.75% over 5 days) would tactically favour the crypto benchmarks, including ETH, over gold. Quantified ETH-versus-gold relative performance requires data outside this bundle and is flagged as a follow-up item.
Scenario Framework
- Bull case. Trigger: a faster Fed pivot to easing (ING’s economist expects two 25bp cuts in September and December [T3]), persistent inflation with oil above USD 100 [T2], and continued reserve accumulation announcements from Asia and the Middle East [T5]. Implication: gold re-rates toward and beyond the EUR 4,688.32 ATH. Structural acceleration would come from a move toward sustained negative real rates via financial repression [T5].
- Base case. Trigger: the Fed holds for much of 2026 with cuts only late in the year [T8], central bank purchases stay near the ~850 tonne pace [T7], and inflation remains sticky but bounded. Implication: XAU-EUR consolidates in a range below the ATH, with EUR/USD path and euro yield direction modulating EUR-quoted returns. Gold above USD 4,000/oz despite 5% US 10Y yields is the defining observation of this regime [T2].
- Bear case. Trigger: a materially larger inflation shock forcing a much more aggressive Fed response [T1], pushing real yields sharply higher. Confirmation signals: renewed ETF outflows on the scale of June’s -74 tonnes [T7], a prolonged ETF demand decline, or falling physical demand [T8]. Implication: XAU-EUR risks a deeper test toward the 200d-trend region; the central bank floor limits but does not eliminate downside.
Probabilities are analyst judgment, not model outputs. The near-term (6-12 month) yield and USD headwinds differ fundamentally from the multi-year debasement calculus; conflating the two horizons is the most common analytical error in precious metals [T7].
Valuation Discussion
The traditional opportunity-cost model says higher real yields should suppress a non-yielding asset. That model has broken down: real yields rose from deeply negative territory to post-GFC highs after 2022, yet gold was little changed in 2022 and posted +13% in 2023 to end at a then-record USD 2,068/oz [T6]. SocGen frames this as a regime shift where historical models would imply significantly lower prices than the market, with structural factors providing a higher floor [T1]. Model risk cuts both ways: if the regime shift is durable, the current -21.3% distance from the EUR ATH reflects the tactical yield headwind rather than structural overvaluation; if the shift proves cyclical, historical models imply materially lower fair value.
Position in range supports a mid-cycle read: XAU-EUR sits -21.28% below its January 2026 peak and +191.67% above its 2019 low, not at an extreme on either side. The monetary anchor argument (M2 +5.7% YoY) requires suppressed real yields and rising inflation expectations to fully transmit [T7]; with the ECB having hiked twice in 2026 [T2], that condition is only partially met. Valuation here is regime-dependent rather than model-determined, and we flag that euro-area inflation expectations and measured real-yield series are unavailable in this bundle, so real-yield statements rely on USD-market data from sources.
Risks
- Real-yield shock. A sharp monetary policy reversal driving a rapid rise in real yields is the primary headwind channel [T1][T4]. Higher-for-longer real yields top Lombard Odier’s risk list [T8].
- ETF demand reversal. June’s -74 tonne outflow demonstrates the yield sensitivity of near-term flows [T7]; a prolonged ETF decline plus weaker jewellery demand would compound [T8].
- Central bank buying slowdown. Official-sector purchases may slow [T3]; a slower-than-expected easing cycle would cap upside [T5]. The ~850 tonne 2026 estimate rests on a single lower-confidence source [T7].
- EUR appreciation risk. A EUR/USD rebound from 1.1239 would mechanically pressure EUR-quoted gold even if USD-terms gold holds. The 30d decomposition shows this channel already removed roughly 3.3 percentage points of EUR-terms value.
- Profit-taking. Gold up roughly 6% YTD in USD terms leaves the market vulnerable to bouts of profit-taking, and geopolitics alone is insufficient to sustain gains [T3].
- Token-structure risk. The EUR-quoted series tracks PAXG with roughly EUR 100m daily volume, a fraction of spot-market liquidity; token-level flows can diverge from physical market dynamics.
- Combined-risk scenario. A yield shock plus ETF outflows plus EUR strength could compound into a double-digit EUR-terms drawdown, echoing the current -21.3% distance from the January ATH.
Appendix
Methodology and Data Provenance
The EUR-quoted series reflects the PAXG token (coingecko_id pax-gold) as a gold proxy, retrieved 2026-10-07T04:48:35Z. Token-level market cap and volume understate spot-market liquidity. All Tavily sources are analyst commentary without verified publication dates and may reference mid-2026 conditions predating this snapshot; timeliness caveats apply. The T3 source URL appears malformed (https:/.ing.com/), a source-integrity issue we flag while citing its content. Central bank purchase volumes (~850t) and ETF tonnage (4,189t) derive from a single education-site source and carry lower confidence than ECB or SocGen statements. Oil price and US-Iran conflict details are single-source (T2) without corroboration in this bundle. Annualised volatility is not computable from bundle data and is stated as unavailable. A narrative gap exists between the January 2026 EUR ATH and the September-October commentary window that the sources only partially cover.
Market Overview Panel
| Instrument | Level | 1d | 5d | 1m | YTD |
|---|---|---|---|---|---|
| DAX | 25,449.19 | +0.77% | +0.99% | -2.29% | +3.91% |
| ATX | 6,792.23 | +0.68% | -0.93% | -0.96% | +27.78% |
| Euro Stoxx 50 | 6,242.10 | -0.17% | +0.96% | -2.52% | +7.69% |
| S&P 500 | 7,818.93 | +0.58% | +2.19% | +1.30% | +14.22% |
| Nasdaq Composite | 27,599.89 | +0.45% | +2.75% | +4.12% | +18.75% |
| Nikkei 225 | 70,174.92 | -0.72% | +1.77% | +5.69% | +39.40% |
| Hang Seng | 24,116.00 | -0.68% | -2.02% | -5.10% | -5.91% |
| Euro AAA 2Y | 2.997% | +0.5bp | -21.3bp | +12.0bp | +88.9bp |
| Euro AAA 5Y | 3.167% | +3.5bp | -18.3bp | +15.3bp | +72.7bp |
| Euro AAA 10Y | 3.502% | +3.8bp | -10.6bp | +15.5bp | +55.4bp |
| Euro AAA 30Y | 3.772% | +5.5bp | -5.8bp | +1.8bp | +29.4bp |
| EUR/USD | 1.1239 | +0.03% | -0.40% | -3.25% | -4.35% |
| EUR/CHF | 0.9333 | +0.04% | -0.34% | -0.69% | +0.34% |
| EUR/JPY | 177.69 | +0.04% | -0.26% | -1.73% | -3.31% |
| EUR/GBP | 0.8481 | -0.01% | -0.54% | -1.19% | -2.71% |
Yield data as of 2026-10-05 (ECB AAA curve); equities and FX as of 2026-10-06/07. The 5-day yield relief (-10.6bp to -21.3bp across the front) sits within a broader hawkish year (+55 to +89bp YTD), characterising a relief rally within a rising-rate environment.
Framework Glossary
Dual-driver framework: central bank flows and real yields as the two primary gold pricing forces [T4]. Two-horizon framework: separating 6-12 month tactical yield headwinds from multi-year structural debasement demand [T7]. Debasement trade: allocation into gold driven by fiat purchasing-power erosion, debt burdens and monetary expansion; analysts caution it does not imply a one-way rally [T2]. Financial repression: policy-driven sustained negative real rates, a powerful structural gold tailwind [T5].
Sources
- [T1] It’s time to get bullish on gold again, says SocGen | Kitco News. https://www.kitco.com/news/article/2026-09-03/its-time-get-bullish-gold-again-says-socgen
- [T2] Gold Holds Above $4,000 Even as US Treasury Yields Top 5%, Institutions Say Gold’s Pricing Logic Is “Re-Anchoring” | BigGo Finance. https://finance.biggo.com/news/ab4649ca-8e80-4243-b531-a667f953ddc2
- [T3] Geopolitics alone isn’t enough to lift gold | ING THINK. https:/.ing.com/articles/geopolitics-alone-isnt-enough-to-lift-gold (URL as provided; flagged as malformed)
- [T4] Gold’s Dual Drivers: Central Bank Flows and Real Yields, According to Societe Generale | CryptoRank.io. https://cryptorank.io/news/feed/e43c1-gold-central-bank-flows-real-yields-societe-generale
- [T5] Report: Central Banks Now Hold More Gold Than Treasuries | CEOWORLD magazine. https://ceoworld.biz/2026/06/15/report-central-banks-now-hold-more-gold-than-treasuries-what-that-means-for-global-capital-and-currencies
- [T6] Is it a golden era for gold? | J.P. Morgan Private Bank U.S. https://privatebank.jpmorgan.com/nam/en/insights/markets-and-investing/is-it-a-golden-era-for-gold
- [T7] Gold Price Prediction: 3 Frameworks for $4,000 and Beyond | Discovery Alert. https://discoveryalert.com/education/gold-price-prediction-frameworks
- [T8] Gold’s slowdown doesn’t signal a reversal | Lombard Odier. https://www.lombardodier.com/insights/2026/may/gold-s-slowdown.html
Disclaimer
This report is AI-generated and for informational purposes only. It does not constitute investment advice, a recommendation, or an offer to buy or sell any financial instrument. Data is provided as of the stated retrieval timestamps and may be incomplete or subject to revision. Readers should conduct their own analysis and consult a licensed advisor before making investment decisions.
Important Note / Wichtiger Hinweis:
EN: This report may have been generated using AI. It processes data from publicly available sources. The content is provided for informational purposes only.DE: Dieser Bericht kann mithilfe von KI erstellt worden sein. Dabei werden Daten aus öffentlich zugänglichen Quellen verarbeitet. Die Inhalte dienen ausschließlich Informationszwecken.
* DE: Die ergänzenden Inhalte können KI-generiert sein. EN: The additional content may be AI-generated.