
Watch the video
This player shows only the Gold chapter of the daily altii market briefing. Watch the full video on tube.altii.de.
Key Data Snapshot
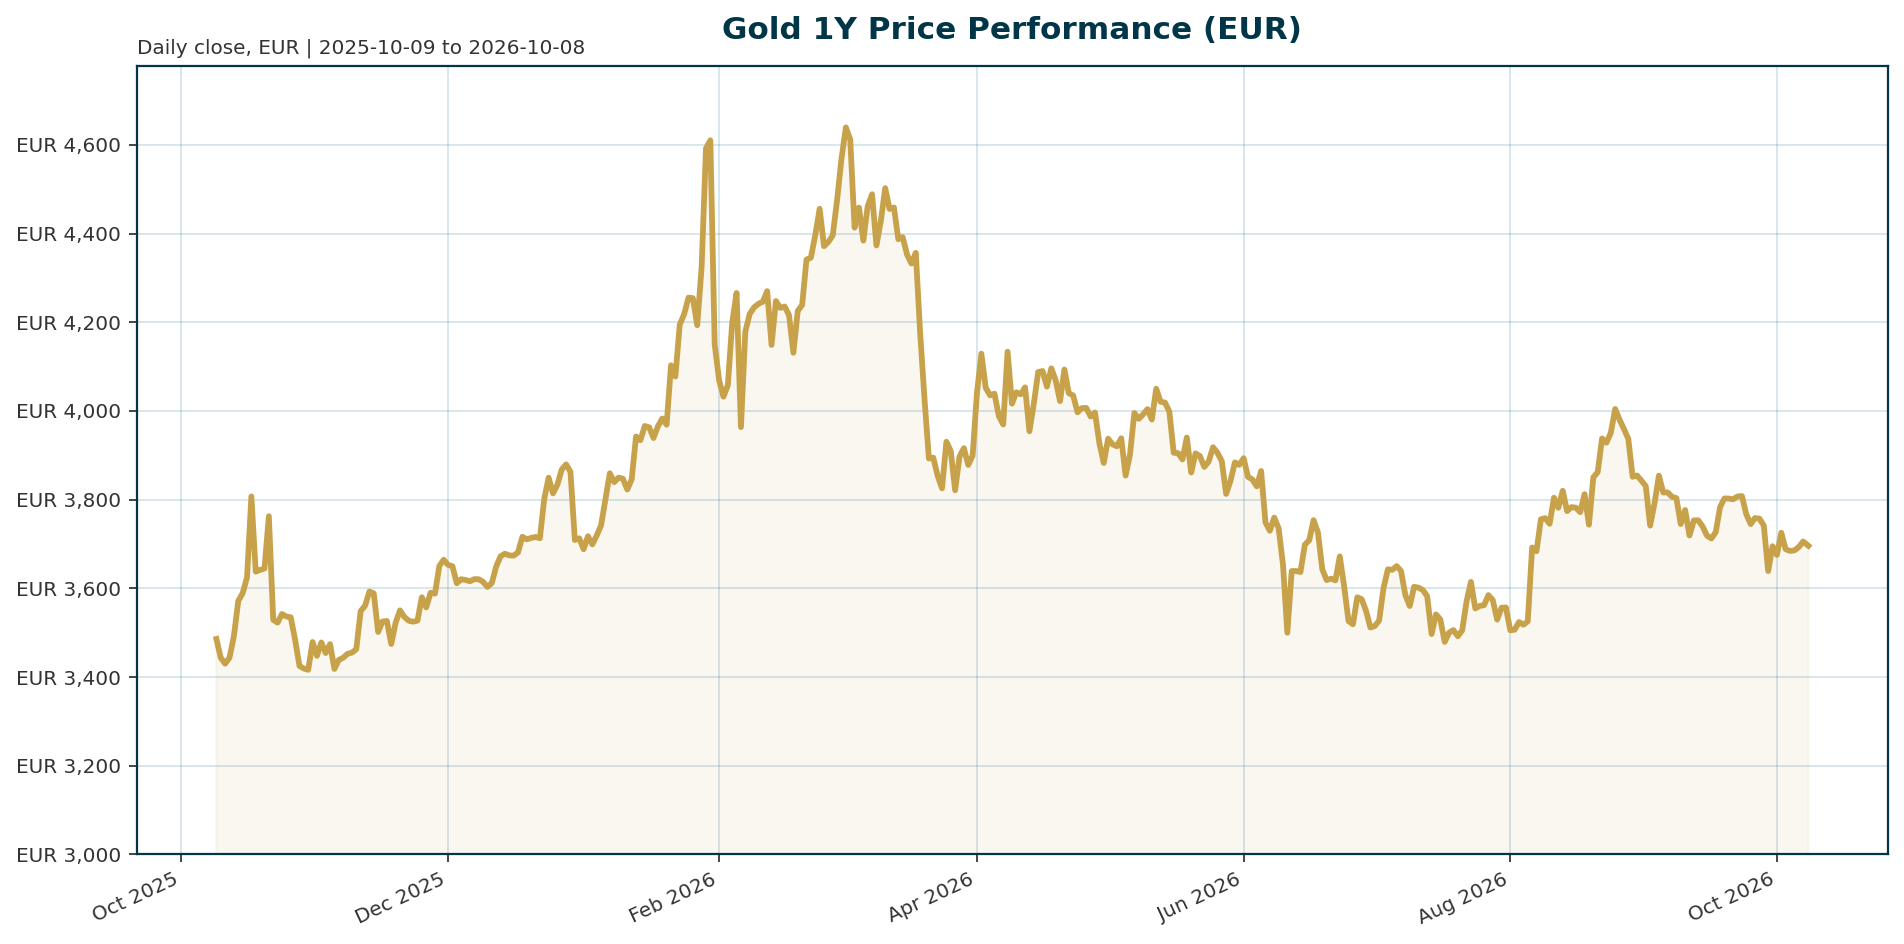
Gold in euro terms (XAU-EUR, proxied by the PAXG token) trades at 3,693.10 EUR, down 21.2% from its all-time high of 4,688.32 EUR set on 2026-01-28. The short-term tape is corrective: 30-day performance is -6.34%, 200-day is -8.01%, while the one-year return remains positive at +3.08%. The analytical question this report tests: is the -21.2% drawdown a tactical correction within a structurally re-anchored gold regime, or the start of regime decay?
| Metric | Value |
|---|---|
| Price (XAU-EUR) | 3,693.10 EUR |
| 24h range | 3,645.89 to 3,702.97 EUR |
| 24h change | +0.07% |
| 7d / 14d change | -0.59% / -3.38% |
| 30d / 200d change | -6.34% / -8.01% |
| 1y change | +3.08% |
| All-time high | 4,688.32 EUR (2026-01-28); current drawdown -21.23% |
| All-time low | 1,265.28 EUR (2019-11-17); current level +191.88% |
| Market cap (PAXG proxy) | 1.61bn EUR, rank 57 |
| 24h volume / circulating supply | 181.0m EUR / 436,653 tokens |
| USD context | Gold above $4,000/oz with US 10Y yields above 5% [T3]; up roughly 6% YTD in USD terms [T4] |
Drawdown calculation: (3,693.10 – 4,688.32) / 4,688.32 = -21.23%, consistent with the reported ATH change of -21.23%. The 30d (-6.34%) versus 200d (-8.01%) gap shows the correction is not accelerating; the most recent 24h print is flat-to-slightly-positive.
Macro Backdrop
Market overview: Risk sentiment is neutral and equity momentum is mixed, with DACH indices lagging global peers (DACH 5-day average -0.17% versus +1.32% for global indicators). The Nasdaq Composite leads on a 5-day basis at +2.48% while the ATX is weakest at -0.99%. The rates backdrop is mixed for euro yields: the euro area AAA 10Y yield sits at 3.52%, down 6.3bp over 5 days but up 57.1bp year-to-date, with a 10Y-2Y spread of 46.6bp. FX is mixed, with EUR/USD at 1.1233, down 0.41% over 5 days.
For EUR-quoted gold, the dominant macro force is a hawkish ECB. The ECB raised rates by 25 basis points in both June and September 2026, with policy now data-dependent on a meeting-by-meeting basis [T3]. Euro-area front-end yields confirm the tightening cycle: the AAA 2Y yield is up 94.4bp YTD to 3.05%, versus 57.1bp at the 10Y, a bull-flattening signature of policy-driven tightening. In the US, markets have shifted from pricing further easing to debating whether the Fed will hike once or twice more, pushing 2Y Treasury yields back above 4% [T2], while ING’s US economist still expects two 25bp cuts (September and December) with Powell requiring clearer inflation progress before easing [T4].
Inflation risk is live on the supply side. Oil has risen from roughly $70 before the summer break to above $100 following the US-Iran conflict, and Bundesbank President Nagel flags low energy inventories, damaged refining capacity, droughts and fertilizer shortages as additional upside risks to prices [T3]. US M2 money supply is growing at roughly 5.7% year-on-year as of October 2026 [T8]. A stagflationary mix of slower growth with persistent inflation would be supportive for gold over the longer term, while a higher-for-longer rate environment keeps real yields elevated and acts as a headwind [T4].
Investment Thesis
The core thesis is that gold’s pricing logic has re-anchored around central bank reserve flows and monetary debasement hedging, creating a structural floor that limits downside even as euro-area real yields rise. The EUR-quoted correction is tactical, not regime-ending.
The evidence for re-anchoring is direct: gold holds firmly above $4,000 per ounce in USD terms even with US Treasury yields above 5%, a combination the traditional opportunity-cost model cannot explain [T3]. Société Générale describes a clear post-2022 regime shift in which structural factors such as sustained central bank purchases, dedollarisation, geopolitical uncertainty and sovereign debt concerns provide a higher floor for gold prices, limiting the downside impact of elevated real rates [T2]. Its dual-driver framework identifies central bank flows as the structural backstop and real yield dynamics as the swing factor, with a sharp monetary policy reversal driving rapidly rising real yields as the main identified headwind [T5].
The official sector commitment is quantifiable. Gold’s share of global central bank reserves has risen from roughly 14% in 2023 to nearly 25%, according to Bundesbank President Nagel, who argues the case for further diversification remains strong [T3]. Advanced-economy public debt-to-GDP ratios sit at or near post-war highs, and history suggests such burdens get resolved through financial repression, inflation and currency depreciation, all scenarios in which gold tends to outperform [T6].
The bear-case counterweight must be stated plainly: if the regime premium fades because central bank buying slows, gold reverts toward opportunity-cost-implied levels well below current prices. ING warns that central bank buying may slow and that geopolitics alone is not enough to lift gold [T4]. The thesis holds as long as the official-sector floor absorbs ETF-driven volatility; it fails if policy reversal and flow fatigue coincide.
Bullish Drivers
- Central bank accumulation: 2026 purchases are tracking roughly 850 tonnes, a third straight year of historically elevated net buying [T8]. A record 43% of 73 surveyed monetary authorities expect their own gold reserves to increase over the next year, led by geopolitically exposed and sanctions-vulnerable nations [T7].
- Reserve repositioning beyond ownership: The Dutch central bank moved approximately 86 tonnes from the US and Canada to London between March and August 2026 for crisis preparedness, cutting the US share of Dutch gold from 31.3% to 18.5% and making London its largest storage location at 32.1% [T3]. Physical readiness signals institutional conviction.
- ETF flow recovery: Global gold ETF holdings reached a record 4,189 tonnes. The June 2026 outflow of -74 tonnes demonstrated yield sensitivity, but September’s +121-tonne recovery shows structural demand reasserting itself through yield stress rather than capitulating to it [T8].
- Monetary expansion: US M2 growth of roughly 5.7% year-on-year supports the debasement framework, historically potent when combined with suppressed real yields and rising inflation expectations [T8].
- Underpriced inflation risk: Société Générale notes that even expected Fed hikes would not align policy with the Atlanta Fed’s Taylor Rule model, suggesting inflation risks remain underpriced [T2]. Oil above $100 keeps the inflation narrative underpinning gold demand intact [T3].
- EUR-quote discount: With EUR/USD down 4.40% YTD and USD-gold up roughly 6% YTD [T4], euro-based investors have absorbed an approximate 10 percentage point currency drag on YTD performance. A euro reversal would mechanically lift the EUR price with no change in USD fundamentals.
Relative Positioning vs Bitcoin and Ethereum
Total crypto market capitalization stands at 2.518 trillion USD with 92.8bn in 24h volume; Bitcoin dominance is 58.73%. The bundle contains no Ethereum-specific price data, so the ETH comparison must be framed qualitatively; ETH is a designated benchmark asset but no ETH-EUR metrics are available in the provided data, and this is explicitly noted as unavailable.
Structurally, gold and crypto occupy different portfolio roles. The tokenized gold proxy (PAXG) has a market cap of just 1.61bn EUR, a fractional sliver of the physical gold market, and its 30-day return of -6.34% with a 21.2% drawdown from peak illustrates gold’s moderate volatility profile. Société Générale observes that lower volatility is improving gold’s appeal to longer-term reserve managers rather than short-term momentum traders [T2], the exact inverse of crypto’s momentum-driven flow profile. Analysts at the LBMA conference cautioned that the debasement trade does not imply a one-way rally [T3]; that caution applies doubly to crypto, which carries the debasement thesis without the central bank floor.
Tactically, neutral risk sentiment with the Nasdaq up 2.48% over 5 days favors crypto on momentum. Strategically, gold’s central-bank-supported floor gives it downside protection that crypto lacks. In a risk-off or debasement scenario, gold is the diversifier; in a risk-on melt-up, it will lag. Portfolio construction should treat the two as complements on the debasement theme, with gold as the low-beta anchor.
Scenario Framework
Base case (consolidation, 3,500 to 4,000 EUR): The ECB stays data-dependent after the June and September hikes [T3], the Fed delivers the cuts ING expects [T4] or holds with limited further tightening, and central bank buying continues near 850 tonnes [T8]. The central bank floor caps the downside while elevated euro real yields cap the upside. EUR/USD near 1.12 keeps the currency drag roughly neutral. Probability-weighted center of the distribution.
Bull case (revaluation, 4,200 to 4,700 EUR): Triggers are the oil shock persisting above $100 [T3], a faster-than-expected policy pivot compressing real yields [T6], and sustained ETF re-accumulation extending September’s +121-tonne recovery [T8]. Strong money growth with rising inflation expectations is the historically potent combination [T8]. EUR-gold re-tests the January high as structural buyers accelerate on real-yield relief.
Bear case (regime test, 3,200 to 3,400 EUR): A renewed hawkish repricing, an ECB hike beyond market pricing plus a hot US inflation print, drives real yields sharply higher and repeats the June ETF outflow dynamic (-74 tonnes) [T8]. Gold, up roughly 6% YTD in USD terms, is vulnerable to profit-taking [T4]. Mitigant: Société Générale argues much of the hawkish adjustment is already reflected in markets and it would take a materially larger inflation shock and a much more aggressive Fed response to generate another significant rates repricing, limiting the downside depth [T2]. A break of 3,500 EUR would attract central bank and long-term buyers on dips [T4].
Observable triggers: Reserve policy announcements from major Asian and Middle Eastern holders [T6]; ECB meeting-by-meeting decisions [T3]; the fiscal consolidation versus financial-repression debate in high-debt economies [T6]; monthly ETF flow data [T8].
Valuation Discussion
Under the conventional opportunity-cost model, positive real yields imply significantly lower gold prices than current levels [T2]. The market’s refusal to follow that model signals a regime premium: the question is whether that premium is justified or excessive.
Three frameworks apply [T8]. First, monetary expansion: US M2 at +5.7% YoY is necessary but not sufficient for higher gold; it needs suppressed real yields and rising inflation expectations alongside it. Current conditions are partially met, with inflation expectations elevated by the oil spike but real yields high. Second, the yield-stress channel: the record shows periods where nominal yields rose sharply alongside sustained gold appreciation, so elevated yields alone do not make gold expensive. Third, structural demand: roughly 850 tonnes of central bank buying against record ETF holdings of 4,189 tonnes constitutes a persistent bid that traditional valuation models ignore [T8].
The reserve-share trajectory offers a fair-value anchor. Gold at roughly 25% of central bank reserves, up from 14% in 2023 [T3], is still rebuilding toward historical norms from an era when gold played a larger monetary role; Nagel’s view that the diversification case remains strong [T3] suggests the revaluation is incomplete. Central banks now hold more gold than Treasuries in aggregate [T6], a structural marker of the regime shift.
Fairly valued (base): The EUR-quoted discount versus USD records is primarily a currency effect, not mispricing of the regime. Rich: If central bank buying slows as ING warns [T4], the regime premium fades and gold reverts toward opportunity-cost-implied levels materially below spot. Cheap: Continued reserve diversification toward a materially higher gold share combined with a financial-repression policy mix makes current levels attractive on a multi-year horizon [T6]. Note: euro-area real yields cannot be computed precisely without HICP inflation swap data, which is unavailable in this dataset; the real-yield assessment therefore rests on the nominal yield path and sourced US context.
Risks
- Real-yield spike: A sharp monetary policy reversal producing rapidly rising real yields is the explicitly flagged headwind [T5]. The ECB has hiked twice in 2026 and further moves are data-dependent [T3]; a higher-for-longer environment keeps real yields elevated against gold [T4].
- ETF flow fragility: June’s -74-tonne outflow demonstrates that yield pressure can trigger near-term selling [T8], and inflows moderated sharply this year even though they remain positive [T2].
- Central bank buying slowdown: ING warns official-sector buying may slow [T4]; the ~850-tonne 2026 estimate is a secondary-source projection, not verified primary data.
- Profit-taking: With gold up roughly 6% YTD in USD terms, the market is vulnerable to bouts of profit-taking, and the debasement trade does not imply a one-way rally [T4, T3].
- Inflation re-anchoring: If oil retreats from above $100 and inflation expectations fall, the inflation-hedge narrative weakens and the bull case loses its cyclical engine [T3, T4].
- Currency risk for EUR holders: A materially stronger euro would deepen EUR-quoted losses even if USD-gold holds. EUR/USD at 1.1233 with -4.40% YTD shows the drag runs both ways.
- Mitigants: Much of the hawkish adjustment appears already priced, limiting downside depth [T2], and deeper pullbacks historically attract central bank and long-term buyers [T4].
Appendix
Performance Table (XAU-EUR)
| Period | Change |
|---|---|
| 1h | +0.06% |
| 24h | +0.07% |
| 7d | -0.59% |
| 14d | -3.38% |
| 30d | -6.34% |
| 200d | -8.01% |
| 1y | +3.08% |
Euro Area AAA Yields (as of 2026-10-06)
| Tenor | Yield | 5d change | YTD change |
|---|---|---|---|
| 2Y | 3.05% | -10.7bp | +94.4bp |
| 5Y | 3.21% | -8.3bp | +76.8bp |
| 10Y | 3.52% | -6.3bp | +57.1bp |
| 30Y | 3.78% | -3.0bp | +30.0bp |
10Y-2Y spread: 3.5188% – 3.0523% = 46.6bp. Front-end yields are up more than long-end YTD, a policy-tightening signature.
FX (as of 2026-10-08)
| Pair | Level | YTD change |
|---|---|---|
| EUR/USD | 1.1233 | -4.40% |
| EUR/CHF | 0.9343 | +0.44% |
| EUR/JPY | 177.75 | -3.28% |
| EUR/GBP | 0.84773 | -2.74% |
Equity Context
DAX 25,104 (-3.47% 1m, +2.51% YTD); ATX 6,612 (-0.99% 5d, +24.38% YTD); Euro Stoxx 50 6,176 (+6.55% YTD); S&P 500 7,802 (+13.97% YTD); Nasdaq 27,539 (+18.49% YTD); Nikkei 225 69,214 (+37.49% YTD); Hang Seng 23,904 (-6.74% YTD).
Methodology and Data Notes
The XAU-EUR price is proxied by the PAXG tokenized gold instrument (436,653 circulating tokens, fully diluted valuation 1.61bn EUR; 1,612,457,858 / 436,653 = 3,693.10 EUR per token, confirming token price equals reported spot). Any premium or discount of the token versus physical bullion is unknown and not captured here. USD-gold levels ($4,000/oz, +6% YTD) derive from news sources, not bundle market data, and are labeled as sourced approximations. Central bank purchase volumes (~850t) and reserve-share figures (~25%) come from secondary commentary and are indicative. Oil prices and M2 growth are context from commentary, not verifiable bundle data. Ethereum-specific price data is unavailable in this dataset. News items lack publication dates; institutional views (SocGen, ING) may be stale relative to the 2026-10-08 data, and ING’s expected September Fed cut has likely already passed. Data timestamps: market data 2026-10-08T04:47Z; ECB yield curve 2026-10-06; equities 2026-10-07/08.
Sources
- [T1] Finding value in today’s commodity cycle (Boston Partners)
- [T2] It’s time to get bullish on gold again, says SocGen (Kitco News)
- [T3] Gold Holds Above $4,000 Even as US Treasury Yields Top 5% (BigGo Finance)
- [T4] Geopolitics alone isn’t enough to lift gold (ING THINK)
- [T5] Gold’s Dual Drivers: Central Bank Flows and Real Yields, According to Societe Generale (CryptoRank)
- [T6] Central Banks Now Hold More Gold Than Treasuries (CEOWORLD)
- [T7] Is it a golden era for gold? (J.P. Morgan Private Bank)
- [T8] Gold Price Prediction: 3 Frameworks for $4,000 and Beyond (Discovery Alert)
Disclaimer
This report is AI-generated and provided for informational purposes only. It does not constitute investment advice, a recommendation, or an offer to buy or sell any financial instrument. Figures are derived from automated data retrieval and secondary sources that may be incomplete or outdated. Readers should conduct their own analysis and consult a licensed advisor before making investment decisions.
Important Note / Wichtiger Hinweis:
EN: This report may have been generated using AI. It processes data from publicly available sources. The content is provided for informational purposes only.DE: Dieser Bericht kann mithilfe von KI erstellt worden sein. Dabei werden Daten aus öffentlich zugänglichen Quellen verarbeitet. Die Inhalte dienen ausschließlich Informationszwecken.
* DE: Die ergänzenden Inhalte können KI-generiert sein. EN: The additional content may be AI-generated.