
Watch the video
This player shows only the Gold chapter of the daily altii market briefing. Watch the full video on tube.altii.de.
Key Data Snapshot
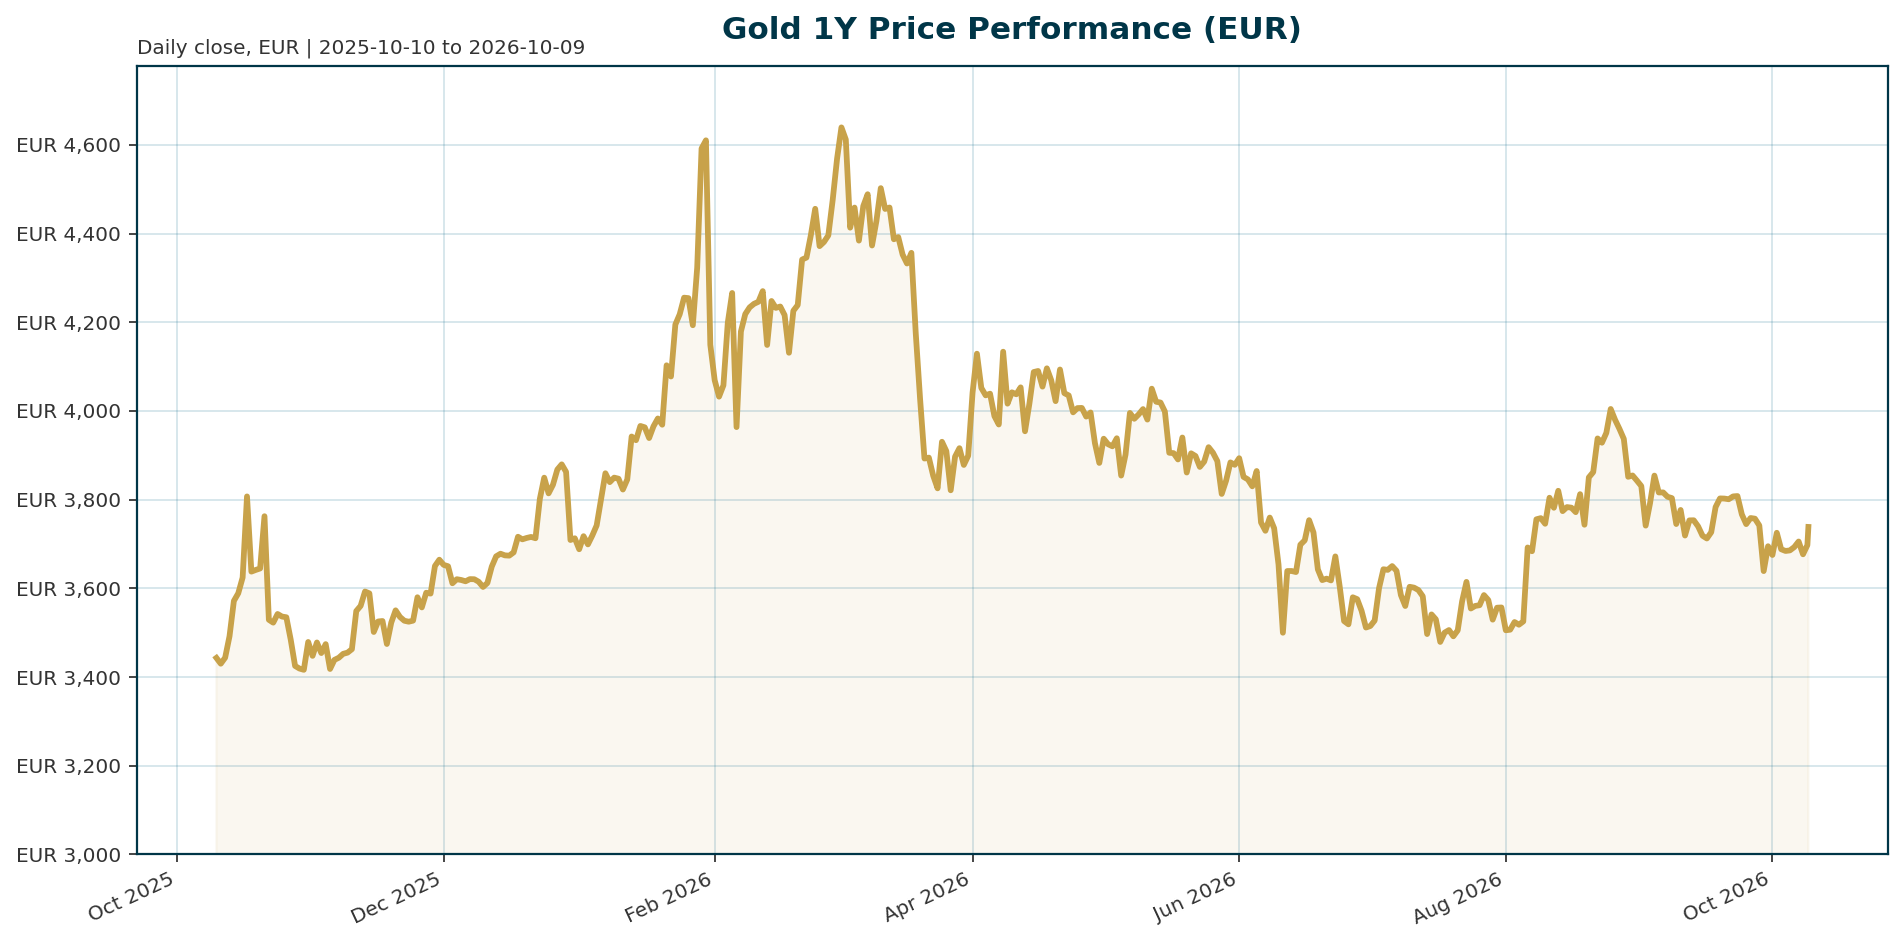
| Metric | Value | Change / Context |
|---|---|---|
| Price (XAU, EUR quote, PAXG proxy) | 3,725.76 EUR | +0.84% 24h, -0.16% 7d, -4.56% 30d, +3.23% 1y |
| 24h range | 3,659.21 to 3,723.78 EUR | Intraday recovery toward the top of the range |
| All-time high | 4,688.32 EUR (2026-01-28) | -20.53% from ATH; required rebound to ATH +25.84% (4,688.32 / 3,725.76 – 1 = 25.84%) |
| All-time low | 1,265.28 EUR (2019-11-17) | +194.46% above ATL |
| PAXG market cap / rank | 1.64bn EUR / #54 | Token wrapper value, not total gold market value |
| 24h volume (PAXG) | 134.8m EUR | Wrapper liquidity only, not a gold-market liquidity gauge |
| Circulating supply | 439,424 units | 1:1 spot gold tracking token |
| Euro AAA 10Y yield | 3.54% | -5.4bp 5d, +59.0bp YTD; 2Y at 3.00% (+88.8bp YTD) |
| Euro AAA 10Y-2Y spread | 54.2bp | 3.5384% – 2.9965% = 54.2bp; curve steepening, front end repriced harder YTD |
| ECB refinancing rate | 2.40% | Markets expected a hold at the last meeting [T1] |
| EUR/USD | 1.1204 | -0.27% 5d, -3.70% 1m, -4.65% YTD |
| Total crypto market cap | ~2.489tn USD | BTC dominance 59.08%; implied BTC cap ≈ 1.47tn USD (2,489.2bn × 0.5908 = 1,470.7bn) |
Implied USD gold price check: 3,725.76 EUR × 1.1204 = 4,174 USD per ounce. This is consistent with reporting that gold held firmly above $4,000/oz while US 10Y yields exceeded 5% [T3].
Macro Backdrop
Market overview: Risk sentiment is neutral to negative, with equity momentum moderately negative and DACH indices lagging global peers. Euro area yields are mixed with curve steepening, and the FX backdrop is mixed. Key observations: the S&P 500 shows the strongest 5-day move at +0.55%, while the ATX is the weakest at -2.35%; the Nikkei 225 leads on a 1-month basis at +5.62%; DACH indicators average -2.01% over 5 days versus -0.30% for global equity indicators, a -1.71pp gap that quantifies regional risk aversion. Euro area AAA 10Y yield sits at 3.54% (-5.4bp over 5 days), the 10Y-2Y spread is 54.2bp, and EUR/USD is 1.1204 (-0.27% over 5 days). This tape is defensive and matters for gold mainly through the real-yield and FX channels discussed below.
Policy regime: Monetary policy credibility has become the dominant macro driver for gold, with the ECB meeting the next transmission point [T1]. Markets expected the ECB to hold the refinancing rate at 2.40% while Lagarde’s assessment of inflation and energy prices drove positioning [T1]. The ECB has already raised 25bp in June and September, and policy remains data-dependent [T3]. In the US, the Fed held rates with Powell stressing that further easing requires clearer inflation progress, although ING’s US economist still expects two 25bp cuts later in the year [T4]. Since mid-2025, markets have shifted from pricing easing to debating additional hikes, pushing the US 2Y above 4% [T2], with the US 10Y now above 5% [T3].
Inflation and energy: Oil has risen from roughly $70 before the summer to above $100 following the US-Iran conflict escalation, and Bundesbank President Nagel flags low energy inventories, refining damage, and fertilizer shortages as additional upside price risks [T3]. Rising energy prices complicate the path for monetary easing and keep the higher-for-longer scenario live [T4]. US M2 is growing at roughly 5.7% year on year as of October 2026 [T8].
Fiscal backdrop: Public debt-to-GDP ratios in many advanced economies sit at or near post-war highs. History suggests such burdens are often resolved through financial repression, inflation, and currency depreciation, all environments in which gold tends to outperform [T5].
Investment Thesis
The core argument is a regime shift in gold’s pricing logic. Under the traditional framework, gold is a non-yielding asset whose price should fall as real yields rise. That framework has broken down. Gold held above $4,000/oz with US 10Y yields above 5% [T3], and after 2022 real yields rose to post-GFC highs while gold posted +13% in 2023 and reached record highs [T6]. Société Générale characterizes this as a clear post-2022 regime shift: structural factors, including sustained central bank purchases, dedollarisation, geopolitical uncertainty, and sovereign debt concerns, provide a higher price floor that limits the downside impact of elevated real rates [T2].
The reserve-diversification channel is the strongest empirical pillar. Gold’s share of global central bank reserves has risen from roughly 14% in 2023 to nearly 25%, and Bundesbank President Nagel says the case for further diversification remains strong [T3]. Central banks are on course for roughly 850 tonnes of net purchases in 2026, a third straight year of historically elevated buying [T8]. A record 43% of 73 surveyed monetary authorities expect to increase their own gold reserves over the next year, driven by sanctions risk and inflation volatility [T6]. Reserve managers are also changing behavior, not just size: the Dutch central bank moved roughly 86 tonnes (more than a quarter of its 313t US/Canada holdings) to London for crisis preparedness, cutting its US-stored share from 31.3% to 18.5% [T3].
Balance: The bear case is that this narrative is flow-dependent and self-referential. ETF flows are volatile: June saw -74 tonnes of outflows, showing yield pressure can trigger selling, before September recovered +121 tonnes [T8]. Analysts at the LBMA conference cautioned that the debasement trade does not imply a one-way rally [T3]. The thesis survives only if central bank accumulation continues at an 800-900t pace and euro real yields do not exceed their YTD highs. For a EUR-based investor, the FX layer is a second swing factor: EUR/USD has fallen 4.65% YTD, so part of EUR-quoted gold’s return embeds dollar strength, and any euro recovery mechanically depresses EUR gold prices.
Bullish Drivers
- Central bank accumulation: Roughly 850 tonnes projected for 2026, approximately 71t per month equivalent, a third consecutive year of elevated purchases [T8]. This is the price-anchoring driver, not a flow driver.
- Reserve-share trajectory: Gold’s share of CB reserves rose from ~14% (2023) to ~25% (2026), roughly +3.7pp annualized. If the trajectory extends toward 30%+, structural demand reasserts through yield stress rather than capitulating to it [T3].
- ETF holdings at record levels with dip-buying: Global gold ETF holdings at a record 4,189 tonnes; the September +121t recovery after June’s -74t outflow shows structural allocators buy weakness [T8].
- Monetary expansion: US M2 growth of ~5.7% YoY supports the debasement-hedging leg, though money growth alone is necessary but not sufficient and requires the inflation-expectation channel [T8].
- Crisis-preparedness premium: The DNB relocation of 86 tonnes to London signals reserve managers now price storage and deployability risk, deepening the institutional bid [T3].
- Stagflation hedge: A backdrop of slower growth with persistent inflation is supportive for gold over the longer term, and current energy dynamics (oil above $100) risk exactly that mix [T4] [T3].
- Valuation asymmetry: SocGen judges that a materially larger inflation shock and a much more aggressive Fed response would be needed for another significant rates repricing, so much of the hawkish adjustment is already priced and downside risk appears limited [T2].
- Debt-resolution tailwind: Debt-to-GDP near post-war highs means the historical resolution toolkit (inflation, financial repression, currency depreciation) structurally favors gold [T5].
Relative Positioning vs Bitcoin and Ethereum
The aggregate crypto complex is worth roughly 2.489tn USD with BTC dominance at 59.08%, implying a Bitcoin market cap of about 1.47tn USD (2,489.2bn × 0.5908 = 1,470.7bn). Total crypto 24h volume of 105.1bn USD dwarfs the 134.8m EUR of PAXG wrapper volume, but that comparison measures token liquidity, not gold market depth; physical gold OTC and London clearing volumes are not in this dataset.
Data gap: The bundle provides no Ethereum-specific price, flows, or performance data, so ETH positioning cannot be quantified here and is explicitly flagged as unavailable. The report’s benchmark asset set includes ethereum, but any ETH comparison beyond aggregate market metrics would be speculative.
Positioning logic: Gold sits 20.53% below its January ATH in EUR terms while equity risk sentiment is neutral to negative and DACH equities lag global peers. In a risk-off rotation, gold benefits from safe-haven and reserve-manager demand while high-beta crypto underperforms. In a risk-on rebound, gold lags on relative performance. In a liquidity-driven debasement rally, both rise, gold wins on drawdown terms, crypto wins on beta. The PAXG market cap of 1.64bn EUR (rank 54) is a wrapper metric and should never be read as gold’s total market value, which is orders of magnitude larger.
Scenario Framework
Probabilities are analyst judgment, not model output. Anchors: current 3,725.76 EUR, 24h low 3,659.21 EUR, ATH 4,688.32 EUR.
- Bull (~30%, 6-12 months): Stagflation firms up. Oil holds above $100, M2 growth stays above 5%, and the Fed cuts faster than the September/December base case [T4]. Euro real yields fall and ETF inflows run at +100t for consecutive months. EUR gold reclaims 4,300-4,688 (ATH retest). Trigger: sustained ETF inflows plus a dovish ECB pivot on guidance [T1].
- Base (~50%, 6-12 months): ECB holds at 2.40%, US 10Y plateaus above 5%, central bank buying continues at 800-900t, ETF flows oscillate. EUR gold ranges 3,500-4,100 with a rising multi-year floor. SocGen’s framing supports this: the downside risk appears increasingly limited because much of the hawkish adjustment is priced [T2]. Deeper pullbacks attract central bank and long-term buyers [T4].
- Bear (~20%, 6-12 months): Inflation re-accelerates, forcing another hike sequence consistent with the Atlanta Fed Taylor Rule gap argument that inflation risks remain underpriced [T2]. US 10Y pushes toward 5.5%+, the dollar strengthens further, ETF outflows of June’s magnitude (-74t) recur for consecutive months [T8]. EUR gold tests 3,300-3,400. Central bank buying near ~71t/month limits the drawdown well below -20% from current levels.
- Multi-year structural overlay: A fiscal-dominance or financial-repression episode in a major economy (sustained negative real rates) supersedes all near-term scenarios and reprices gold toward or beyond the 4,688 EUR ATH [T5]. Conversely, if central bank purchases decelerate below trend, the structural floor argument weakens materially [T4] [T5].
Valuation Discussion
Traditional frameworks say expensive. Under the real-yield opportunity-cost model, gold above $4,000/oz with 10Y real yields positive and the dollar firm is significantly overvalued [T3] [T8]. J.P. Morgan’s historical account is direct: real yields rose from deeply negative territory to post-2008 highs after 2022, yet gold posted +13% in 2023 and record highs, breaking models that would imply significantly lower prices [T6]. The DXY and 5-year swap differential models have diverged from gold since roughly 2024 [T6].
Regime-appropriate anchors say fair to cheap. Under the reserve-share framework, gold is fairly valued if the central bank reserve share plateaus near 25%, and cheap if the 14%-to-25% trajectory extends toward 30%+ [T3]. The 850t purchase pace and the record 4,189t ETF holdings both anchor demand independently of yields [T8]. SocGen’s asymmetry argument is the cleanest expression: with the hawkish adjustment largely reflected in markets, downside risk is limited unless a materially larger inflation shock arrives [T2].
EUR-specific decomposition: USD-quoted gold is up roughly 6% YTD [T4], while EUR/USD fell 4.65% YTD. Approximate decomposition: EUR gold return ≈ USD gold return + EUR/USD return, giving roughly +6% – 4.65% ≈ +1.35% expected, against a measured +3.23% 1y return on the EUR-quoted series. The residual (~1.9pp) reflects measurement-window differences and proxy tracking noise. The key implication: EUR gold’s -20.53% distance from ATH partly reflects earlier EUR strength absorbing USD gold gains, not only a gold correction. If EUR/USD mean-reverts toward 1.15-1.17 on Fed easing, EUR gold will underperform USD gold mechanically in all scenarios.
Honest caveat: A euro-area real yield proxy cannot be computed precisely because the bundle contains no HICP inflation expectation. As a fallback, the nominal AAA 10Y of 3.54% against the 2.40% refinancing rate implies a 114bp nominal spread, consistent with a restrictive stance, but true real-yield assessment requires unavailable data.
Risks
- Yield risk (primary bear model): The Taylor Rule gap suggests inflation risks remain underpriced, meaning markets could price more hikes than currently assumed and push US yields materially higher [T2]. The traditional model, though broken, reasserts itself if real yields rise sharply enough.
- Flow risk: ETF flows are volatile and yield-sensitive. June’s -74t outflow demonstrates the mechanism [T8]. Monitoring trigger: two consecutive months of outflows exceeding -50t upgrades flow risk to a primary thesis threat.
- Narrative risk: Analysts explicitly caution that the debasement trade does not imply a one-way rally [T3], and gold up roughly 6% YTD in USD leaves the market vulnerable to profit-taking episodes [T4].
- FX risk (EUR-specific): EUR/USD fell 3.70% over the past month, so USD strength is an active headwind for EUR-quoted gold in one direction and a mechanical drag if the euro recovers. Monitoring trigger: EUR/USD below 1.10 combined with a euro AAA 10Y above its YTD high would compound EUR-gold downside.
- Central bank deceleration risk: Central bank buying may slow from the current pace [T4], and a slowdown among Asian and Middle Eastern reserve holders would remove the price floor [T5]. Monitoring trigger: public disclosure of a major reserve holder reducing gold holdings directly invalidates the structural floor argument.
- Inflation normalization: The bear side of the energy story: if oil retreats from above $100 toward pre-summer levels near $70 [T3], the inflation-hedge narrative weakens and the base case drifts toward the bear case.
- Data and proxy risk: All EUR-quoted metrics here use the PAXG wrapper, which can trade at premium or discount to spot; news sources are partly undated and lower-tier outlets carry quantitative claims (850t, 4,189t) that are cross-referenced but not independently verified.
Appendix
Methodology Notes
- Market data: CoinGecko via PAXG tokenized gold, EUR quote, retrieved 2026-10-09T05:12Z. PAXG tracks spot gold 1:1 but reflects token wrapper liquidity, not total physical gold market cap.
- Rates: ECB AAA yield curve, as of 2026-10-07. FX: Frankfurter, as of 2026-10-09. Equities: as of 2026-10-08/09.
- FX mechanics: EUR gold price ≈ USD gold price / EURUSD, so EUR-quoted returns decompose into USD gold return plus EUR/USD return.
- News items carry no publication timestamps. T1 references a July ECB meeting and is treated as historical context, not a live calendar event, given the current date of October 2026.
- T7 (Cochrane) is used as a conceptual reference on central bank balance sheets and real-asset backing, not as a price forecast source.
- Scenario probabilities (~30/50/20) are subjective analyst judgment.
Key Calculations
- Distance from ATH: 3,725.76 / 4,688.32 – 1 = -20.53%; rebound required: +25.84%.
- Implied USD price: 3,725.76 × 1.1204 ≈ 4,174 USD/oz, consistent with sources reporting gold above $4,000 [T3] [T8].
- 10Y-2Y euro AAA spread: 3.5384% – 2.9965% = 54.2bp.
- Implied BTC market cap: 2,489.2bn × 0.5908 ≈ 1,470.7bn USD (~1.47tn).
- ETF flow swing: June -74t to September +121t = 195t monthly swing, versus ~71t/month equivalent of the 850t projected 2026 central bank purchases.
- DACH underperformance: -2.01% 5d average vs -0.30% global = -1.71pp gap.
- YTD return decomposition: +6% USD gold [T4] – 4.65% EUR/USD ≈ +1.35% implied vs +3.23% measured 1y EUR return; residual attributed to window and proxy effects.
Sources
- [T1] Gold navigates central bank credibility as markets prepare for the ECB (FXStreet): https://www.fxstreet.com/analysis/gold-navigates-central-bank-credibility-as-markets-prepare-for-the-ecb-202607220627
- [T2] It’s time to get bullish on gold again, says SocGen (Kitco News): https://www.kitco.com/news/article/2026-09-03/its-time-get-bullish-gold-again-says-socgen
- [T3] Gold Holds Above $4,000 Even as US Treasury Yields Top 5% (BigGo Finance): https://finance.biggo.com/news/ab4649ca-8e80-4243-b531-a667f953ddc2
- [T4] Geopolitics alone isn’t enough to lift gold (ING THINK): https:/.ing.com/articles/geopolitics-alone-isnt-enough-to-lift-gold
- [T5] Report: Central Banks Now Hold More Gold Than Treasuries (CEOWORLD magazine): https://ceoworld.biz/2026/06/15/report-central-banks-now-hold-more-gold-than-treasuries-what-that-means-for-global-capital-and-currencies
- [T6] Is it a golden era for gold? (J.P. Morgan Private Bank): https://privatebank.jpmorgan.com/nam/en/insights/markets-and-investing/is-it-a-golden-era-for-gold
- [T7] An Inflation-Protected Balance Sheet (John H. Cochrane, Grumpy Economist): https://www.grumpy-economist.com/p/an-inflation-protected-balance-sheet
- [T8] Gold Price Prediction: 3 Frameworks for $4,000 and Beyond (Discovery Alert): https://discoveryalert.com/education/gold-price-prediction-frameworks
Disclaimer
This report is AI-generated and is for informational purposes only. It does not constitute investment advice, a recommendation, or an offer to buy or sell any financial instrument. Data is provided as of the timestamps indicated and may be incomplete or inaccurate. Readers should conduct their own due diligence and consult a licensed financial advisor before making investment decisions.
Important Note / Wichtiger Hinweis:
EN: This report may have been generated using AI. It processes data from publicly available sources. The content is provided for informational purposes only.DE: Dieser Bericht kann mithilfe von KI erstellt worden sein. Dabei werden Daten aus öffentlich zugänglichen Quellen verarbeitet. Die Inhalte dienen ausschließlich Informationszwecken.
* DE: Die ergänzenden Inhalte können KI-generiert sein. EN: The additional content may be AI-generated.