
The altii-Gold-Report: Gold (XAU) in EUR
Watch the video
This player shows only the Gold chapter of the daily altii market briefing. Watch the full video on tube.altii.de.
Key Data Snapshot
| Metric | Latest | Institutional read-through |
|---|---|---|
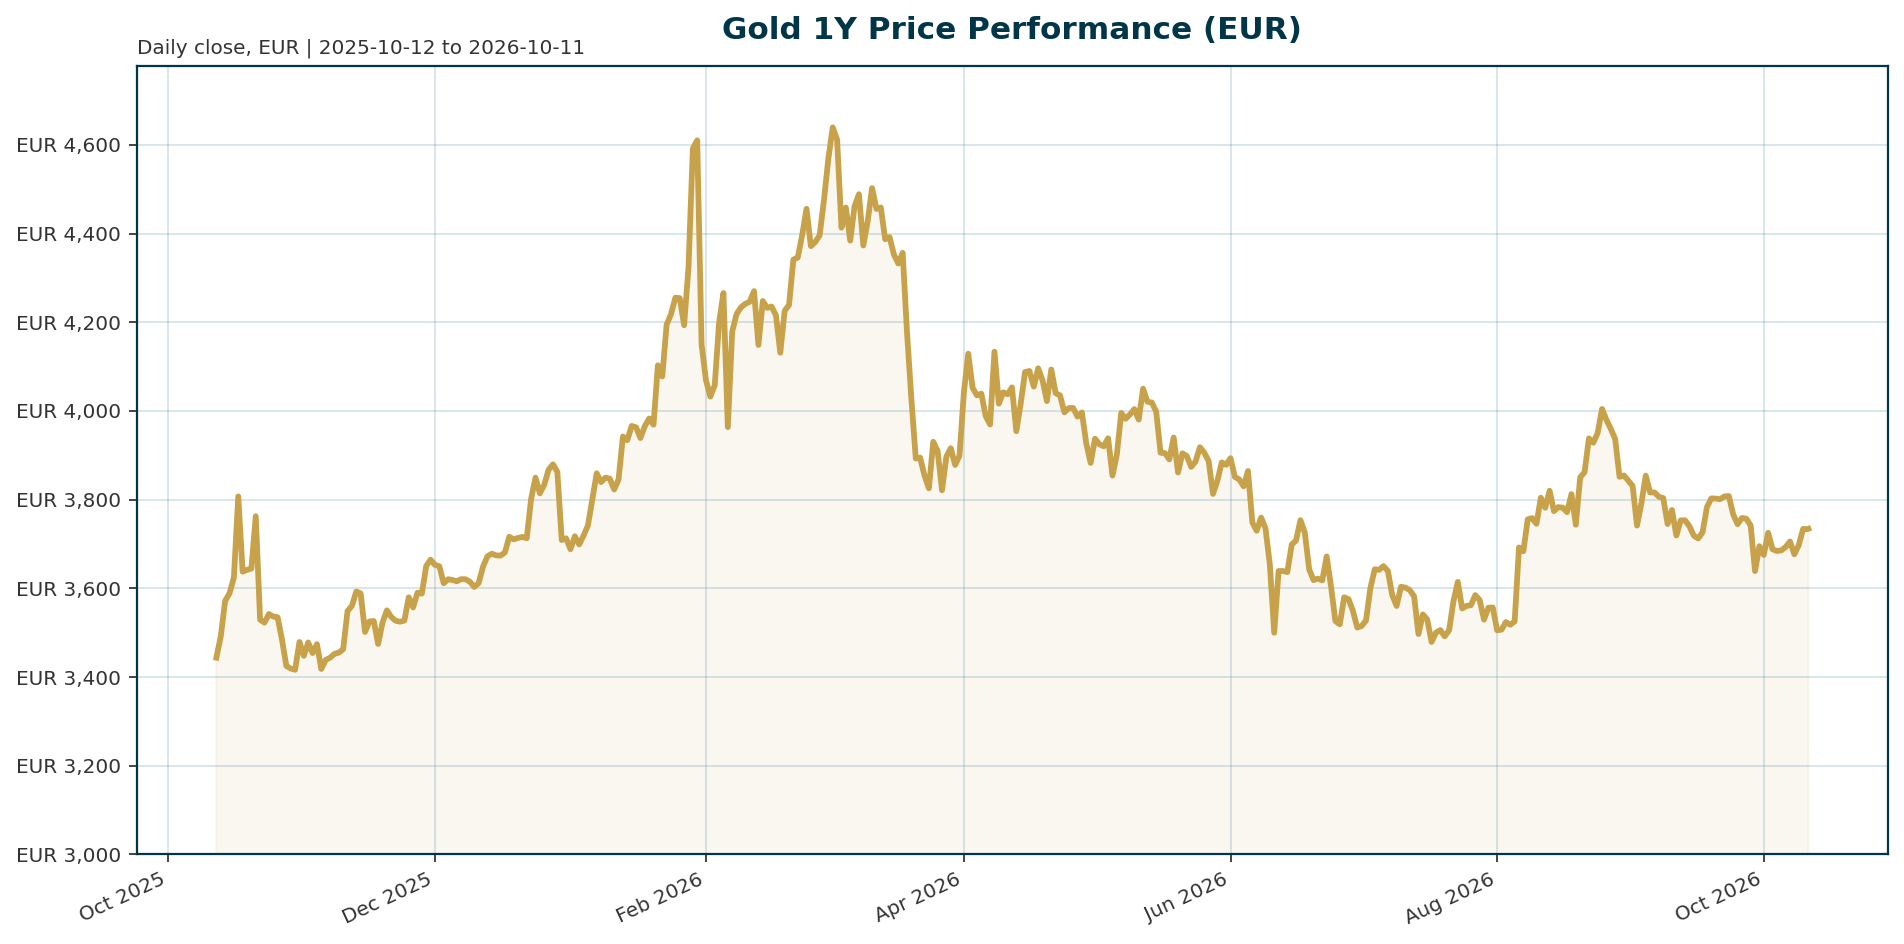
| XAU/EUR proxy price | €3,734.14 | Positive over one year, but in medium-term consolidation. |
| Performance | 24h -0.0049%; 7d +0.9223%; 30d -3.3348%; 200d -8.5690%; 1y +4.9078% | Short-term stabilization, but no fresh upside impulse yet. |
| 24h range | High €3,736.98; low €3,732.23 | Range = €4.75; range/current price = 4.75 / 3,734.14 = 0.127%. |
| Distance from all-time high | ATH €4,688.32 on 28 Jan 2026; current -20.3522% | Calculation: (3,734.14 / 4,688.32 – 1) x 100 = -20.35%. |
| Distance from all-time low | ATL €1,265.28 on 17 Nov 2019; current +195.1227% | Calculation: (3,734.14 / 1,265.28 – 1) x 100 = +195.12%. |
| Euro area AAA yields | 2Y 3.0331%; 5Y 3.1965%; 10Y 3.5192%; 30Y 3.7782% | Higher local yields raise gold’s opportunity cost. |
| Euro curve slope | 10Y-2Y: 48.6 bp; 30Y-2Y: 74.5 bp | Calculations: (3.51918971 – 3.0331429854) x 100 = 48.6 bp; (3.7781543009 – 3.0331429854) x 100 = 74.5 bp. |
| EUR/USD | 1.1217; 5d -0.1602%; 1m -3.4100%; YTD -4.5362% | EUR weakness supports XAU/EUR mechanically if USD gold is stable. |
| Indicative USD gold proxy | US$4,188.59 | Calculation: €3,734.14 x 1.1217 = US$4,188.59. This is an indicative translation only. |
| Crypto context | BTC dominance 59.1227%; total crypto market cap US$2.510 trillion; 24h crypto volume US$40.798 billion | Useful for broad risk context, but insufficient for full BTC/ETH relative valuation. |
Data caveat: the market data use the Coingecko identifier pax-gold. The price is useful as an XAU/EUR proxy, but market capitalization, supply, rank and volume should be treated as tokenized-instrument metrics, not as measures of the global physical gold market.
Macro Backdrop
The cross-asset backdrop is neutral rather than crisis-like. The market overview shows neutral risk sentiment, mixed equity momentum, DACH lagging global indicators, euro_yields_mixed rates conditions and a mixed FX backdrop. DACH indicators averaged -1.83% over five days versus -0.13% for global equity indicators. The euro area AAA 10Y yield is 3.52%, up 5.5 bp over five days, while the 10Y-2Y spread is 48.6 bp. EUR/USD is 1.1217, down 0.16% over five days. This backdrop supports gold as a diversifier, but it does not yet signal acute safe-haven stress.
For gold, the key macro question is whether elevated nominal and real yields can still pressure a non-yielding asset, or whether post-2022 structural demand has raised the price floor. Société Générale argues that gold has stayed near record highs despite persistently positive real yields, supported by central bank purchases, dedollarisation, geopolitical uncertainty and sovereign debt concerns [T1]. J.P. Morgan also notes that the historical inverse relationship between gold and real yields has broken down in recent periods, even though real yields remain a central opportunity-cost variable for gold [T5]. Lombard Odier takes a balanced view: gold remains sensitive to real yields, but resilient demand, fiscal uncertainty and purchasing-power erosion continue to support real assets [T6].
The macro setup is therefore mixed. Bullish investors can point to debt, inflation uncertainty and reserve diversification. Bearish investors can point to rising euro yields, a 30-day XAU/EUR decline of 3.3348% and a 200-day decline of 8.5690%. The base case is consolidation, not capitulation.
Investment Thesis
Gold in EUR portfolios should be treated as a strategic reserve asset, not as an income asset. Its value comes from liquidity, scarcity, policy-credibility hedging and crisis performance. That makes real yields important for timing, but insufficient as a standalone valuation model.
The constructive thesis rests on four pillars:
- Policy uncertainty hedge: Société Générale describes gold as a hedge against monetary and policy uncertainty and remains strategically bullish [T1].
- Reserve diversification: central bank buying, dedollarisation and geopolitical risk have become structural supports rather than cyclical afterthoughts [T1].
- Debt and financial repression risk: high public debt burdens can be resolved through inflation, currency depreciation or financial repression, conditions in which gold tends to perform well [T3].
- Real-wealth preservation: if nominal rates rise but inflation remains elevated, real rates can remain low or negative, preserving the case for gold as a purchasing-power hedge [T8].
The bearish counterpoint is straightforward. If inflation falls without a growth shock, central banks keep real yields positive, ETF demand fades and physical demand weakens, gold may remain defensive but lose tactical upside. In that case, gold acts as insurance rather than a return engine.
Bullish Drivers
- Official-sector demand is the anchor. The World Gold Council’s 2026 survey states that central banks accumulated an average of 1,000 tonnes of gold per year over the past four years, up from a 500-tonne average over the preceding decade [T7].
- Reserve managers still expect higher gold allocations. In the same WGC survey, 89% of respondents expected global central bank gold reserves to increase over the next 12 months, while a record 45% expected their own institution’s reserves to rise and only 1% expected a decrease [T7].
- Gold’s crisis role remains explicit. Mexico Business News, summarizing WGC survey findings, reported that 90% of respondents cited gold’s historical crisis performance as highly relevant, while 92% flagged interest-rate levels as relevant for reserve management [T4].
- Emerging-market reserve behavior remains supportive. The same summary reported that 95% of EMDE institutions cited geopolitical instability as a key allocation driver, versus 67% of advanced-economy institutions [T4].
- Storage and liquidity policy are becoming more active. The Dutch Central Bank reportedly moved about 86 tonnes of gold from the United States and Canada to London to improve crisis preparedness and liquidity access [T2].
- ETF flows are not the main anchor, but they have not collapsed. Société Générale noted that gold-backed ETF inflows had moderated sharply but remained positive [T1].
The bullish case is not that gold must rise in a straight line. It is that structural buyers have reduced the downside normally implied by high positive real yields. The main signal to monitor is whether official-sector demand remains near recent elevated levels.
Relative Positioning vs Bitcoin and Ethereum
The available bundle does not provide Bitcoin or Ethereum spot prices, returns, volatility, flows or valuation metrics. Therefore, a full gold-versus-Bitcoin-versus-Ethereum performance comparison is unavailable.
What is available is broad crypto context: BTC dominance is 59.1227%, total crypto market capitalization is US$2.510 trillion, and total crypto 24h volume is US$40.798 billion. These figures indicate a large and active digital-asset market, but they do not support a precise relative allocation conclusion.
Gold’s relative advantage is institutional clarity. Central banks hold, store and actively manage gold as a reserve asset; the WGC survey shows strong expectations for further official-sector accumulation [T7]. No comparable central-bank reserve-flow data for Bitcoin or Ethereum are included in the bundle. Gold therefore remains the reserve-grade scarcity asset in this report’s evidence set.
The balanced view: gold should outperform digital assets in a policy-credibility, reserve-diversification or geopolitical shock regime. Bitcoin and Ethereum may outperform in a high-liquidity, high-risk-appetite regime, but that cannot be quantified from the provided data.
Scenario Framework
| Scenario | Macro conditions | XAU/EUR implication | Key monitoring variables |
|---|---|---|---|
| Base case: consolidation with structural support | Euro yields remain elevated, inflation uncertainty persists, EUR/USD remains soft to mixed, and central-bank demand continues. | Gold trades as a strategic hedge rather than a momentum asset. The 20.35% drawdown from the January 2026 ATH limits euphoria, while the +4.91% one-year return preserves the structural trend. | 10Y euro yields, EUR/USD, ETF flows, reserve-policy announcements. |
| Bull case: policy credibility weakens | Inflation expectations remain sticky, fiscal risks rise, real yields fall or fail to compensate investors, and reserve accumulation remains elevated. | XAU/EUR resumes upside. EUR weakness can amplify gains for euro-based investors. | Central-bank purchases, inflation breakevens, real yields, EUR/USD trend. |
| Bear case: real yields reprice higher | Inflation falls without recession, central banks stay restrictive, the US dollar strengthens, ETF demand declines and physical demand weakens. | The 30-day loss of 3.3348% and 200-day loss of 8.5690% could extend. | US and euro real yields, dollar index proxies, ETF outflows, jewellery demand. |
| Tail-risk case: liquidity or geopolitical shock | Geopolitical stress or a reserve-confidence shock raises demand for deployable physical gold. | Gold can disconnect further from yield models and reprice as a crisis asset. | Reserve transfers, sanctions risk, central-bank custody choices, sovereign-risk spreads. |
Société Générale noted that markets had shifted from pricing additional monetary easing to debating whether the Federal Reserve might raise rates once or twice more, supporting the US dollar and pushing two-year Treasury yields above 4% [T1]. Lombard Odier argued that the Fed was likely to keep rates on hold for much of 2026, with any cut more likely toward year-end [T6]. CEOWORLD highlighted the path from restrictive to neutral or accommodative policy as a key variable for gold, and identified sustained negative real rates as a powerful structural tailwind [T3].
Valuation Discussion
Gold valuation should use a hybrid framework:
- Real yields for cyclical timing. Gold does not generate interest income, so higher real yields increase the opportunity cost of holding it. J.P. Morgan notes that gold becomes more attractive relative to cash and fixed income when real yields fall [T5].
- Reserve flows for the structural floor. Société Générale argues that gold has broken away from historical models that would imply lower prices under positive real yields, because central-bank buying, dedollarisation, geopolitical risk and sovereign-debt concerns now provide a higher floor [T1].
- EUR/USD for euro-investor returns. With EUR/USD at 1.1217, the indicative USD translation of the current XAU/EUR proxy is €3,734.14 x 1.1217 = US$4,188.59. A weaker euro raises XAU/EUR even if USD gold is unchanged; a stronger euro can reduce XAU/EUR.
The current level is 20.35% below the January 2026 ATH. That discount is large enough to reduce valuation heat, but not large enough to call gold cheap versus long-cycle history, given the +195.12% distance from the 2019 ATL. The valuation debate is therefore not “cheap versus expensive” in isolation. It is whether the post-2022 reserve-demand regime justifies a higher equilibrium price.
Market participants have argued that gold’s traditional negative correlation with bond yields is weakening as debt sustainability, persistent inflation and fiat purchasing-power concerns become more important [T2]. The bullish interpretation is that gold deserves a higher structural multiple. The bearish interpretation is that if the real-yield relationship reasserts while reserve flows slow, valuation can compress.
Risks
- Higher-for-longer real yields: Lombard Odier identifies persistently higher real yields as a key risk to gold [T6]. Euro area AAA 10Y yields are already up 14.07 bp over one month.
- ETF demand deterioration: Lombard Odier flags prolonged ETF demand decline as a negative factor [T6]. This matters because ETF flows can drive marginal private-sector demand.
- Weaker physical demand: lower jewellery and physical demand would weaken the demand stack, even if central-bank buying offsets part of the decline [T6].
- More aggressive central-bank response: Société Générale argues that a materially larger inflation shock and much more aggressive Fed response would be needed to trigger another major rates repricing [T1]. If that occurs, gold could face renewed pressure.
- EUR rebound risk: EUR/USD is down 3.4100% over one month. If EUR/USD reverses higher while USD gold is flat, XAU/EUR would fall mechanically.
- Proxy-data risk: market data use a tokenized gold proxy. If pax-gold pricing diverges from institutional spot XAU/EUR, conclusions should be treated as indicative.
- Relative-risk appetite: if risk appetite strengthens and digital assets regain leadership, gold may lag higher-beta scarcity assets. The bundle lacks BTC and ETH asset-level data, so this risk is qualitative only.
The biggest risk to an underweight gold position is the opposite: policy credibility may erode faster than nominal yields compensate investors for inflation, debt and currency risk.
Appendix
Methodology and data notes
- Report generated at: 2026-10-11T04:43:30.897716Z.
- Market data retrieved at: 2026-10-11T04:43:25.317460Z.
- Quote currency: EUR.
- Coingecko identifier:
pax-gold. Market cap, supply, rank and volume are instrument-specific and should not be interpreted as global physical gold metrics. - Market cap proxy: €1.641 billion. Circulating supply proxy: 439,434.571174. 24h volume proxy: €34.114 million.
- No direct real-yield series, inflation-expectation series, ETF-flow series, monthly central-bank purchase series, Bitcoin price series or Ethereum price series is included in the bundle.
- Tavily source publication dates are unavailable.
Key calculations
- ATH drawdown: (3,734.14 / 4,688.32 – 1) x 100 = -20.35%.
- ATL distance: (3,734.14 / 1,265.28 – 1) x 100 = +195.12%.
- 24h range: 3,736.98 – 3,732.23 = €4.75.
- 24h range as % of price: 4.75 / 3,734.14 x 100 = 0.127%.
- 10Y-2Y euro AAA spread: (3.51918971 – 3.0331429854) x 100 = 48.6 bp.
- 30Y-2Y euro AAA spread: (3.7781543009 – 3.0331429854) x 100 = 74.5 bp.
- Indicative USD gold proxy: 3,734.14 x 1.1217 = US$4,188.59.
Sources
- [T1] It’s time to get bullish on gold again, says SocGen | Kitco News
- [T2] Gold Holds Above $4,000 Even as US Treasury Yields Top 5% | BigGo Finance
- [T3] Report: Central Banks Now Hold More Gold Than Treasuries | CEOWORLD magazine
- [T4] Central Bank Gold Purchases Hit 1,000t Average: WGC Survey
- [T5] Is it a golden era for gold? | J.P. Morgan Private Bank U.S.
- [T6] Gold’s slowdown doesn’t signal a reversal | Lombard Odier
- [T7] Central Bank Gold Reserves Survey 2026 | World Gold Council
- [T8] How Inflation and Interest Rates Affect Gold Prices in 2026
This report is AI-generated, for informational purposes only, and does not constitute investment advice, an offer, or a solicitation to buy or sell any financial instrument.
Important Note / Wichtiger Hinweis:
EN: This report may have been generated using AI. It processes data from publicly available sources. The content is provided for informational purposes only.DE: Dieser Bericht kann mithilfe von KI erstellt worden sein. Dabei werden Daten aus öffentlich zugänglichen Quellen verarbeitet. Die Inhalte dienen ausschließlich Informationszwecken.
* DE: Die ergänzenden Inhalte können KI-generiert sein. EN: The additional content may be AI-generated.