
Listen to the summary
Key Data Snapshot
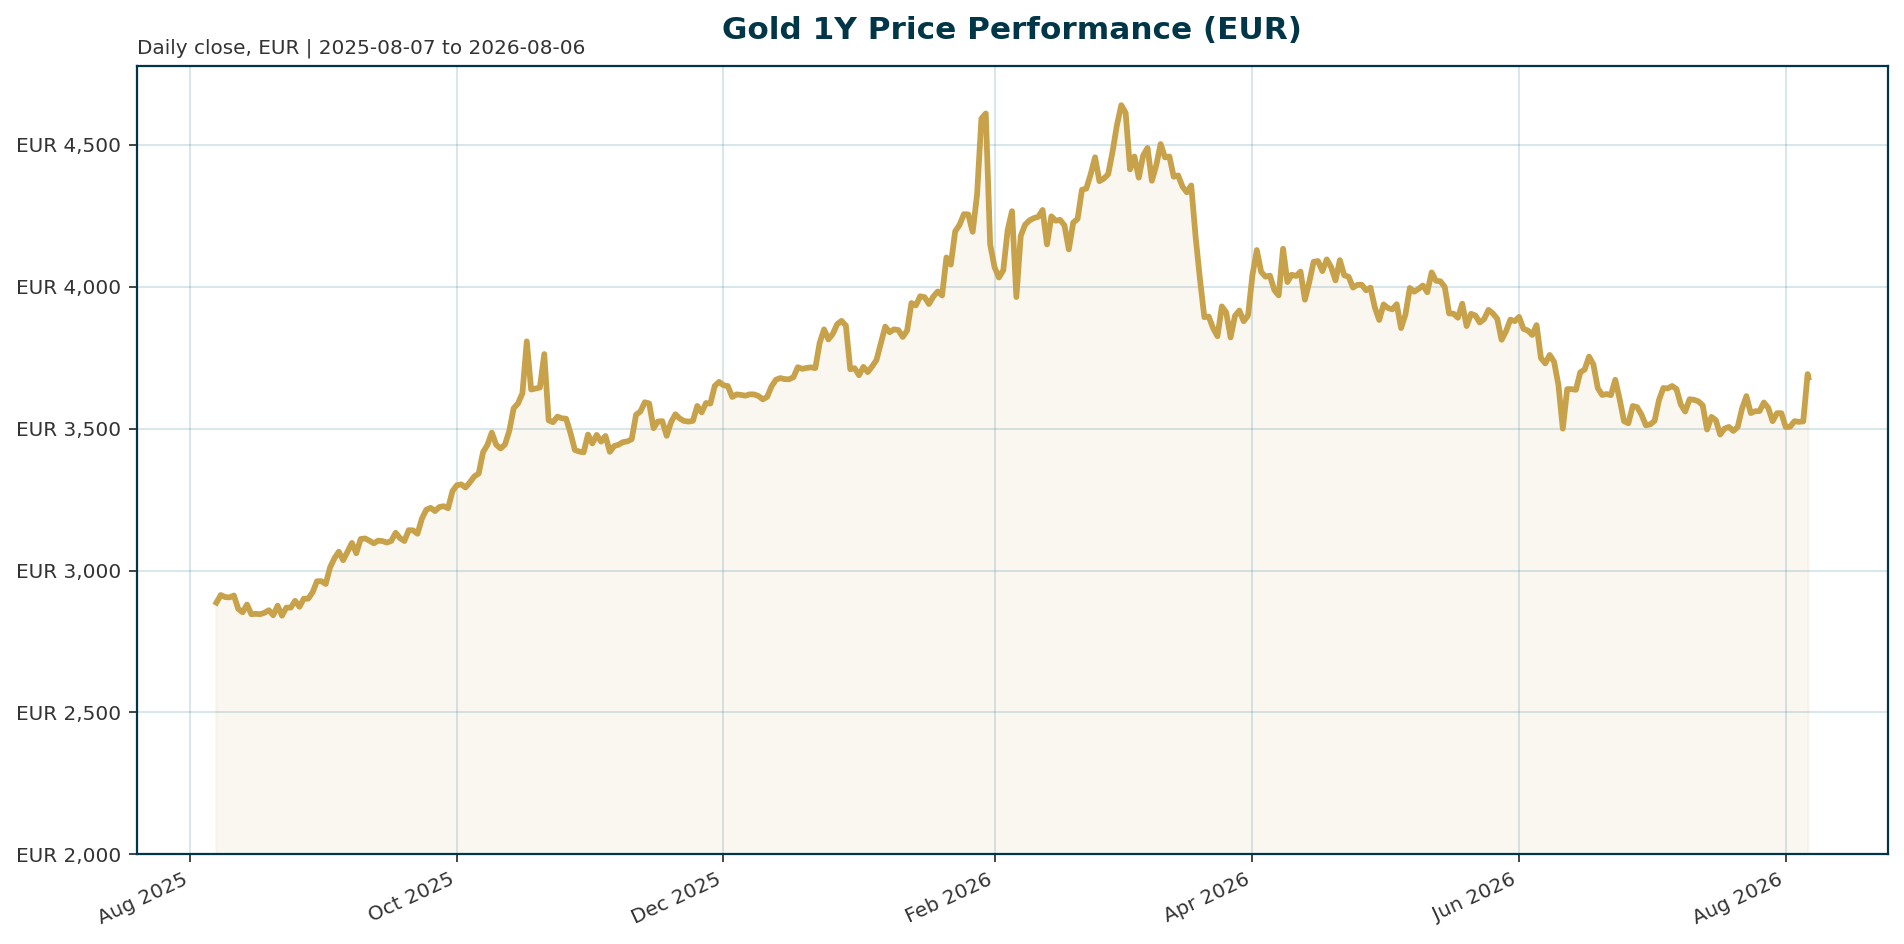
Gold (XAU) is consolidating near the 3,700 EUR level following a volatile period. The current price of 3,683.22 EUR represents a 21.4% drawdown from the January 2026 all-time high of 4,688.32 EUR, but remains up 26.0% year-to-date. Market cap stands at 1.63B EUR with a 24-hour volume of 219.8M EUR.
| Metric | Value |
|---|---|
| Price (XAU/EUR) | 3,683.22 |
| 24h Change | +3.4% |
| YTD Change | +26.0% |
| High (24h) | 3,716.10 EUR |
| Low (24h) | 3,571.98 EUR |
| ATH | 4,688.32 EUR (-21.4% from ATH) |
| Market Cap | 1.63B EUR |
| Market Cap Rank | 41 |
| Volume (24h) | 219.8M EUR |
Macro Backdrop
Risk sentiment is positive with the Nasdaq Composite leading gains at 4.94% while the Hang Seng lags at -1.62%. The Euro area AAA 10Y yield sits at 3.15%, creating a mixed rates backdrop. EUR/USD is trading at 1.1548, providing a slight tailwind to the XAU/EUR quote. Despite this, elevated real yields and a hawkish Fed stance pose near-term headwinds.
Investment Thesis
The investment case for Gold remains anchored in structural reserve diversification rather than cyclical speculation. Despite recent volatility, central banks have emerged as the dominant buyer, averaging 1,000t of gold over the past four years [T8]. This shift away from the US dollar is driven by concerns over sanctions, fiscal imbalances, and geopolitical instability [T4][T7]. Gold acts as a critical hedge against the erosion of purchasing power and dollar debasement, particularly in a regime of higher and more volatile inflation.
Bullish Drivers
- Central Bank Accumulation: A record 90% of central banks surveyed by the World Gold Council expect to increase reserves in the coming year, with emerging markets leading the charge [T5][T8]. This structural demand provides a floor under prices.
- Real Yield Inversion: The current 10-year TIPS real yield sits around 2%. A decline in these yields would reduce the opportunity cost of holding non-yielding gold, triggering a re-rating [T1][T7].
- Fed Easing Cycle: The Federal Reserve has cut 75 basis points over the past six months, with markets pricing in further cuts in September and December [T1][T3].
- Geopolitical Risk: Persistent instability in the Middle East continues to drive demand for hard assets as a store of value [T2][T6].
Relative Positioning vs Bitcoin and Ethereum
Gold occupies a distinct niche compared to the broader crypto market. While Gold’s market cap of 1.63B EUR is dwarfed by the total crypto market cap of 1.98T, it remains the primary reserve asset for sovereigns. Bitcoin’s dominance at 56.66% suggests it is capturing a significant portion of the “hard money” narrative, potentially diverting speculative flows from precious metals [T6]. However, Gold’s YTD performance of +26.0% remains competitive against the broader asset class.
Scenario Framework
- Base Case: Real yields stabilize or decline slowly as the Fed cuts rates. Central bank buying absorbs supply. Gold consolidates between 3,500 and 4,000 EUR.
- Bull Case: Real yields collapse due to stagflationary pressures or a geopolitical shock (e.g., Strait of Hormuz blockade). EUR strengthens. Gold breaks the 4,688.32 EUR ATH and targets 5,000 EUR.
- Bear Case: Real yields spike due to hawkish Fed policy or a resurgence in inflation. The dollar strengthens. Gold faces significant profit-taking pressure, potentially testing support levels near 3,500 EUR.
Valuation Discussion
Gold is currently trading at a discount to its January 2026 peak, priced in at approximately 21.4% below its ATH. Despite this drawdown, the valuation remains sensitive to real yield movements. At current real yield levels (~2%), gold is trading in a band historically consistent with accumulation phases, suggesting the current price reflects a correction rather than a structural top [T1][T7].
Risks
- Real Yield Spike: A rapid rise in real yields would act as a major headwind, as seen in the Q2 2026 correction where gold suffered its worst quarter in 13 years [T6].
- Profit Taking: Gold is up roughly 6% year-to-date, leaving the market vulnerable to bouts of profit-taking [T3].
- Geopolitical De-escalation: A resolution to Middle East tensions could reduce safe-haven demand [T2].
- Bitcoin Competition: Continued outperformance by Bitcoin could drain liquidity from the precious metals complex [T5].
Appendix
Sources
- Central Banks Are Snapping Up Gold, ETF Investors Are Just Waking Up: The Best Gold ETFs to Own Before It Hits $5,000 – 24/7 Wall St. [T1]
- Gold: Between inflation fears and diversification of reserves – UBS [T2]
- Geopolitics alone isn’t enough to lift gold | ING THINK [T3]
- Gold’s Dual Drivers: Central Bank Flows and Real Yields, According to Societe Generale [T4]
- Both Gold and Silver Lose Key Support Levels! Has Last Year’s Get-Rich-Quick Myth Finally Ended? | Bitget News [T5]
- Gold suffers worst quarter in 13 years amid interest rate hike fears – CNBC [T6]
- Is it a golden era for gold? – J.P. Morgan Private Bank [T7]
- Central Bank Gold Purchases Hit 1,000t Average: WGC Survey – Mexico Business News [T8]
This report is AI-generated for informational purposes only and does not constitute investment advice. The data and analysis provided herein are based on the information available at the time of generation and should not be relied upon as financial or investment advice.
Important Note / Wichtiger Hinweis:
EN: This report may have been generated using AI. It processes data from publicly available sources. The content is provided for informational purposes only.DE: Dieser Bericht kann mithilfe von KI erstellt worden sein. Dabei werden Daten aus öffentlich zugänglichen Quellen verarbeitet. Die Inhalte dienen ausschließlich Informationszwecken.
* DE: Die ergänzenden Inhalte können KI-generiert sein. EN: The additional content may be AI-generated.