
Listen to the summary
Key Data Snapshot
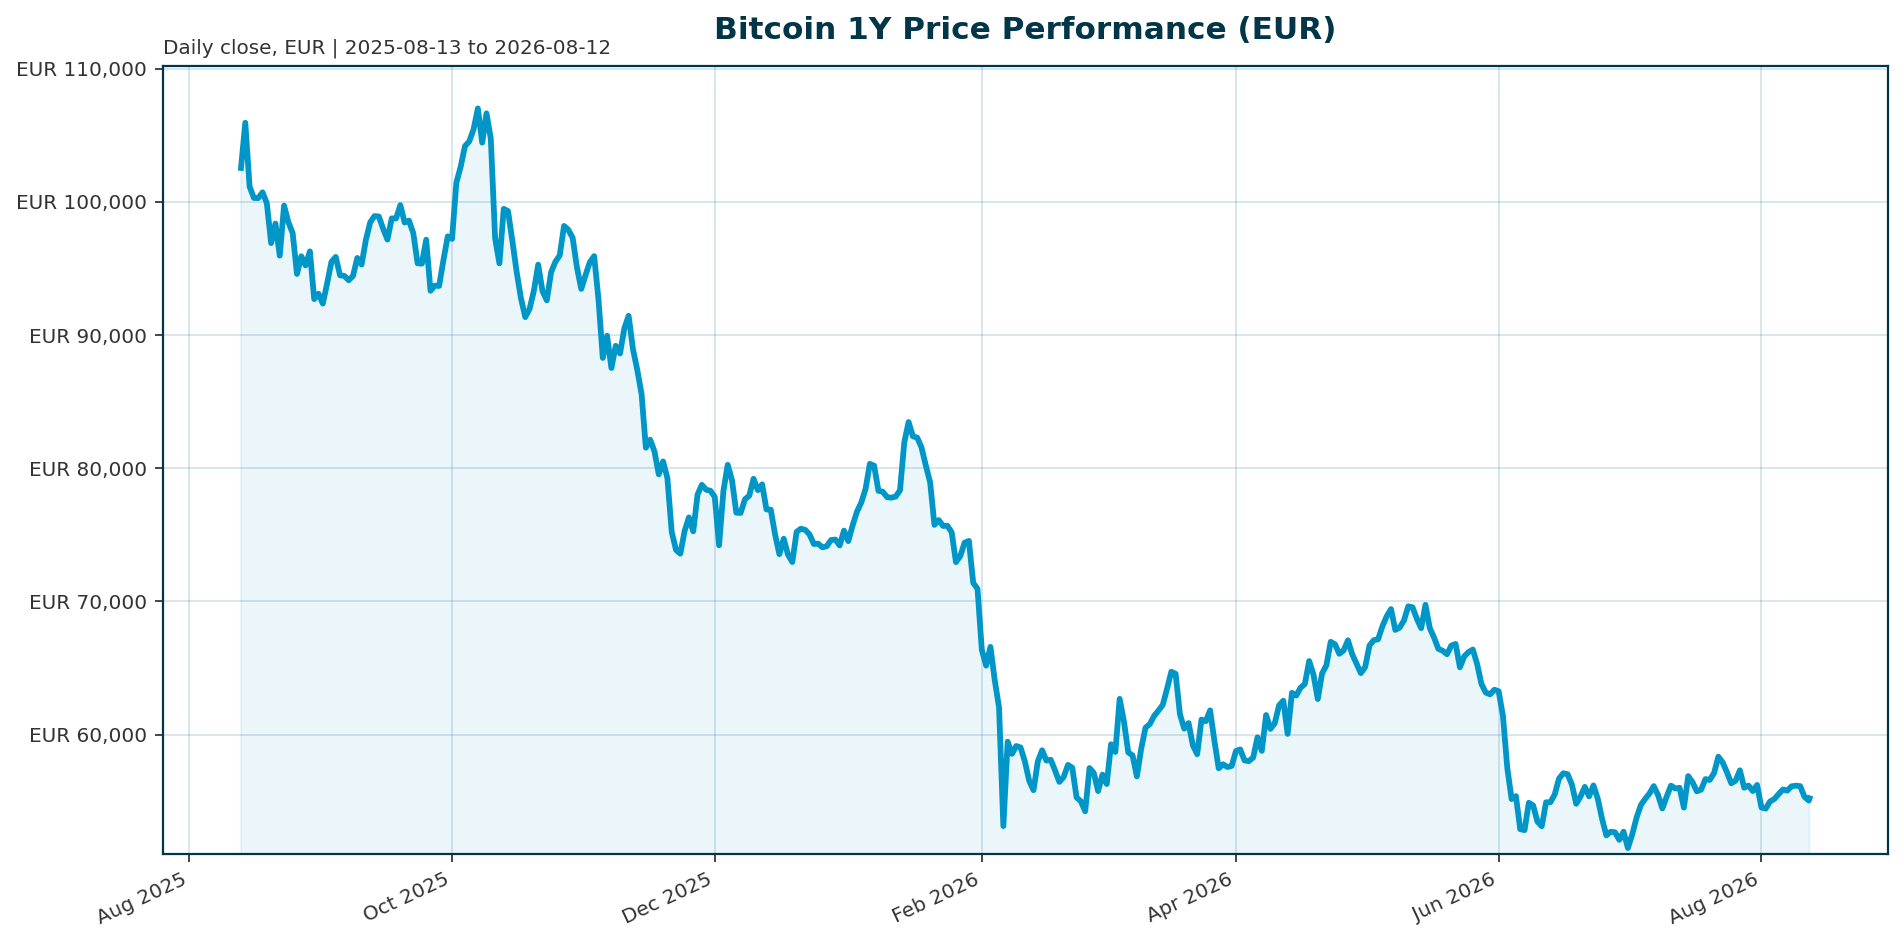
| Metric | Value |
|---|---|
| Current Price (EUR) | €55,244.00 |
| 24h Change | -0.40% |
| Market Cap (EUR) | €1.109T |
| 24h Volume (EUR) | €17.71B |
| BTC Dominance | 56.31% |
| All-Time High (ATH) | €107,662.00 (Oct 2025) |
| ATH Drawdown | -48.69% |
Market Setup
Risk sentiment is neutral to positive, supported by moderately positive equity momentum led by the DAX (+5.28% over one month) and Nikkei 225 (+1.53% over five days). The rates backdrop is mixed, with Euro area AAA 10Y yields at 3.20%, while FX markets show a mixed picture with EUR/USD at 1.1557. Despite the macro backdrop, Bitcoin has reclaimed psychological levels above $80,000, signaling a reassertion of bullish structure driven by renewed institutional flows [T1][T3].Investment Thesis
The investment thesis for Bitcoin has shifted from the traditional four-year halving cycle to a new market structure defined by continuous, large-scale institutional capital flows. Spot Bitcoin ETFs now dominate price discovery approximately 85% of the time, acting as the primary transmission mechanism for institutional capital allocation [T6][T8]. This structural shift has transformed Bitcoin from a purely speculative asset into a legitimate portfolio diversifier, with institutional demand historically exceeding new supply by 5.6 times during accumulation phases [T6].Bullish Drivers
ETF Inflows and Supply Dynamics: The primary bullish catalyst remains the acceleration of spot Bitcoin ETF inflows. BlackRock’s iShares Bitcoin Trust (IBIT) attracted approximately $1.7 billion in April alone, accounting for roughly 70% of total US spot Bitcoin ETF inflows [T1]. When ETF inflows exceed daily mining supply—as they did in May 2025 at levels of 2-3x—Bitcoin faces a structural supply deficit that supports price appreciation [T6]. Regulatory Progress: The potential passage of the CLARITY Act is a significant catalyst, offering a federal market-structure framework that would reduce legal uncertainty and unlock broader institutional participation [T2][T3]. Additionally, the expansion of crypto access by traditional finance giants, such as Morgan Stanley offering Bitcoin trading to retail clients, indicates deepening institutional integration [T1].Relative Positioning vs Gold and Ethereum
Bitcoin currently holds a 56.31% dominance over the total crypto market cap [market_data]. While Gold remains the primary safe haven asset sensitive to rate fluctuations, Bitcoin is increasingly viewed as “digital gold” with risk-on characteristics due to its correlation with risk assets and ETF-driven liquidity. Ethereum, conversely, is driven by technical cycles and smart contract utility. In a regime of improving macro conditions, Bitcoin is positioned to outperform Gold as institutional capital rotates into digital assets, whereas Ethereum may lead on specific tech narratives [T3][T8].Scenario Framework
Bullish Scenario (Recovery): If ETF inflows resume at levels exceeding mining supply and the CLARITY Act passes, Bitcoin could break above the $125,000 resistance level. This would target new all-time highs in the $140,000-$160,000 range by mid-2026, validating the structural adoption narrative [T6]. Base Case (Consolidation): In a scenario where volatility persists and ETF flows stabilize near supply levels, Bitcoin is likely to consolidate in a range between €50,000 and €70,000. This reflects a market adjusting to the new institutional era without the extreme boom-and-bust volatility of the past [T3]. Bearish Scenario (Liquidity Crunch): If the macro backdrop deteriorates with rates staying higher for longer or regulatory hurdles emerge, Bitcoin could test support levels below €50,000. ETF outflows would remove the structural demand floor, potentially reverting price action to more speculative dynamics [T3][T4].Valuation Discussion
Bitcoin is currently trading at €55,244, representing a drawdown of approximately 48.7% from its October 2025 ATH of €107,662. The implied upside to return to ATH is roughly 95% [market_data]. Valuation is currently supported by the Fully Diluted Valuation (FDV) of €1.109T, which aligns with the current market cap. However, the true valuation driver is the ETF supply-demand imbalance. If institutional demand continues to outpace new supply, the current valuation may be conservative relative to the asset’s utility as a store of value [T6].Risks
Macro Headwinds: The Federal Reserve, under Chair Kevin Warsh, is expected to hold rates through Q3, limiting room for policy easing that historically supports risk-asset recoveries [T2]. Inflation remains a persistent concern, and energy prices or geopolitical tensions could trigger a risk-off rotation out of Bitcoin [T3]. Regulatory Uncertainty: While progress is being made, the CLARITY Act faces last-minute pressure from banks. Failure to pass this legislation could stall institutional commitments and create uncertainty [T4]. Structural Reversal: If ETF flows reverse, they directly remove demand from markets. Given that ETFs now dominate price discovery, a sustained period of outflows would create mechanical selling pressure and signal deteriorating institutional confidence [T6].Appendix
Sources:- Bitcoin regains momentum above $80,000 as ETF inflows accelerate, institutional demand expands and regulatory progress boosts market sentiment | IG International [T1]
- Q2 2026 Digital Asset Review [T2]
- Bitcoin Holds Near $80K–$81K as ETF Inflows Revive Bullish Sentiment [T3]
- Bitcoin Breaks Out to $66.6K, Closing the Gap with Equities as ETF Flows Flip Positive [T4]
- BlackRock Bitcoin ETF Achieves Staggering $935M Q1 Inflow Milestone [T5]
- Yellow.com: Why Bitcoin ETF Demand Now Trails Daily Mining Supply [T6]
- Yellow.com: Why Bitcoin ETF Demand Now Trails Daily Mining Supply [T7]
- Bitcoin Price Faces a Pivotal Shift: New Market Structure, Institutional Funds, and Macroeconomics Now Drive Value [T8]
This report is AI-generated for informational purposes only and does not constitute investment advice. The views expressed herein are those of the author and do not reflect the official policy or position of Venice.ai or any other entity.
Important Note / Wichtiger Hinweis:
EN: This report may have been generated using AI. It processes data from publicly available sources. The content is provided for informational purposes only.DE: Dieser Bericht kann mithilfe von KI erstellt worden sein. Dabei werden Daten aus öffentlich zugänglichen Quellen verarbeitet. Die Inhalte dienen ausschließlich Informationszwecken.
* DE: Die ergänzenden Inhalte können KI-generiert sein. EN: The additional content may be AI-generated.