
Listen to the summary
Key Data Snapshot
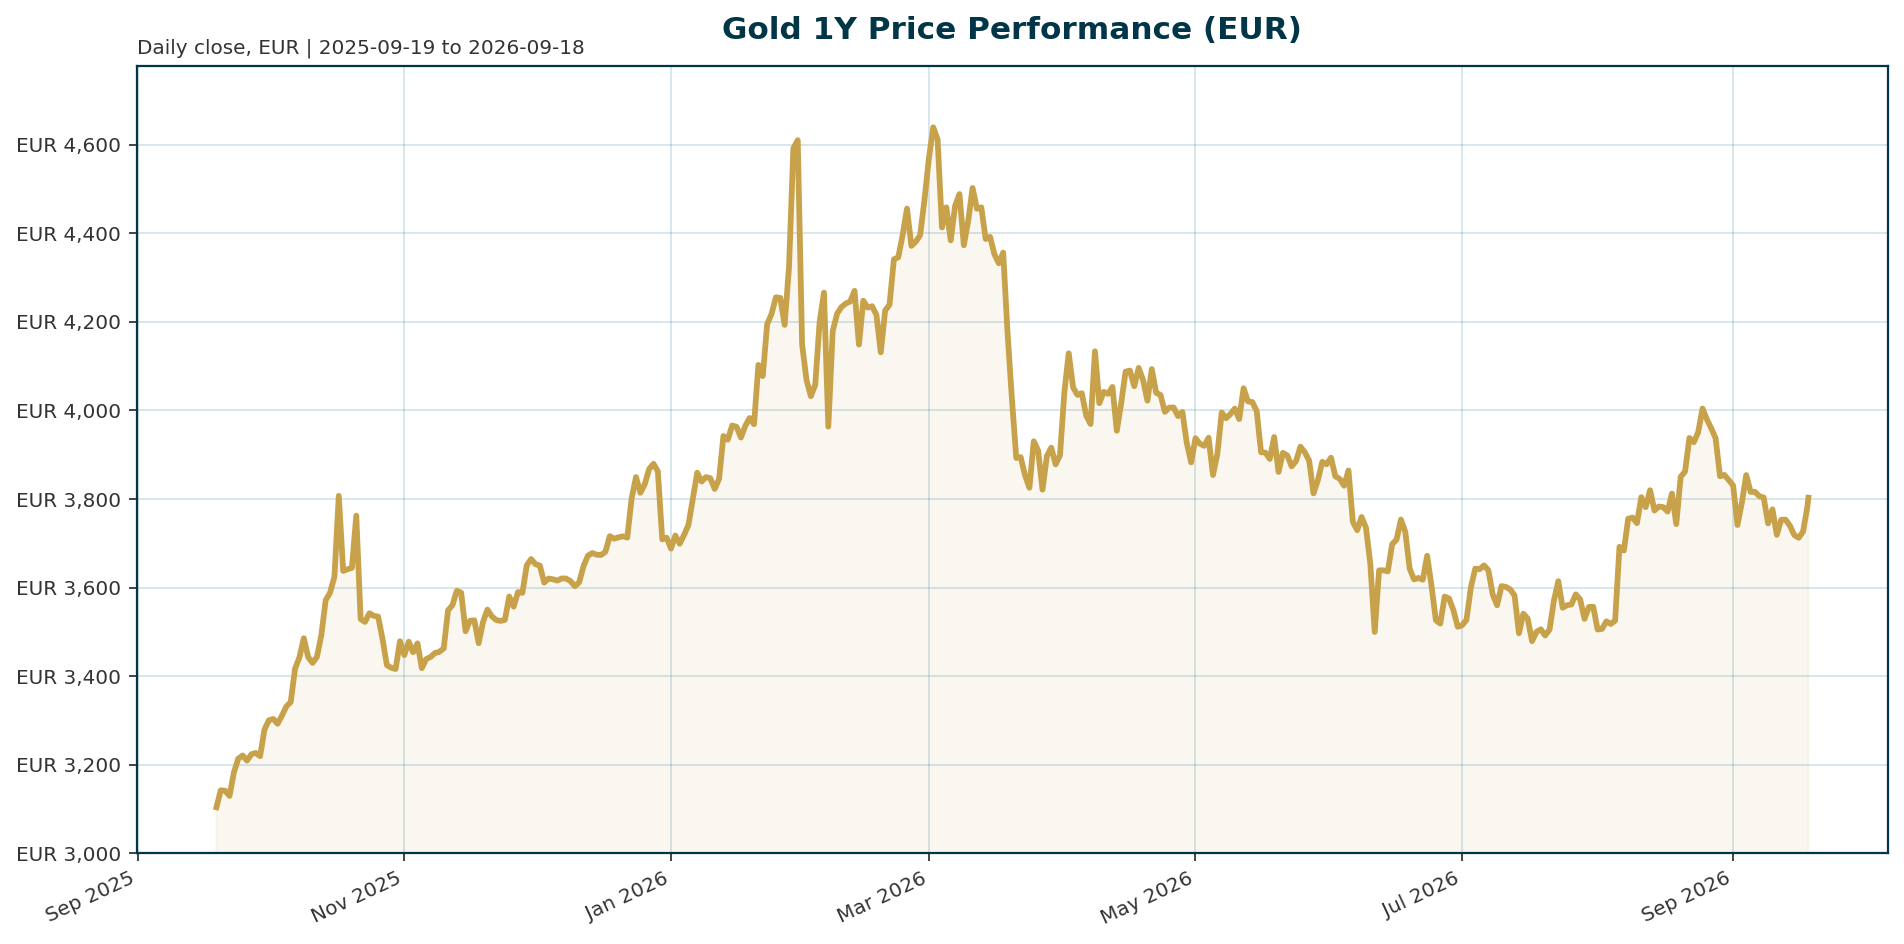
| Metric | Value | Detail |
|---|---|---|
| Spot price (XAU/EUR) | 3,795.32 | As of 2026-09-18 04:51 UTC |
| 24h change | +1.26% | 1h +0.20%, 7d +0.50% |
| 14d / 30d change | -2.8% / 0.0% | Short-term pullback within flat month |
| 200d change | -19.3% | Deep consolidation after the late-2025 run |
| 1y change | +18.7% | Strategic uptrend intact |
| 24h range | 3,730.71 to 3,808.22 | Range 77.51 EUR, about 2.0% of spot |
| All-time high | 4,688.32 (2026-01-28) | Spot is 19.05% below ATH |
| All-time low | 1,265.28 (2019-11-17) | Spot is 199.96% above ATL |
| Proxy market cap | 1,648.9m EUR | CoinGecko pax-gold proxy, rank 50 |
| Proxy 24h volume | 134.1m EUR | Turnover ratio: 134,128,014 / 1,648,935,661 = 8.13% |
| Proxy supply | 434,499.37 | Circulating equals total supply; max supply unavailable |
The price sits in the upper part of its 24-hour range: (3,795.32 minus 3,730.71) divided by (3,808.22 minus 3,730.71) equals 0.83. Note that the market cap and volume figures describe the tokenized gold proxy, not the global physical gold market.
Macro Backdrop
Broad market conditions are balanced rather than directional. Risk sentiment is neutral, equity momentum is mixed, and DACH indices are broadly in line with global peers: DACH indicators average +0.14% over five days against +0.57% for global equity indicators. The Nikkei 225 leads five-day performance at +2.91%, while the Hang Seng lags at -0.71%. In rates, the euro-area backdrop is mixed: the AAA 10Y yield stands at 3.53%, up 3.0 bp over five days but with the curve positively sloped at 36.8 bp (10Y minus 2Y). In FX, signals are also mixed: EUR/USD is 1.1513, down 0.56% over five days, while EUR/JPY shows the strongest five-day FX move at +0.31%. This is not a clean flight-to-safety tape, so the gold thesis must rest on metal-specific drivers rather than a simple risk-off bid.
For gold specifically, three macro channels dominate. First, real yields remain the main opportunity cost: the 10-year TIPS yield sits around 2%, high by recent standards but still inside the historical band where gold has compounded [T1]. Second, Fed pricing has swung hawkish, with two-year Treasury yields back above 4%, yet gold still trades well above its mid-2025 levels [T2]. Third, a post-2022 regime shift has taken hold: sustained central bank purchases, dedollarisation, geopolitical uncertainty and sovereign debt concerns appear to set a higher floor that limits the damage from elevated real rates [T2]. ING adds that geopolitics alone does not lift gold; it matters through inflation, policy expectations and real rates, and a stagflationary mix would be supportive over the longer term [T4].
Investment Thesis
The central question is whether structural official-sector demand has permanently raised gold’s price floor despite positive real yields. The evidence says yes, with clear caveats. Central banks accumulated an average of 1,000 tonnes per year over the past four years, double the 500-tonne average of the preceding decade, and a record 45% of WGC survey respondents expect their own reserves to rise over the next 12 months against only 1% expecting a decline [T6] [T7]. Socit Gnrale remains strategically bullish and argues that much of the hawkish rate adjustment is already priced, so downside risk for gold looks increasingly limited [T2].
For EUR investors, the price structure supports a barbell reading. The one-year return of +18.7% confirms the strategic trend, while the 200-day decline of -19.3% and the 19.05% drawdown from the January 2026 ATH of 4,688.32 confirm an extended cyclical consolidation. The base case is therefore a supported but range-bound market: official demand defends pullbacks while elevated euro-area and US yields cap upside until real-yield and dollar conditions improve. The +1.26% move over the last 24 hours fits this pattern of dip-buying rather than trend resumption.
Bullish Drivers
- Official-sector scale. Central bank buying of roughly 1,000 tonnes per year over four years is double the prior decade’s pace. Saxo separately flags 289 tonnes of central bank demand as a flow anchor [T6] [T3].
- Forward intent. A record 45% of surveyed reserve managers plan to increase gold holdings over the next year; only 1% plan to reduce [T7]. J.P. Morgan cites a record 43% of 73 monetary authorities expecting increases [T5].
- Geopolitical and sanctions hedging. 90% of survey respondents cited gold’s crisis performance as highly relevant, and EMDE institutions weight geopolitical instability most heavily (95% versus 67% in advanced economies) [T6]. Nations not allied with the United States are reducing dollar reserve exposure to limit sanctions vulnerability [T5].
- Rate pressure peaking. Softer US data, including a 0.6% drop in July retail sales, the first decline in nine months, reduced pressure on the Fed to tighten, and Goldman Sachs called a September hike very unlikely. The dollar index has begun to roll over [T3].
- ETF flows stabilizing. Inflows moderated sharply this year but remain positive per Socit Gnrale, and Saxo reports flows returning to gold [T2] [T3].
- Fiscal and inflation hedging. Lombard Odier highlights fiscal uncertainty and the gradual erosion of purchasing power as ongoing supports for real assets [T8].
Relative Positioning vs Bitcoin and Ethereum
The bundle provides crypto context but not direct BTC or ETH performance data, so quantitative relative returns are unavailable. What is provided: Bitcoin dominance stands at 58.05%, total crypto market capitalization at 2.32 trillion EUR (2,323,868,334,748), and 24-hour crypto volume at 73.6 billion EUR. Ethereum is a designated benchmark asset, but its spot price and return series are not included.
Qualitatively, gold’s institutional case rests on attributes neither digital asset currently replicates at scale. Central banks treat gold as a reliable store of wealth and a core component of long-term reserve strategies [T6] [T7]; no equivalent official-sector accumulation is evidenced for BTC or ETH in the provided material. Socit Gnrale frames gold as a hedge against monetary and policy uncertainty [T2], a role that depends on low correlation with risk-asset liquidity cycles, which is precisely where crypto assets are weakest. The bearish counterargument deserves equal weight: in a broad risk-on liquidity regime, Bitcoin and Ethereum can attract capital away from non-yielding metal, and gold’s own real-yield sensitivity has at times mirrored that of other zero-coupon duration-like assets. In a real-yield shock, both gold and crypto face valuation pressure, but gold carries a demand floor from reserve managers that crypto lacks documented support for. Data limitations prevent scoring this contest numerically this cycle; the structural hedge allocation argument favors gold, the tactical liquidity argument can favor crypto.
Scenario Framework
| Scenario | Macro conditions | XAU/EUR implication |
|---|---|---|
| Base (highest probability) | Fed holds for much of 2026 with cuts only late in the year [T8]; real yields stay positive but stable; central bank buying continues near 1,000t annual pace [T6] | Range-bound around 3,700 to 3,900 EUR; structural floor limits drawdowns, elevated yields cap breakouts |
| Bull | Real yields fall, USD softens further, ETF inflows rebuild, Fed cuts deliver [T3] [T8] | Recovery toward the 4,688.32 EUR ATH; closing even half the current 19.05% gap implies roughly 4,240 EUR |
| Bear | Inflation or employment surprises revive real yields and the dollar together, the combination Saxo calls the most challenging backdrop [T3] | Break of consolidation support; extension of the 200-day decline below the current 19.3% drawdown |
| Stagflation | Slower growth with persistent inflation; energy prices complicate the easing path [T4] | Supportive over the longer term despite interim yield volatility |
Valuation Discussion
Gold has no cash flows, so valuation reduces to opportunity cost and demand structure. The historical inverse relationship with real yields has broken down post-2022: gold trades near record highs even though models built on real yields would imply significantly lower prices, because central bank purchases, dedollarisation and sovereign debt concerns provide a higher floor [T2] [T5]. If that regime holds, valuation should be framed as a floor problem, not a reversion problem.
Levels, with calculations shown. Current spot is 3,795.32 EUR, 19.05% below the ATH (3,795.32 / 4,688.32 minus 1 equals -19.05%) and 199.96% above the 2019 ATL (3,795.32 / 1,265.28 minus 1 equals +200.0%). Saxo’s USD technical references convert as follows at EUR/USD 1.1513: the USD 4,500 level, where the 200-day moving average sits, equals roughly 3,906 EUR (4,500 / 1.1513), and the USD 4,200 consolidation threshold equals roughly 3,648 EUR (4,200 / 1.1513) [T3]. The current EUR spot sits between these two translated levels, consistent with a market consolidating between defined technical boundaries. The near-term intraday range of 3,730.71 to 3,808.22 EUR is tight at about 2.0% of spot, and the 8.13% daily turnover ratio on the tokenized proxy indicates healthy quoted liquidity. On the bearish side of the ledger, if real-yield sensitivity fully reasserts, valuation risk skews to the downside because a roughly 2% 10-year TIPS yield keeps the opportunity cost of holding a non-yielding asset elevated [T1].
Risks
- Synchronized real-yield and dollar shock. Renewed inflation or employment strength reviving both real yields and the USD is the clearest identified downside [T3]. Two-year Treasury yields above 4% have already supported the dollar [T2].
- Higher-for-longer rates. ING warns that a restrictive environment keeps real yields elevated and complicates easing; energy-driven inflation adds to this risk [T4].
- Slowing official demand. ING notes central banks remain supportive but buying may slow [T4]; Lombard Odier flags a prolonged ETF demand decline or weaker physical demand, such as jewellery, as negative factors [T8].
- Profit-taking. After strong year-to-date gains in the cited context, the market is vulnerable to bouts of profit-taking, though deeper pullbacks tend to attract central bank and long-term buyers [T4].
- EUR translation risk. A sharp EUR appreciation against the USD would make EUR-denominated gold lag USD gold even if the metal is stable in dollar terms. The current EUR/USD YTD move of -2.03% has been working in the opposite, favorable direction.
- Interpretation risk on the 200-day decline. If investors read the -19.3% 200-day change as trend deterioration rather than consolidation, momentum selling could dominate near-term flows.
- Data limitation. Market cap, volume and supply figures in this report describe the CoinGecko pax-gold proxy, not the global physical gold market, and should not be used for aggregate gold valuation.
Appendix
Calculations
- Ath drawdown: (3,795.32 / 4,688.32 – 1) x 100 = -19.05% (reconciles with provided -19.04721%).
- Distance above ATL: (3,795.32 / 1,265.28 – 1) x 100 = +199.96% (reconciles with provided +199.95809%).
- 24h range: 3,808.22 – 3,730.71 = 77.51 EUR, or 77.51 / 3,795.32 = 2.04% of spot.
- Position in 24h range: (3,795.32 – 3,730.71) / 77.51 = 0.83.
- Proxy turnover: 134,128,014 / 1,648,935,661 = 8.13%.
- Euro-area 10Y-2Y spread: 3.5335% – 3.1658% = 36.8 bp (reconciles with market overview).
- USD-to-EUR level translation: USD 4,500 / 1.1513 = 3,906 EUR; USD 4,200 / 1.1513 = 3,648 EUR.
- Central bank demand step-up: 1,000t four-year average / 500t prior-decade average = 2.0x.
- Euro-area 10Y yield momentum: +3.0 bp over 5 days, +29.1 bp over 1 month, +58.5 bp YTD.
Data Caveats
- Market cap, volume, supply and rank data derive from CoinGecko’s pax-gold entry and serve as a quoted-market proxy only.
- Direct USD gold spot is not in the bundle; USD technical levels are translated at the current EUR/USD of 1.1513 and are approximate.
- No euro-area or US real-yield time series, no inflation expectations data, and no live ECB policy-rate table are provided; real-yield and policy discussion relies on cited commentary.
- BTC and ETH spot prices, performance series and flow data are not included; relative crypto performance is unavailable.
- Market overview as-of dates vary: equities and FX are dated 2026-09-17 to 2026-09-18, euro-area yields are dated 2026-09-16. The overview module reported no errors.
- Central bank figures are survey-based and structural in nature, not near-term price-timing signals.
Sources
- [T1] Central Banks Are Snapping Up Gold, ETF Investors Are Just Waking Up (24/7 Wall St.)
- [T2] It’s time to get bullish on gold again, says SocGen (Kitco News)
- [T3] ETF flows return to gold as Saxo flags 289-tonne central bank demand (investingLive)
- [T4] Geopolitics alone isn’t enough to lift gold (ING THINK)
- [T5] Is it a golden era for gold? (J.P. Morgan Private Bank)
- [T6] Central Bank Gold Purchases Hit 1,000t Average: WGC Survey (Mexico Business News)
- [T7] Central banks to increase gold reserves over next 12 months: WGC survey (The Hindu)
- [T8] Gold’s slowdown doesn’t signal a reversal (Lombard Odier)
This report is AI-generated and is provided for informational purposes only. It does not constitute investment advice, a recommendation, or an offer to buy or sell any financial instrument. Figures are drawn from third-party data and commentary that may contain errors or reflect different market contexts; readers should verify all data independently before making decisions.
Important Note / Wichtiger Hinweis:
EN: This report may have been generated using AI. It processes data from publicly available sources. The content is provided for informational purposes only.DE: Dieser Bericht kann mithilfe von KI erstellt worden sein. Dabei werden Daten aus öffentlich zugänglichen Quellen verarbeitet. Die Inhalte dienen ausschließlich Informationszwecken.
* DE: Die ergänzenden Inhalte können KI-generiert sein. EN: The additional content may be AI-generated.