
Listen to the summary
Key Data Snapshot
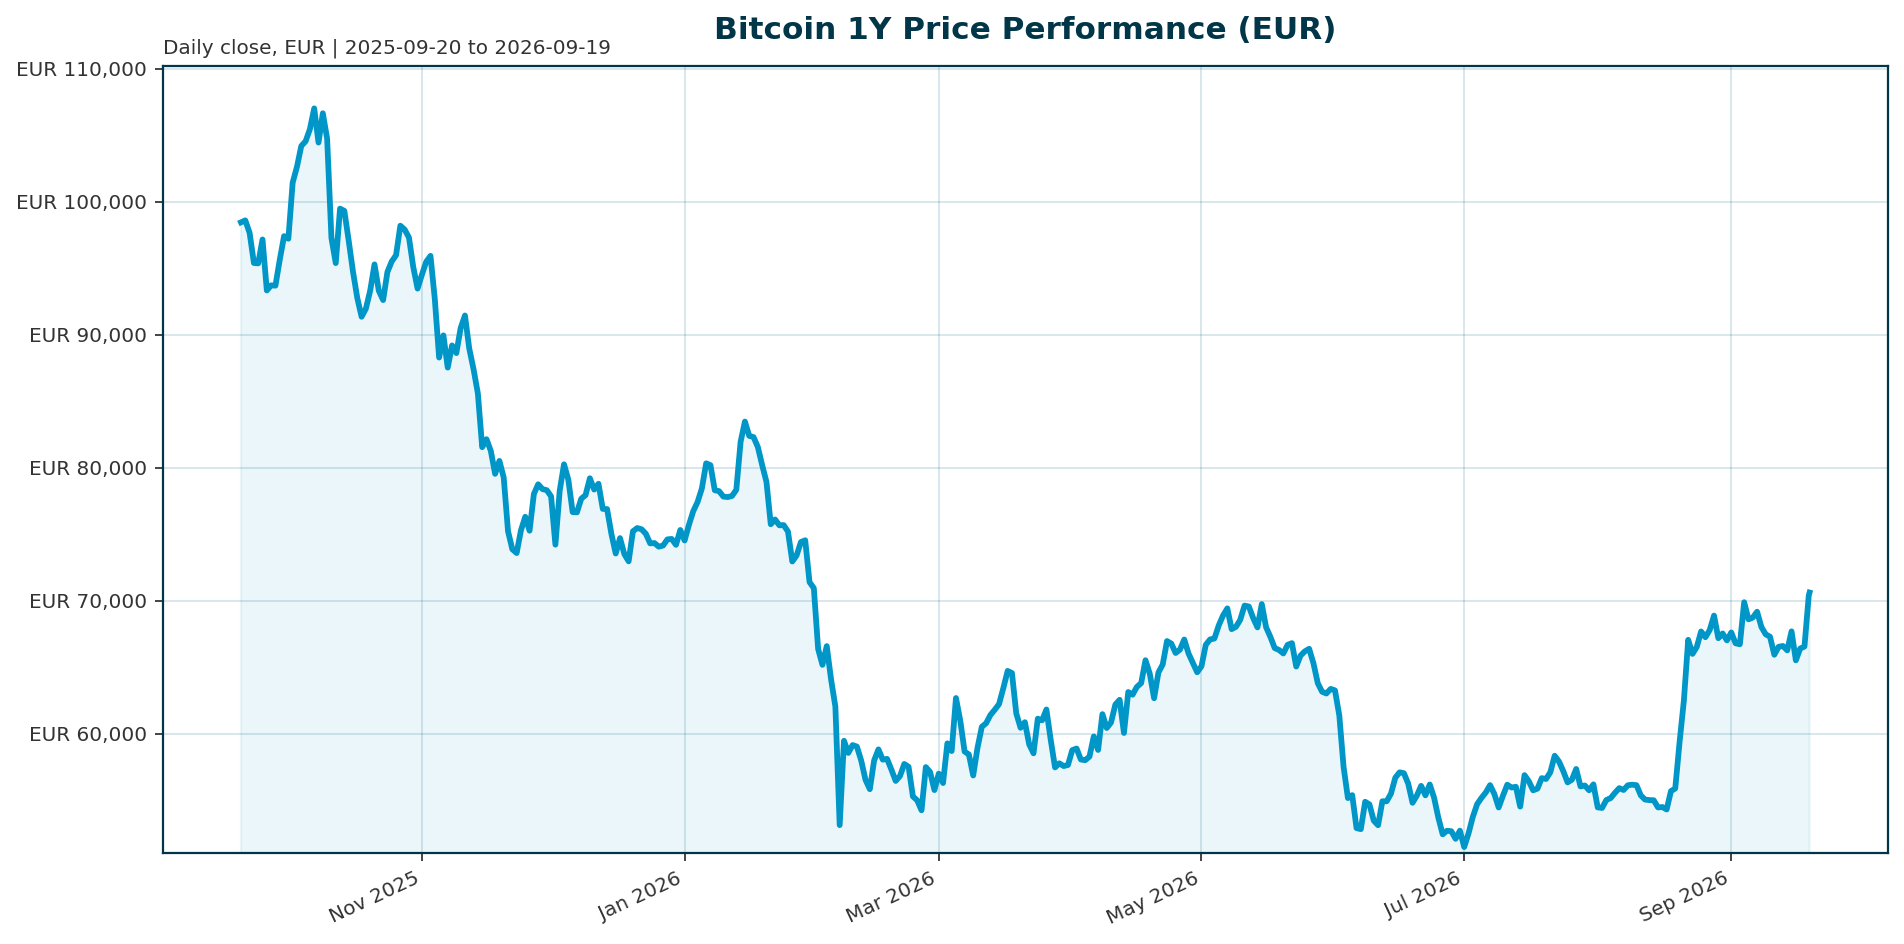
Data retrieved 2026-09-19, 04:15 UTC. All figures in EUR unless stated otherwise.
| Metric | Value | Note |
|---|---|---|
| Price | EUR 70,658 | 24h range EUR 67,334 to 71,093 |
| Market cap | EUR 1.419 trn | Rank 1; 24h change +EUR 69.1bn (+5.12%) |
| Fully diluted valuation | EUR 1.419 trn | Equals market cap; supply 95.65% mined |
| 24h volume | EUR 38.46bn | Turnover ratio 2.71% of market cap (38.46/1,419.27) |
| Change 24h / 7d / 14d | +5.10% / +5.00% / +1.90% | 1h: -0.20% |
| Change 30d / 200d | +17.10% / +18.40% | Mid-cycle recovery pattern |
| Change 1y | -30.80% | Drawdown asset, not breakout |
| All-time high | EUR 107,662 (2025-10-06) | Currently -34.37%; recovery needed +52.4% (107,662/70,658 – 1) |
| Circulating supply | 20,086,393 BTC | 95.65% of 21m cap; remaining issuance ~913,607 BTC |
| BTC dominance | 58.32% | Total crypto market cap EUR 2.428 trn; cross-check 1,419.27/2,427.51 = 58.4% |
Market Setup
Risk sentiment is neutral and equity momentum is mixed, with DACH indicators broadly in line with global peers: DACH averaged -0.01% over five days versus +0.85% for global indicators. The Nikkei 225 leads five-day performance at +2.40%, the Hang Seng trails at -0.67%, and the ATX tops one-month performance at +3.11%. The rates backdrop shows euro yields mixed with curve flattening: the euro area AAA 10Y yield stands at 3.49%, down 3.5bp over five days, while the 10Y-2Y spread sits at 33.9bp and the 2Y has risen 103.97bp year to date. The FX backdrop is mixed, with EUR/USD at 1.1497 (-0.45% over five days, -2.17% YTD) and EUR/JPY posting the strongest five-day move at +0.65%. This backdrop matters for Bitcoin primarily through liquidity conditions: under Fed Chair Kevin Warsh, the central bank is expected to hold rates through Q3, leaving limited room for the policy easing that has historically supported risk-asset recoveries [T2]. Rising government bond yields raise the opportunity cost of holding a volatile, non-yielding asset like BTC, making institutional buyers more selective [T6]. Equity anchors frame the risk environment: S&P 500 at 7,650.5 (+11.76% YTD), Nasdaq +14.11% YTD, DAX 25,304 (-3.02% over one month).
Investment Thesis
Bitcoin has transitioned from a halving-cycle speculative asset into an ETF-led, allocatable institutional line item whose price is now governed by three variables: market structure, institutional fund flows, and the macroeconomic environment [T7]. The evidence for this regime shift is concrete. ETF flows have effectively become Bitcoin’s new macro indicator; record outflows from U.S.-listed BTC and ETH ETFs in Q4 2025 coincided with the break of key support around $98,000 and a retest of the low $90,000 range [T1]. Annualized volatility has compressed from 84% to 43%, consistent with institutionalization [T1], and Ark Invest cites a broader decline from over 100% to roughly 50-80% [T4]. By end-2025, 6.7 million BTC sat across ETFs, exchanges and treasuries, which Glassnode labelled Bitcoin’s “institutional supply era” [T1].
At EUR 70,658, BTC is a recovering drawdown asset, not a momentum breakout: up 17.1% over 30 days on renewed institutional bid, yet still 34.37% below its October 2025 ATH and down 30.8% year over year. The bearish counterweight is that the Q4 2025 correction erased more than $1 trillion in market value, a nearly 30% peak-to-trough decline in which BTC lagged gold and bonds, confirming it remains a high-beta corner of global markets even in the institutional era [T1]. The thesis therefore rests on flow persistence: if ETF inflows sustain (daily inflows exceeding $400m were cited in 2026 commentary, with a $467m single-day net inflow recorded on 5 May) [T5][T8], the recovery extends; if flows stall, the spot market loses its clearest marginal demand source [T6].
Bullish Drivers
- ETF channel: Renewed inflows have revived bullish sentiment and institutional demand is visible again; reclaiming the $80,000 level signals the bullish structure reasserting itself [T3][T8].
- Regulatory catalyst: The CLARITY Act would establish a federal market-structure framework for digital assets and potentially unlock broader institutional participation if passed [T2]. Hong Kong’s Stablecoins Ordinance and Asian tokenization deployment broaden the institutional adoption base, though pure BTC ETFs play a smaller strategic role in Asia than in North America and Europe [T2].
- Institutional penetration: 94% of institutional investors now recognize the long-term value of blockchain technology, with daily ETF inflows consistently exceeding $400m per secondary commentary [T5].
- Third-party targets: JPMorgan’s flow-based model projects a $150,000 peak target for Q4 2026 at 72% confidence; Ark Invest maintains a $200,000 2026 milestone and $1,000,000 by 2030, explicitly based on capturing store-of-value market share from gold [T5]. These are attributed external views, not altii forecasts.
- Supply scarcity: 95.65% of the 21 million cap is already circulating; price discovery is entirely demand-driven with no meaningful dilution overhang.
- Volatility compression: Ark argues BTC will never again suffer a greater than 80% peak-to-trough crash, citing ETF AUM, corporate treasury buys, custody depth and derivatives depth [T4]. Historical drawdowns were ~86% (2013), ~83% (2017-18) and over 75% (2022) [T4].
Bearish counterpoint: CoinShares’ caution remains relevant. The improved balance of risks is still highly dependent on flows and macro conditions, and the $80,000 reclaim does not guarantee a straight path higher [T3].
Relative Positioning vs Gold and Ethereum
vs Gold: Gold won the 2025 allocation debate. During the Q4 2025 correction, BTC lagged gold and bonds, a reminder that even institutionalized crypto behaves as high beta [T1]. This matters for conservative mandates: in a debasement-trade scenario where rates stay high but fiscal concerns rise, both gold and BTC benefit, but gold’s lower volatility wins conservative allocations while BTC suits risk-budgeted sleeves. Ark’s long-term thesis explicitly frames BTC as a store-of-value challenger to gold [T5], and the current 34.37% discount to ATH versus gold’s 2025 strength keeps that contest unresolved. No same-day gold price or return data is available in the bundle; the comparison rests on the qualitative 2025 evidence [T1].
vs Ethereum: BTC and ETH share a correlated flow regime. Record Q4 2025 outflows hit both BTC and ETH ETFs jointly [T1], so ETH provides little diversification against the ETF-flow risk factor; the two assets are exposed to the same marginal demand channel. BTC’s 58.32% dominance confirms it remains the primary institutional gateway within crypto. In a crypto-rotation scenario, the dominance trend is the tell: if it holds, rotation is BTC-first; if it erodes, alt/ETH beta is catching up.
Regional nuance: Asia deploys institutional capital primarily through tokenization of real-world assets and regulated stablecoins rather than pure BTC ETFs [T2], meaning the BTC-specific flow catalyst is concentrated in North American and European vehicles.
Scenario Framework
Twelve-month view. USD reference levels from sources are converted at EUR/USD 1.1497 (e.g. $80,000 = ~EUR 69,600; $90,000 = ~EUR 78,300; $150,000 = ~EUR 130,500). Probabilities and bands are explicit analyst assumptions, not source-derived.
| Scenario | Prob. (assumed) | Triggers | EUR reference zone |
|---|---|---|---|
| Bear | ~25% | ETF outflow resumption (Q4 2025 precedent [T1]), Fed holds beyond Q3 [T2], yield surge repeat [T6] | Retest of Q4 2025 cycle low zone; EUR drawdown risk 20-30% from spot (roughly EUR 49,000-56,500). Historical cycle drawdowns of 75-86% [T4] imply an extreme floor near EUR 26,900, an illustrative stress reference only. |
| Base | ~50% | Range-bound accumulation between $80k-95k equivalents with the CLARITY Act as a binary catalyst [T3][T8] | ~EUR 69,600 to 82,600 equivalent; flat to modestly positive EUR return, tracking the $80k-equivalent floor. |
| Bull | ~25% | CLARITY Act passes, sustained inflows above $400m/day, JPMorgan $150k / Ark $200k band [T2][T5] | ~EUR 104,000 to 130,500 equivalent by Q4 2026; EUR outperformance versus equities. |
Probability-weighted reference: 0.25 x ~EUR 52,000 + 0.50 x ~EUR 76,000 + 0.25 x ~EUR 117,000 = ~EUR 80,250. Labelled as analyst scenario math, not a forecast. The compressed volatility regime (43% annualized [T1]) narrows scenario dispersion relative to prior cycles.
Valuation Discussion
BTC’s valuation framework has shifted from scarcity-timing models to flow-based and adoption-based approaches. With FDV equal to market cap at EUR 1.419 trn and 95.65% of supply circulating, there is no dilution overhang: price is purely demand-determined, which makes the ETF flow channel the single most important valuation input. JPMorgan’s $150,000 target rests on a flow-based model treating ETF inflows and treasury adoption as structural demand vectors that augment traditional halving dynamics [T5]; mechanically translated at EUR/USD 1.1497, that implies ~EUR 130,500 by Q4 2026. Ark’s $1m 2030 figure assumes BTC captures significant market share from gold’s store-of-value role [T5]. Both should be treated with caution: methodology detail is limited and the figures are promotional third-party views.
On relative-value metrics, the discount anchors matter: at -34.37% from ATH, BTC is priced well inside historical cycle drawdowns of 75-86% [T4], which supports the maturation argument but does not preclude deeper drawdowns in a macro or flow shock. The float-scarcity metric of 6.7 million BTC in institutional custody channels [T1] and the market cap above $1 trillion threshold cited by Ark against 80%-plus crashes [T4] underpin a higher Sharpe-ratio framing that justifies larger strategic allocations. A downside stress reference: applying a historical 75% drawdown to the EUR 107,662 ATH implies roughly EUR 26,900, an illustrative extreme rather than a forecast. Note that all USD-denominated targets carry EUR/USD translation risk for euro-based investors.
Risks
- Rate persistence: The Warsh Fed is expected to hold rates through Q3, limiting easing support [T2]. Rising U.S. Treasury yields act as a clear macro headwind, raising the opportunity cost of holding a non-yielding asset [T6]. Euro-area 2Y yields are up 104bp YTD, compounding the restrictive backdrop.
- ETF flow concentration: When flows weaken, the spot market loses its clearest source of marginal demand [T6]. A single week of record outflows, as in Q4 2025, coincided with the break of $98,000 support [T1], showing how tightly price is coupled to regulated capital movement.
- High-beta drawdown behavior: The Q4 2025 correction erased over $1 trillion in market value with BTC lagging gold and bonds [T1]. Black-swan regulatory, technological or macro shocks could still trigger sharp declines despite structural maturity [T4].
- FX translation: For EUR-based investors, EUR/USD strength drags on USD-quoted BTC returns. EUR/USD is -2.17% YTD, which has been a modest EUR tailwind this year, but the decomposition of the -30.8% one-year EUR return into FX versus USD-quoted BTC decline is not possible from the bundle because the USD-quoted BTC one-year return is unavailable.
- Data gap on flow momentum: Source flow figures span May 2026 [T8] and Q4 2025 [T1]; no current-week ETF flow figure is available, so the near-term flow argument carries a timing risk.
Appendix
Methodology and data notes: Bundle data retrieved 2026-09-19T04:15 UTC; equity data as of 2026-09-18; euro-area yields as of 2026-09-17. USD-to-EUR conversions use spot EUR/USD 1.1497. Scenario probabilities and bands are analyst assumptions, not derived from cited sources. Third-party price targets (JPMorgan, Ark Invest) are attributed external views, not altii forecasts. Several cited statistics (94% institutional recognition, $400m-plus daily inflows, 56% prediction-market probability) come from undated secondary commentary and should be treated accordingly. No on-chain metrics beyond qualitative descriptions are available in the bundle.
Glossary: FDV: fully diluted valuation, market cap at maximum supply. BTC dominance: BTC market cap as share of total crypto market cap. ETF net flow: daily creations minus redemptions in spot ETFs. ATH/ATL: all-time high/low. Halving cycle: quadrennial reduction of new BTC issuance. CLARITY Act: proposed U.S. federal market-structure framework for digital assets. Stablecoins Ordinance: Hong Kong legislation requiring full reserve backing, redemption rights and risk controls for stablecoin issuers.
Sources:
- [T1] Crypto Market 2025: Year-End Review & Expert Insights (TradingView/99Bitcoins)
- [T2] Q2 2026 Digital Asset Review (CoinDesk Indices)
- [T3] Bitcoin Holds Near $80K-$81K as ETF Inflows Revive Bullish Sentiment (HedgeCo)
- [T4] Bitcoin Price Prediction: Cathie Wood’s Bold Claim on Future Volatility (CryptoRank)
- [T5] Bitcoin Price Prediction 2026: Institutional Adoption & ETF (Intellectia)
- [T6] US Treasury yields surge to new highs as liquidity tightens (CryptoSlate)
- [T7] Bitcoin Price Faces a Pivotal Shift: New Market Structure, Institutional Funds, and Macroeconomics Now Drive Value (CryptoRank)
- [T8] Bitcoin Price Analysis May 2026 (Intellectia)
Disclaimer: This report is AI-generated and for informational purposes only. It does not constitute investment advice, a recommendation, or an offer to buy or sell any financial instrument. Readers should conduct their own research and consult a licensed advisor before making investment decisions.
Important Note / Wichtiger Hinweis:
EN: This report may have been generated using AI. It processes data from publicly available sources. The content is provided for informational purposes only.DE: Dieser Bericht kann mithilfe von KI erstellt worden sein. Dabei werden Daten aus öffentlich zugänglichen Quellen verarbeitet. Die Inhalte dienen ausschließlich Informationszwecken.
* DE: Die ergänzenden Inhalte können KI-generiert sein. EN: The additional content may be AI-generated.