
Watch the video
This player shows only the Bitcoin chapter of the daily altii market briefing. Watch the full video on tube.altii.de.
Key Data Snapshot
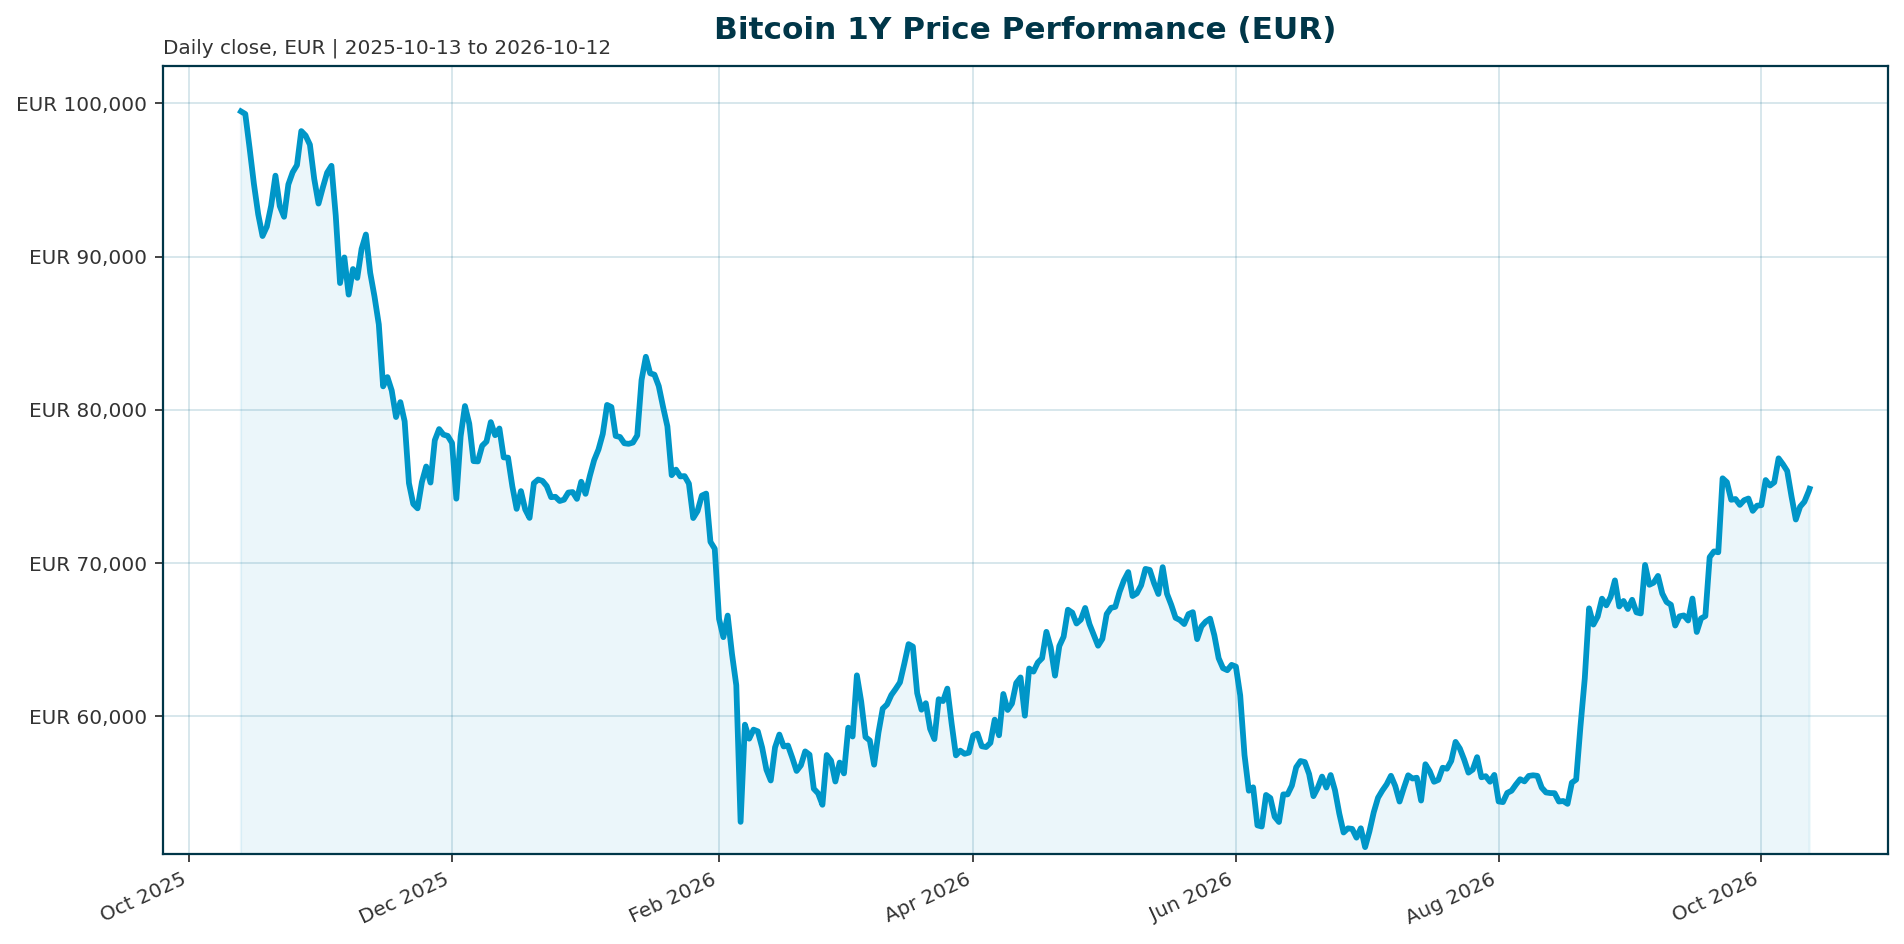
| Metric | Value | Read-through |
|---|---|---|
| BTC spot price | €74,458 | Current EUR reference price |
| Market capitalization | €1.496 trillion | Rank 1 crypto asset |
| Fully diluted valuation | €1.496 trillion | Close to market cap because most supply is already circulating |
| 24h volume | €15.228 billion | Volume / market cap = €15.228bn / €1,496.316bn = 1.02% |
| BTC dominance | 59.68% | BTC market cap / total crypto market cap |
| Total crypto market cap | €2.503 trillion | Total crypto 24h volume: €50.095 billion |
| Performance | 1h -0.28%, 24h +0.74%, 7d -3.43%, 14d +0.16%, 30d +8.12%, 200d +17.91%, 1y -24.20% | Constructive medium-term tape, still weak over one year |
| 24h range | €73,944 to €74,994 | Range width: €1,050, equal to 1.41% of spot |
| All-time high | €107,662 on 2025-10-06 | Current drawdown -30.84%; upside to ATH = €107,662 / €74,458 – 1 = 44.6% |
| Supply | 20,096,890 BTC circulating; 21,000,000 BTC max | Circulating / max supply = 20,096,890 / 21,000,000 = 95.7%; remaining to max: 903,110 BTC |
Bitcoin trades in a consolidation phase below its prior high. The bullish case rests on scarcity, institutional access, and ETF demand. The bearish case rests on weak one-year performance, negative seven-day momentum, and sensitivity to liquidity conditions.
Market Setup
The cross-asset backdrop is neutral rather than clearly risk-on. The market-overview module shows neutral risk sentiment, mixed equity momentum, mixed euro yields, and mixed FX. DACH equities lag global equities, with DACH indicators averaging -1.83% over five days versus -0.37% for global equity indicators. The S&P 500 has the strongest five-day move at +0.48%. Euro area AAA 10Y yield is 3.52%, up 5.5 bp over five days, while the 10Y-2Y spread is 48.6 bp. EUR/USD is 1.1218, up 0.12% over five days.
For Bitcoin, this is a demand-versus-discount-rate setup. Spot bitcoin ETFs have become a primary regulated channel for U.S. institutional and retail exposure, making flows an important signal of demand [T2]. However, monetary policy, inflation persistence, balance-sheet policy, ETF flows, and regulation remain key variables for BTC exposure [T2]. Sources also warn that macro can overpower structural ETF demand when yields remain high or liquidity tightens [T3]. ETF and ETP flows should therefore be read alongside spot volume, macro conditions, and on-chain demand, not as a standalone signal [T7].
The base case is balanced: neutral risk sentiment and mixed EUR rates mean BTC needs idiosyncratic support from ETF demand, adoption, or regulatory clarity to extend gains. A softer inflation and lower-yield path would support the bull case. Sticky inflation, higher yields, or renewed ETF outflows would raise the opportunity cost of holding a non-yielding asset.
Investment Thesis
Bitcoin remains the institutional gateway asset within crypto. It combines rank 1 market capitalization, 59.68% crypto-market dominance, high liquidity, and a fixed 21 million BTC maximum supply. With 20,096,890 BTC already circulating, 95.7% of the maximum supply is outstanding. That makes incremental demand more important than new issuance in determining price elasticity.
The institutional thesis has four pillars. First, regulated access has improved. Spot bitcoin ETFs are now a primary access channel and an important read on institutional demand [T2]. Second, physical creation mechanics matter: when ETF demand is positive, issuers must acquire bitcoin to back newly created shares, creating spot demand [T8]. Third, institutional participation is broadening across asset managers, wealth managers, pension funds, ETF markets, corporate treasuries, and regulated derivatives markets [T8]. Fourth, the post-2024 halving supply regime operates alongside ETF and corporate treasury demand vectors [T1].
The counterpoint is that institutionalization can increase two-way trading rather than guarantee long-term allocation. Sources note that corporate treasury activity remains sensitive to financing conditions, and Strategy reportedly slowed additional purchases amid weaker financing conditions and falling ETF demand [T8]. The thesis is therefore positive but conditional: BTC retains reserve-asset status within crypto, but sustained price appreciation requires persistent net demand.
Bullish Drivers
- ETF demand concentration: Bitcoin ETFs reportedly pulled in approximately USD 3.1 billion over nine straight sessions while Ether funds turned slightly negative, indicating that institutional demand was concentrating in BTC rather than broader crypto beta [T3].
- Recent positive flow prints: Bitcoin ETFs reportedly absorbed USD 134.4 million over the first two trading sessions of the month, reversing the September 30 outflow [T4]. Another source reported USD 1.92 billion of bitcoin ETF inflows in the prior week, with BlackRock’s IBIT making up a significant share [T5].
- Regulated wrappers reinforce the scarcity narrative: Sources frame ETF inflows as evidence of a deepening institutional footprint and demand through regulated fund structures rather than purely retail speculation [T5].
- Regulatory clarity could unlock allocation: Clearer market-structure rules could reduce a major barrier to institutional crypto ETF adoption, while many institutions require clearer compliance frameworks before meaningful allocations [T6].
- Supply constraints remain structural: Bitcoin’s 21 million BTC cap, high circulating-supply ratio, and post-halving issuance regime support the scarcity case [T1].
The bullish setup is credible but not self-executing. ETF demand must persist over weeks and months. If inflows continue but price fails to respond, that would suggest that institutional demand is being absorbed by equally strong supply [T3].
Relative Positioning vs Gold and Ethereum
Bitcoin sits between two institutional comparators: gold as the traditional store-of-value asset, and Ethereum as the closest crypto-native alternative. Current gold price, gold market capitalization, Ethereum price, Ethereum market capitalization, ETH/BTC ratio, and gold/BTC ratio are unavailable in the provided bundle. The relative discussion is therefore qualitative.
Versus gold, Bitcoin offers programmatic scarcity, portability, and growing ETF-based access, but it lacks gold’s long history as a reserve asset and remains more volatile. Some third-party valuation frameworks focus on Bitcoin’s potential to capture market share from traditional store-of-value assets such as gold [T1]. That is a plausible long-term narrative, but not a valuation proof.
Versus Ethereum, Bitcoin currently has the stronger institutional flow signal in the cited source set. One source reports that Bitcoin ETFs attracted approximately USD 3.1 billion over nine straight sessions while Ether funds turned slightly negative [T3]. The same source argues that this concentration could give BTC stronger downside support than broader crypto while leaving ETH and higher-beta assets lagging [T3].
The bearish relative risk is rotation. The crypto ETF market is expanding beyond Bitcoin and Ethereum into other assets, which could eventually broaden institutional allocation and compress BTC dominance [T6]. ETF and ETP flows can also reverse quickly, so BTC’s relative advantage versus Ethereum should be monitored through sustained flow data rather than isolated prints [T7].
Scenario Framework
| Scenario | Conditions | BTC implication |
|---|---|---|
| Base case | Neutral risk sentiment, mixed euro yields, steady but uneven ETF demand, no decisive regulatory shock | BTC remains range-bound to moderately higher. Scarcity and ETF access offset macro friction, but price stays below the €107,662 ATH unless flows persist. |
| Bull case | Persistent ETF inflows, improving liquidity, softer inflation, clearer regulation, and stronger allocation from wealth platforms or treasuries | BTC retests the prior ATH. Required move: €107,662 / €74,458 – 1 = 44.6%. |
| Bear case | Higher yields, renewed ETF outflows, sticky inflation, and weak price response to positive flow data | The +8.12% 30d move proves tactical rather than durable. The -3.43% 7d move extends and BTC remains in a drawdown regime. |
| Stress case | ETF redemptions, corporate treasury de-risking, risk-off macro, and weaker technical structure occur together | Institutional participation amplifies volatility instead of dampening it, consistent with the warning that institutional flows can support rallies and amplify drawdowns [T8]. |
The key debate is whether structural demand can beat discount-rate pressure. Sticky inflation and higher policy rates previously raised the opportunity cost of holding non-yielding assets such as bitcoin [T2]. One source explicitly frames the current setup as a demand-versus-discount-rate test [T3]. Flow risk is material: Farside data cited by one source showed U.S. Bitcoin funds moving from about USD 731 million of net inflows on 3 September 2026 to roughly USD 283 million of outflows on 10 September 2026 [T7]. Regulatory clarity could reduce barriers, but would not guarantee immediate inflows [T6].
Valuation Discussion
Bitcoin valuation should not be reduced to a single target price. The cleanest observed anchor is the current spot price versus the prior ATH. BTC trades at €74,458, 30.84% below its €107,662 ATH. A return to the ATH requires 44.6% upside. The market capitalization is €1.496 trillion, and fully diluted valuation is nearly identical because circulating supply is close to maximum supply.
Third-party USD targets require FX translation. One source cites potential appreciation toward USD 100,000 to USD 150,000, a JPMorgan Chase analysis projecting a USD 150,000 peak target using a flow-based valuation model with 72% confidence and a Q4 2026 timeline, and Ark Invest’s USD 200,000 2026 milestone target and USD 1,000,000 by 2030 projection [T1]. These are third-party scenarios, not altii forecasts.
| USD target reference | Static EUR/USD 1.1218 translation | Upside vs €74,458 | Implied market cap at current circulating supply |
|---|---|---|---|
| USD 100,000 | €89,142 | 19.7% | €1.791 trillion |
| USD 150,000 | €133,714 | 79.6% | €2.687 trillion |
| USD 200,000 | €178,285 | 139.4% | €3.583 trillion |
| USD 1,000,000 | €891,424 | 1,097.2% | €17.915 trillion |
Calculation method: EUR target = USD target / 1.1218. Implied market cap = EUR target x 20,096,890 BTC. The current BTC price in USD is €74,458 x 1.1218 = USD 83,527.
The bullish valuation argument is that durable ETF demand can reprice a scarce asset with limited incremental issuance. The bearish valuation argument is that flow-based targets can fail if ETF flows reverse, macro rates remain restrictive, or on-chain demand does not confirm. ETF flows should be interpreted with spot volume, macro conditions, and on-chain demand, not in isolation [T7].
Risks
- Momentum risk: BTC is up +8.12% over 30 days and +17.91% over 200 days, but still down -24.20% over one year and -30.84% below its ATH.
- Macro risk: Sticky inflation and higher rates can raise the opportunity cost of holding non-yielding assets such as bitcoin [T2].
- Flow reversal risk: ETF flows can reverse quickly, and cited data show a shift from USD 731 million of inflows to USD 283 million of outflows within one week in September 2026 [T7].
- Institutional amplification risk: Institutional participation can support rallies but also amplify volatility through redemptions, hedging, and treasury de-risking [T8].
- Regulatory risk: Regulation remains a wildcard. Clearer rules could support adoption, but they do not guarantee immediate inflows [T6].
- Technical confirmation risk: The setup would weaken if BTC fails to hold current levels, forms a lower high, and sees renewed downside volume even while ETF inflows continue [T3].
- Concentration risk: BTC dominance of 59.68% supports reserve-asset status, but it also means BTC-specific flow shocks can dominate the crypto complex.
- Data limitation risk: The bundle does not include on-chain data, derivatives positioning, realized volatility, exchange balances, options skew, miner data, or official ETF flow datasets.
The main risks are cyclical and flow-related rather than purely technological: discount rates, liquidity, ETF redemptions, regulatory uncertainty, and price failure despite positive adoption narratives.
Appendix
Data provenance
- Bundle generated at: 2026-10-12T04:15:23.846225Z.
- BTC market data retrieved at: 2026-10-12T04:15:06.931607Z.
- News data retrieved at: 2026-10-12T04:15:10.766810Z.
- Market-overview data retrieved between 2026-10-12T04:15:11.674434Z and 2026-10-12T04:15:23.842771Z.
- Quote currency: EUR.
- EUR/USD used for mechanical target conversion: 1.1218.
Key calculations
- Volume-to-market-cap ratio = €15,228,180,590 / €1,496,315,903,244 = 1.0177%, rounded to 1.02%.
- Circulating supply as percentage of max supply = 20,096,890 / 21,000,000 = 95.6995%, rounded to 95.7%.
- Remaining supply to max = 21,000,000 – 20,096,890 = 903,110 BTC.
- Upside to ATH = €107,662 / €74,458 – 1 = 44.595%, rounded to 44.6%.
- ATH drawdown cross-check = €74,458 / €107,662 – 1 = -30.841%, rounded to -30.84%.
- 24h range width = €74,994 – €73,944 = €1,050; range / spot = €1,050 / €74,458 = 1.41%.
- BTC dominance cross-check = €1,496,315,903,244 / €2,502,591,732,982 = 59.68%.
- Total crypto volume-to-market-cap ratio = €50,095,387,946 / €2,502,591,732,982 = 2.00%.
- Euro area 10Y-2Y spread = 3.51918971% – 3.0331429854% = 0.4860 percentage points, or 48.6 bp.
Definitions
- Market capitalization: current price multiplied by circulating supply.
- Fully diluted valuation: current price multiplied by maximum or fully diluted supply.
- BTC dominance: Bitcoin market capitalization divided by total crypto market capitalization.
- Volume-to-market-cap ratio: 24h trading volume divided by market capitalization.
- ATH drawdown: current price divided by all-time high minus one.
- Upside to ATH: all-time high divided by current price minus one.
- Circulating supply percentage of max supply: circulating BTC divided by the 21 million BTC maximum supply.
Limitations
The report separates observed bundle data, derived calculations, and third-party scenarios. Several Tavily sources have no publication date and include blogs, social article content, LinkedIn content, foundation-style commentary, and broker or market commentary. These sources are useful as contextual signals, but they are not primary official ETF datasets. No current gold or Ethereum market data are available in the bundle, so relative positioning versus gold and Ethereum remains qualitative. EUR translations of USD targets are mechanical static-FX conversions, not independent EUR forecasts.
Compliance statement
This report is AI-generated, for informational purposes only, and does not constitute investment advice, a recommendation, an offer, or a solicitation to buy or sell any financial instrument or crypto asset.
Sources
- [T1] Bitcoin Price Prediction 2026: Institutional Adoption & ETF Impact Analysis
- [T2] Grayscale Bitcoin Mini Trust ETF (BTC): Assessing the -3.2% Monthly Move and -22.8% Quarterly Decline
- [T3] Bitcoin’s $3.1B ETF Bid Meets a Harder Macro Test | CryptosRus (@CryptosR_Us) on X
- [T4] Bitcoin ETFs Absorb $134.4M as Macro Backdrop Improves
- [T5] Bitcoin ETF Inflows Surge to $1.92 Billion Last Week
- [T6] Crypto ETFs Enter a New Phase in September: Here’s What Investors Should Watch – Bitcoin Foundation
- [T7] Crypto Bull Run Signals 2026: How to Read ETF, On-Chain & Sentiment Data
- [T8] Bitcoin Outlook: ETF Outflows, Institutional Adoption & Price Forecast 2026 | IG South Africa
Important Note / Wichtiger Hinweis:
EN: This report may have been generated using AI. It processes data from publicly available sources. The content is provided for informational purposes only.DE: Dieser Bericht kann mithilfe von KI erstellt worden sein. Dabei werden Daten aus öffentlich zugänglichen Quellen verarbeitet. Die Inhalte dienen ausschließlich Informationszwecken.
* DE: Die ergänzenden Inhalte können KI-generiert sein. EN: The additional content may be AI-generated.