
The altii-BTC-Report: Bitcoin in EUR
Report timestamp: 21 October 2026, 04:15 UTC. Quote currency: EUR.
Watch the video
This player shows only the Bitcoin chapter of the daily altii market briefing. Watch the full video on tube.altii.de.
Key Data Snapshot
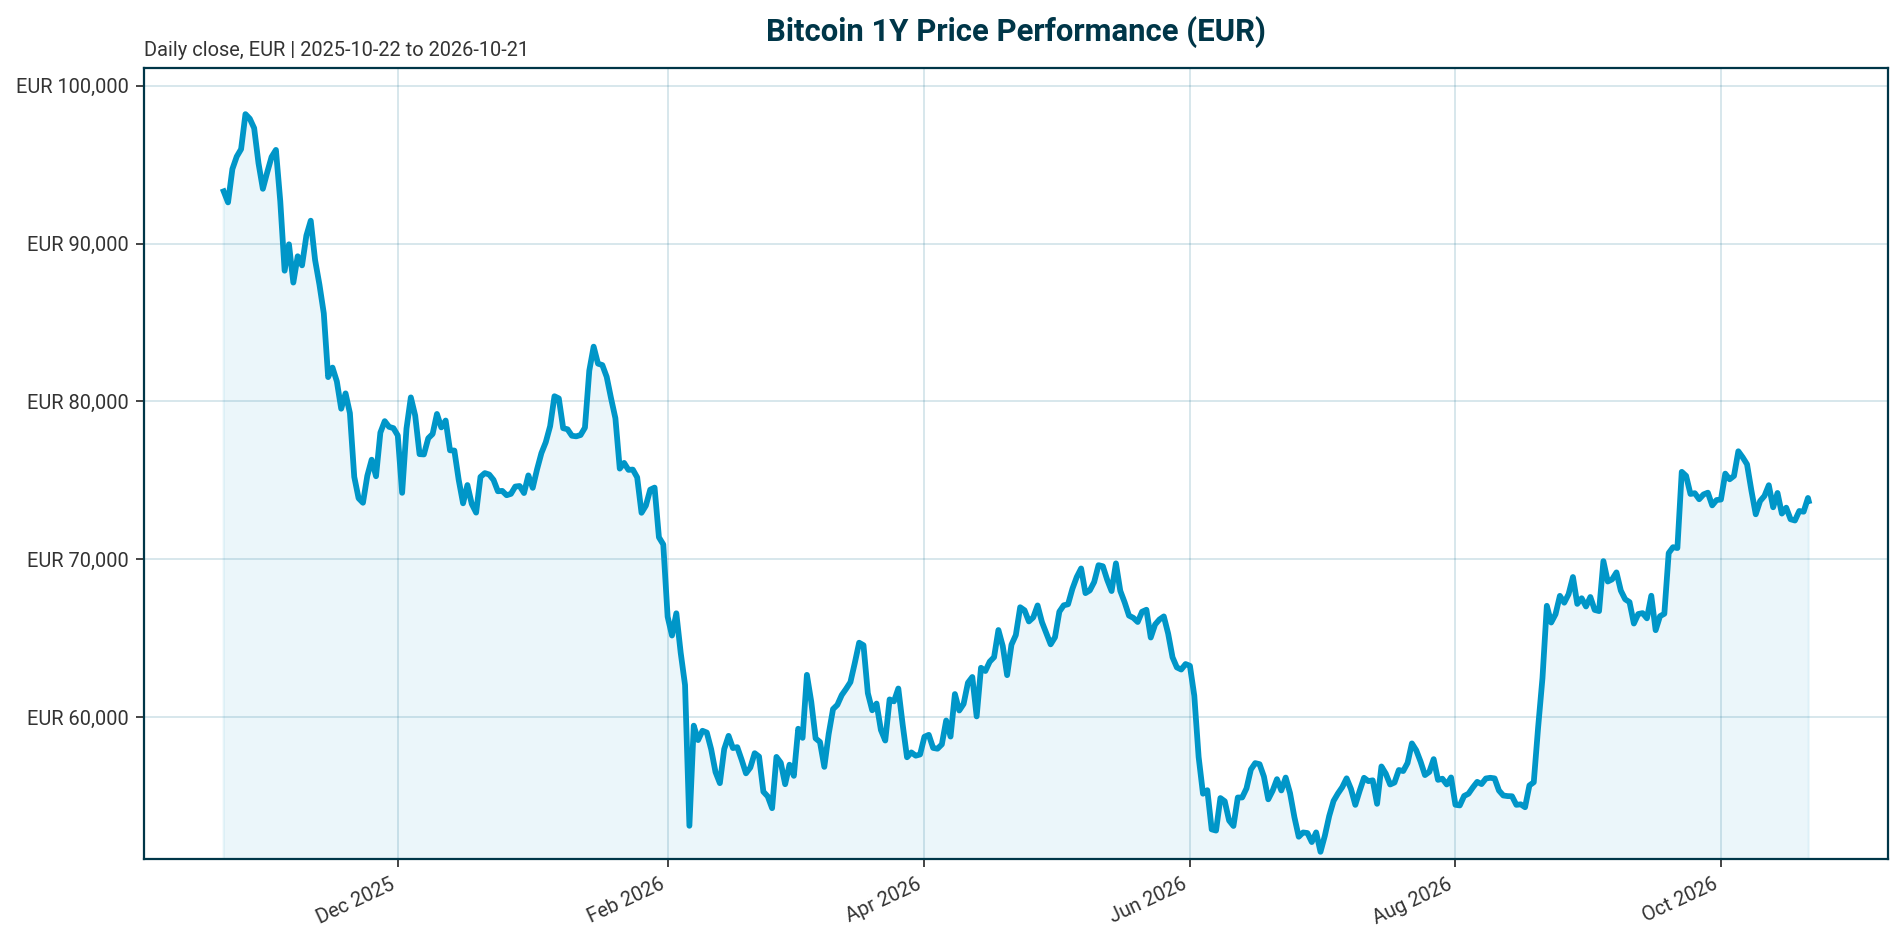
| Metric | Value | Interpretation |
|---|---|---|
| BTC/EUR spot | €73,669 | Reference price for all EUR scenario calculations. |
| Market cap | €1,480.54bn | Rank 1 crypto asset by supplied market-cap rank. |
| 24h volume | €23.88bn | 24h turnover equals 1.61% of market cap: €23.88bn / €1,480.54bn. |
| Performance | 24h +0.82%, 7d -1.10%, 30d +1.68%, 200d +23.80%, 1y -24.53% | Mixed momentum: constructive medium term, weak over one year. |
| 24h range | €72,386 to €74,147 | Range of €1,761 equals 2.39% of spot: (€74,147 – €72,386) / €73,669. |
| All-time high | €107,662 on 6 October 2025 | BTC is 31.57% below ATH. Recapture requires +46.14%: €107,662 / €73,669 – 1. |
| Supply | 20,098,843 BTC circulating; 21,000,000 BTC max | 95.71% of max supply is outstanding. Remaining supply to cap: 901,157 BTC. |
| BTC dominance | 59.52% | Bitcoin represents roughly three-fifths of the supplied total crypto market cap of €2,486.56bn. |
| Share of crypto 24h volume | 33.53% | €23.88bn BTC volume / €71.22bn total crypto volume. |
Bitcoin’s institutional thesis still starts with scarcity. The asset has a 21mn coin cap in the supplied data, and external market commentary also describes Bitcoin as a decentralized, peer-to-peer network with a hard cap of 21mn coins [T4].
Market Setup
The cross-asset backdrop is neutral-to-negative rather than outright risk-on. Equity momentum is moderately negative, DACH indicators are broadly in line with global equities, euro yields are mixed, and FX is mixed. DACH indicators average -1.24% over five days versus -0.71% for global equity indicators. The euro area AAA 10-year yield is 3.47%, down 2.3bp over five days, while the euro area AAA 10-year minus 2-year spread is 41.6bp. EUR/USD is 1.1227, down 0.08% over five days.
For Bitcoin, this means the macro backdrop is not providing a clean tailwind. The current setup is selective and flow-dependent: positive 200-day BTC performance contrasts with negative one-year performance and a 31.57% drawdown from the prior high. Digital-asset commentary continues to frame macro conditions as a primary variable, with limited policy-easing room cited as a constraint on risk-asset recoveries [T1].
The more important point for institutional investors is that Bitcoin has become increasingly flow-led. ETF flows are described as the most tangible leading indicator of institutional capital rotation back into digital assets [T1]. Separate market-structure commentary argues that Bitcoin has entered an ETF- and macro-led regime, where monetary-policy repricing and ETF redemptions can quickly affect price action [T2].
Investment Thesis
Our base thesis is that Bitcoin remains the core institutional crypto allocation, but not a self-contained valuation story. Scarcity sets the long-term framework. Flows, regulation, liquidity, and portfolio adoption set the marginal price.
The constructive case rests on four pillars:
- Scarce supply: 20,098,843 BTC are already circulating, equal to 95.71% of the 21,000,000 BTC cap.
- Benchmark status: BTC has a supplied market-cap rank of 1 and 59.52% crypto-market dominance.
- Institutional access: Spot ETFs, corporate treasuries, and regulated vehicles have made BTC easier to integrate into institutional workflows, including registered investment advisers, private banks, and institutions [T2].
- Regulatory optionality: Market-structure legislation and clearer compliance frameworks could lower barriers to institutional allocation, although they do not guarantee immediate inflows [T1][T8].
The bearish counterpoint is equally important. If ETF redemptions dominate, financing conditions tighten, or regulatory progress stalls, institutionalization can transmit volatility rather than dampen it. Commentary on spot Bitcoin ETFs notes that issuers must acquire physical Bitcoin to back new shares, making ETF demand a structural source of demand, but also highlights that flow reversals can become a major price driver [T5].
Bullish Drivers
The strongest bullish driver is sustained regulated demand. A cited August 2026 report states that Bitcoin ETF inflows surged to $1.92bn in one week, with the scale and concentration of flows interpreted as evidence of a deeper institutional footprint rather than short-term retail activity alone [T4]. The same source notes that BlackRock’s IBIT represented a significant share of inflows and that investors appeared to position ahead of potential upside while broader crypto trading volumes remained relatively low [T4].
Three additional catalysts matter:
- Regulatory clarity: The CLARITY Act is described as a potential federal market-structure framework that could unlock broader institutional participation if passed [T1]. Clearer rules could remove a major compliance barrier for institutions, although they would not automatically create inflows [T8].
- Market maturation: Crypto markets in 2026 are described as increasingly shaped by institutional adoption, ETF growth, regulatory direction, and maturing infrastructure, with Bitcoin at the center of the narrative [T3].
- Liquidity recovery: Some long-term bullish scenarios still reference $100,000 to $150,000 BTC, but only conditional on a meaningful reversal in ETF flows, liquidity, and macro sentiment [T7].
The upside case is therefore conditional, not automatic. BTC can challenge prior highs if ETF demand stays positive, regulation improves institutional approval pathways, and risk liquidity recovers. Without those conditions, scarcity alone may not offset a weak flow regime.
Relative Positioning vs Gold and Ethereum
Versus gold: Bitcoin offers a digital scarcity profile, while gold remains the traditional reserve and real-asset benchmark. However, supplied gold data is unavailable. Gold spot price, market cap, ETF flow data, real-rate sensitivity, volatility, and correlation data are unavailable in the bundle. A full relative valuation versus gold is therefore unavailable.
Versus Ethereum: Bitcoin retains benchmark status through rank 1 market capitalization and 59.52% crypto-market dominance. Ethereum market data is unavailable in the bundle, so relative performance, valuation, and volatility versus ETH are unavailable. The main available relative signal is qualitative: ETF flows and regulatory clarity have become dominant drivers of crypto sentiment across BTC and ETH [T2]. A cited 2025 review states that record outflows from U.S.-listed BTC and ETH ETFs coincided with Bitcoin breaking key support levels, reinforcing how closely large-cap crypto price action has become tied to regulated capital movement [T2].
Ethereum remains relevant as a competing institutional allocation sleeve. A cited September 2026 ETF outlook states that Bitcoin, Ethereum, Solana, and XRP entered September with positive catalysts, and that Ethereum maintained a recent inflow streak while Bitcoin remained dominant without controlling the entire market narrative [T8]. This supports a balanced rotation view: BTC can remain the core crypto benchmark even if incremental capital also moves into ETH and other regulated products.
Scenario Framework
| Scenario | Assumptions | BTC/EUR implication |
|---|---|---|
| Base case | ETF flows mixed, regulation progresses slowly, euro yields remain mixed, risk sentiment stays neutral-to-negative. | Range-bound to modestly constructive. Positive 200d performance of +23.80% is offset by -24.53% over one year. |
| Bull case | ETF inflows persist, liquidity improves, regulatory clarity advances, and institutional adoption broadens. | BTC challenges the prior ATH of €107,662. Required move: +46.14% from €73,669. |
| Bear case | ETF redemptions return, restrictive rates pressure risk assets, and institutional participation amplifies downside volatility. | BTC remains vulnerable despite supply scarcity. The 31.57% drawdown from ATH becomes the key risk reference. |
| High-upside source scenario | Conditional USD scenario from external commentary: $100,000 to $150,000 requires reversal in ETF flows, liquidity, and macro sentiment [T7]. | Using EUR/USD 1.1227, $100,000 equals €89,072 and $150,000 equals €133,608. Implied upside from spot: +20.91% to +81.36%. |
The key asymmetry is not purely technical. Institutional participation can provide durable demand through ETFs, custody platforms, and treasury adoption, but it can also amplify volatility when flows reverse [T5]. Clearer regulation can remove barriers to allocation, but it does not guarantee immediate demand [T8].
Valuation Discussion
Bitcoin does not lend itself to a cash-flow valuation model. The more useful institutional anchors are market capitalization, dominance, supply scarcity, liquidity, and distance to prior cycle highs.
- Market-cap anchor: BTC market cap is €1,480.54bn.
- Dominance anchor: BTC dominance is 59.52%, consistent with €1,480.54bn divided by total crypto market cap of €2,486.56bn.
- Supply anchor: circulating supply is 20,098,843 BTC versus 21,000,000 BTC max supply, leaving 901,157 BTC until the cap.
- ATH anchor: BTC trades at 68.43% of its €107,662 all-time high. Recapture requires a gain of €33,993 per BTC, or +46.14%.
The fully diluted valuation field in the supplied data equals the market cap at €1,480.54bn, while max supply exceeds circulating supply. A simple max-supply calculation using spot price would be €1,547.05bn: €73,669 x 21,000,000 BTC. The difference reflects a data-convention issue, so market cap and observed dominance are cleaner valuation anchors than supplied FDV.
The conditional USD scenario of $100,000 to $150,000 is not an altii price target. It is a source scenario tied to improved ETF flows, liquidity, and macro sentiment [T7]. Converted at EUR/USD 1.1227, it implies €89,072 to €133,608. The lower bound sits 17.25% below the prior EUR ATH of €107,662, while the upper bound sits 24.10% above that ATH.
Risks
- Flow reversal risk: ETF outflows can weaken the marginal demand base. External commentary notes that institutional participation can amplify volatility just as easily as it can support rallies [T5].
- Macro risk: Risk sentiment is neutral-to-negative, equity momentum is moderately negative, and euro yields are mixed. A cited digital-asset review frames the macro backdrop as the primary variable and notes that expected rate holds would leave limited room for easing that historically supported risk-asset recoveries [T1].
- Regulatory delay risk: Legal uncertainty can delay institutional investment even when demand exists, and clearer regulation would not guarantee immediate inflows [T8].
- Institutional financing risk: A cited outlook notes that Strategy, formerly MicroStrategy, had temporarily slowed additional purchases amid weaker financing conditions and falling ETF demand [T5].
- Market-structure risk: A more institutional market may become more sensitive to ETF flows, derivatives positioning, custody channels, and traditional-finance liquidity cycles [T3].
- Technology and operational risk: Monitoring should include technology risk, smart-contract risk, protocol dependencies, and security posture across the digital-asset ecosystem [T3].
- Data limitation risk: On-chain data, exchange reserves, derivatives positioning, funding rates, custody data, realized volatility, and full benchmark data for gold and Ethereum are unavailable in the supplied bundle.
Appendix
Data and calculation notes
- Bundle generated: 2026-10-21T04:15:24.393575Z.
- Market data retrieved: 2026-10-21T04:15:07.419923Z.
- News retrieved: 2026-10-21T04:15:12.188512Z.
- Market overview: no errors reported in the supplied bundle.
- Quote currency: EUR.
- Benchmark assets: gold and Ethereum. Quantitative market data for both benchmarks is unavailable.
- 24h volume-to-market-cap: €23,878,358,598 / €1,480,538,099,837 = 1.61%.
- 24h range as percentage of spot: (€74,147 – €72,386) / €73,669 = 2.39%.
- Circulating supply share of max supply: 20,098,843 / 21,000,000 = 95.71%.
- Remaining supply to max cap: 21,000,000 – 20,098,843 = 901,157 BTC.
- Upside to ATH: €107,662 / €73,669 – 1 = 46.14%.
- USD-to-EUR scenario translation: EUR price = USD price / 1.1227. Therefore $100,000 = €89,072 and $150,000 = €133,608.
Scenario handling
Base, bull, bear, ATH-recapture, and USD-to-EUR translation cases are scenarios, not forecasts. The report distinguishes supplied market data from derived calculations and external source summaries.
Compliance statement
This report is AI-generated, for informational purposes only, and not investment advice. It does not constitute a recommendation to buy, sell, or hold Bitcoin or any other asset.
Sources
- [T1] Q2 2026 Digital Asset Review
- [T2] Crypto Market 2025: Year-End Review & Expert Insights – TradingView News
- [T3] Crypto Analysis for 2026: Bitcoin, ETFs, Regulation
- [T4] Bitcoin ETF Inflows Surge to $1.92 Billion Last Week
- [T5] Bitcoin Outlook: ETF Outflows, Institutional Adoption & Price Forecast 2026 | IG South Africa
- [T7] Bitcoin Price Prediction October 2026
- [T8] Crypto ETFs Enter a New Phase in September: Here’s What Investors Should Watch
Important Note / Wichtiger Hinweis:
EN: This report may have been generated using AI. It processes data from publicly available sources. The content is provided for informational purposes only.DE: Dieser Bericht kann mithilfe von KI erstellt worden sein. Dabei werden Daten aus öffentlich zugänglichen Quellen verarbeitet. Die Inhalte dienen ausschließlich Informationszwecken.
* DE: Die ergänzenden Inhalte können KI-generiert sein. EN: The additional content may be AI-generated.