
The altii-Gold-Report: Gold (XAU) in EUR
Report date: 21 October 2026. Quote currency: EUR. Instrument note: the supplied market data use pax-gold as the Coingecko identifier, so market cap, supply and volume describe a tokenized gold proxy, not the global physical gold market.
Watch the video
This player shows only the Gold chapter of the daily altii market briefing. Watch the full video on tube.altii.de.
Key Data Snapshot
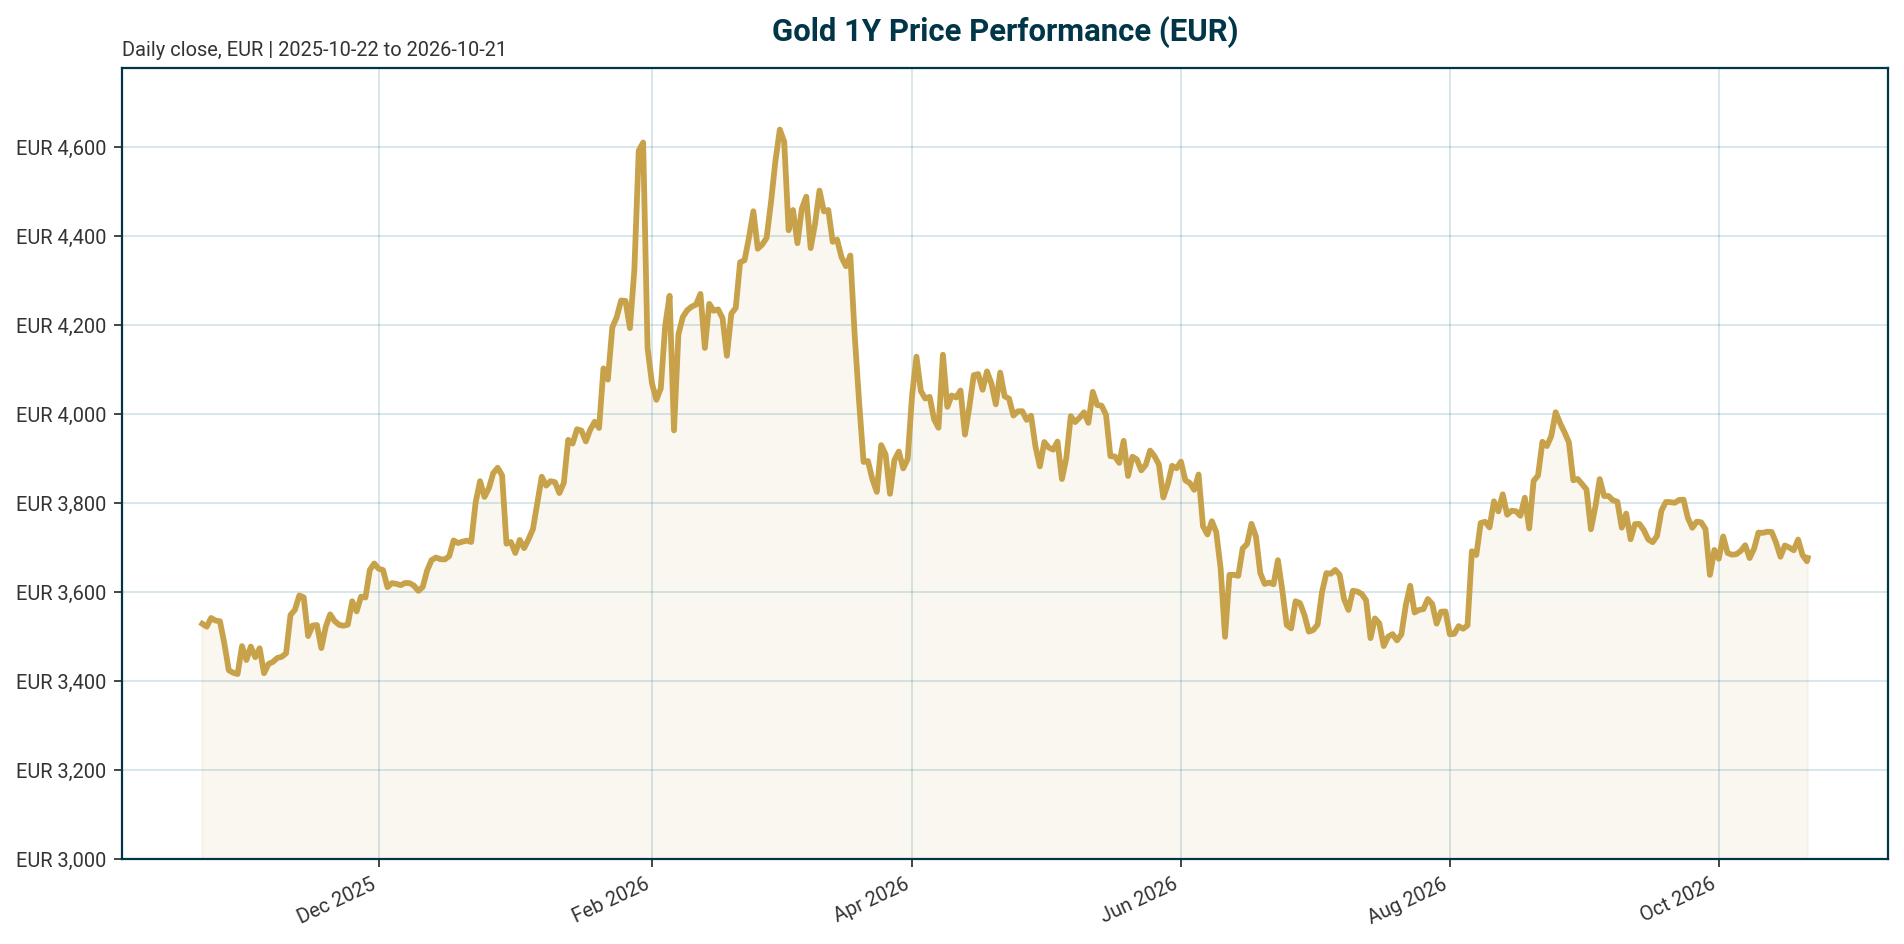
| Metric | Value | Institutional read-through |
|---|---|---|
| Gold proxy price | €3,676.01 | Current EUR-denominated XAU exposure level. |
| 24h / 7d / 30d return | -0.3623% / -1.0479% / -5.3843% | Short-term tape remains corrective. |
| 200d / 1y return | -11.4172% / -5.2132% | Medium-term consolidation after earlier cycle strength. |
| 24h range | Low €3,662.74, high €3,697.81 | Current price is €13.27 above the low and €21.80 below the high. |
| Distance to 24h high | €21.80, or 0.593% | Calculation: (€3,697.81 – €3,676.01) / €3,676.01. |
| Distance above 24h low | €13.27, or 0.361% | Calculation: (€3,676.01 – €3,662.74) / €3,676.01. |
| All-time high | €4,688.32 on 28 Jan 2026 | Current drawdown: €3,676.01 / €4,688.32 – 1 = -21.59%. |
| All-time low | €1,265.28 on 17 Nov 2019 | Current gain: €3,676.01 / €1,265.28 – 1 = +190.53%. |
| Proxy market cap / 24h volume | €1.624bn / €109.504mn | Token-proxy turnover: €109.504mn / €1.624bn = 6.74%. |
| Global physical gold market cap | Unavailable | Not provided in the bundle. |
| EUR/USD | 1.1227 | 5d move -0.0801%, 1m move -2.2124%. |
| Implied USD gold proxy | $4,127.06 | Mechanical conversion: €3,676.01 x 1.1227. |
| Euro Area AAA 10Y yield | 3.4691% | 5d change -2.2695 bp. Elevated level remains an opportunity-cost headwind. |
| Euro Area AAA 10Y-2Y spread | 41.58 bp | Calculation: 3.4691% – 3.0533% = 0.4158 percentage points. |
Macro Backdrop
The cross-asset backdrop is mixed and only moderately supportive for gold. The market overview reports neutral-to-negative risk sentiment, mixed euro yields and a mixed FX backdrop. The Euro Area AAA 10Y yield stands at 3.47%, down 2.3 bp over five days, while EUR/USD is 1.1227, down 0.08% over five days. Equity momentum is moderately negative: DACH indicators averaged -1.24% over five days versus -0.71% for global equity indicators. This setting supports hedging demand, but it does not yet signal a decisive macro stress regime.
For gold, the key macro variable remains the real-yield path. Higher real yields increase the opportunity cost of holding a non-yielding asset. Lower real yields, weaker growth and a weaker dollar would improve gold’s risk-adjusted appeal. The World Gold Council frames consensus macro assumptions as stable global GDP growth of 2.7% to 2.8%, roughly 75 bp of additional Fed cuts, a 40 bp to 60 bp fall in core CPI/PCE, a slightly higher US dollar and broadly flat yields, a mix that points to rangebound gold rather than a clean breakout [T3].
The inflation backdrop is not one-sided. The RBA expects headline inflation in many economies to remain above central-bank targets into 2027, with upside risks linked to capacity pressures and fuel or conflict-related costs [T1]. That is bullish for gold as an inflation hedge. But if central banks respond to sticky inflation with tighter policy, the same inflation impulse can become bearish through higher real yields. In Europe, Deloitte notes that euro-area headline inflation was expected to average 2.1% in 2025 and that ECB rate cuts brought the deposit facility rate to 2% in June, making policy significantly less restrictive [T8]. For EUR investors, this matters through both rates and currency translation.
Investment Thesis
Base case: gold in EUR remains a strategic hedge, but tactical upside is constrained until real yields fall, the dollar weakens or risk aversion rises. The price is down 5.3843% over 30 days and 11.4172% over 200 days, which argues against chasing momentum but supports a disciplined rebalancing discussion.
Bullish thesis: gold retains institutional value as reserve collateral, inflation protection and policy-error insurance. The World Gold Council attributes the prior rally to a supercharged geopolitical and geoeconomic environment, generalized US dollar weakness and marginally lower rates [T3]. It also notes that portfolio diversification demand increased amid lacklustre bond returns and concerns about equity-market froth [T3]. Central-bank demand remains a structural anchor: CNBC cites the World Gold Council survey showing that almost 90% of respondents expected global central-bank gold reserves to increase over the next year [T2].
Bearish thesis: gold is still vulnerable to higher-for-longer policy rates, stronger real yields and fading safe-haven demand. CNBC notes that gold came under pressure after a break below $4,000 as price action reconnected with real yields, while a more hawkish Fed, higher interest rates and a stronger USD weighed on the metal [T2]. The current 21.59% drawdown from the January 2026 high shows that structural demand does not eliminate cyclical downside.
Net view: for EUR-based institutional portfolios, gold looks more like a strategic hedge to accumulate selectively on weakness than a high-conviction near-term momentum trade. The case improves if growth slows and real yields fall. It weakens if inflation remains sticky and central banks tighten further.
Bullish Drivers
- Real-yield compression: the World Gold Council states that weaker growth could push the Fed to cut beyond current expectations, while lower rates, a weaker dollar and higher risk aversion would be moderately bullish for gold [T3].
- Scenario upside: under the World Gold Council slowdown scenario, gold could rise 5% to 15% from current levels [T3]. Applied to €3,676.01, this implies €3,859.81 to €4,227.41. Calculation: €3,676.01 x 1.05 and €3,676.01 x 1.15.
- Central-bank reserve demand: almost 90% of respondents in the World Gold Council central-bank survey expected global central-bank gold reserves to rise over the next year [T2].
- Reserve-system diversification: the freezing of approximately $300bn of Russian central-bank assets exposed the vulnerability of holding reserves in foreign fiat systems and encouraged some emerging-market central banks, including China and India, to accumulate gold domestically [T4].
- Policy-credibility risk: Crux Investor argues that Fed credibility concerns, real-rate volatility, tariff-driven inflation and persistent fiscal deficits reinforce gold’s role as a hedge against policy error and monetary debasement [T5].
- Institutional demand: Crux Investor cites central-bank purchases above 1,000 tonnes annually since 2022 and multi-year-high ETF inflows as support for a more durable price floor [T5].
- Inflation insurance: the RBA’s expectation that inflation in many economies remains above target into 2027 supports the case for maintaining inflation-hedge exposure [T1].
Relative Positioning vs Bitcoin and Ethereum
The bundle reports BTC dominance at 59.5132%, total crypto market capitalization at €2.4838tn and total crypto 24h volume at €71.1316bn. The tokenized gold proxy market cap of €1.624bn equals approximately 0.0654% of reported total crypto market capitalization. Calculation: €1.624bn / €2,483.820bn.
Direct BTC price, BTC returns, ETH price and ETH returns are unavailable in the bundle. Therefore, this report cannot quantify recent gold performance versus Bitcoin or Ethereum. It can only frame relative roles.
Gold: lower-beta macro hedge, reserve asset, inflation hedge and policy-credibility insurance. Crux Investor notes that gold’s governance-risk premium can show up as resilience during periods of dollar strength and rising nominal yields, suggesting investors may view it as insurance against institutional degradation [T5].
Bitcoin and Ethereum: higher-beta digital-asset exposures whose performance is more sensitive to liquidity, risk appetite, adoption cycles and crypto-specific flows. In a pro-risk liquidity expansion, BTC and ETH may outperform gold. In a policy-credibility shock, geopolitical stress event or reserve-diversification regime, gold’s institutional role is clearer.
Portfolio implication: gold should not be treated as a substitute for Bitcoin or Ethereum. It is better viewed as macro collateral and crisis insurance. Crypto exposure requires separate volatility, drawdown, custody and regulatory analysis.
Scenario Framework
| Scenario | Macro conditions | EUR gold implication | Key variables to monitor |
|---|---|---|---|
| Base case: rangebound consolidation | Growth near trend, yields broadly flat, USD slightly firmer. | Gold holds strategic value but lacks a clear upside catalyst. Current price: €3,676.01. | Euro yields, Fed guidance, EUR/USD, ETF flows. |
| Bull case: growth slowdown | Weaker growth, lower real yields, more Fed easing, weaker USD, higher risk aversion. | 5% to 15% upside framework: €3,859.81 to €4,227.41, based on WGC scenario logic [T3]. | US labour data, real yields, dollar trend, recession risk. |
| Bear case: real-yield shock | Sticky inflation forces tighter policy, real yields rise, USD strengthens. | Further downside risk despite structural demand. CNBC notes hawkish policy, higher rates and a stronger USD weighed on gold [T2]. | Inflation surprises, central-bank rhetoric, TIPS yields, DXY. |
| Stagflation / policy-error case | Inflation remains above target, growth weakens, policy credibility deteriorates. | Mixed but potentially positive: higher nominal yields hurt, but policy-error hedging supports gold. | Breakevens, real yields, fiscal stress, central-bank credibility. |
| EUR translation case | USD gold unchanged, EUR/USD moves. | EUR weakness lifts EUR gold mechanically. EUR strength dilutes EUR returns. | EUR/USD, ECB-Fed rate differential, European growth data. |
The rate path remains decisive. NAGA notes that higher policy rates pushed US Treasury yields to multi-decade highs and the 10-year real yield to 2.95%, up from 2.44% at the start of September, raising the opportunity cost of holding non-yielding gold [T6]. It also notes Goldman Sachs argued that rate hikes delay rather than end the gold rally [T6]. That distinction is important: tactical pressure does not necessarily invalidate the long-term reserve-asset thesis.
Valuation Discussion
Gold has no cash flow, so a discounted-cash-flow model is not appropriate. Valuation should be assessed through real yields, currency regime, reserve demand, risk hedging demand and distance from historical price extremes.
- Real-yield channel: higher real yields reduce gold’s relative appeal. CNBC reports that gold price action reconnected with real yields after the break below $4,000 [T2]. NAGA similarly notes that a 10-year real yield of 2.95% raised the opportunity cost of gold [T6].
- Historical stress point: NAGA states that the 2022 Fed tightening cycle of 525 bp in 16 months pushed gold back to about $1,615/oz as real yields spiked [T6]. This illustrates how severe policy tightening can override bullish structural narratives.
- Consensus valuation state: the World Gold Council’s consensus macro inputs point to rangebound gold performance, not an obvious valuation dislocation [T3].
- Cycle positioning: current EUR gold is 21.59% below its €4,688.32 all-time high but 190.53% above its €1,265.28 all-time low. That argues for neither “cheap” nor “expensive” in isolation.
- FX conversion: implied USD gold proxy price equals €3,676.01 x 1.1227 = $4,127.06. This is a mechanical conversion, not an independent USD spot quote.
| FX sensitivity assumption | If USD gold is unchanged | EUR gold effect |
|---|---|---|
| EUR/USD rises 5% | USD price unchanged | EUR gold falls by roughly 4.76%, because EUR price = USD price / EUR/USD. |
| EUR/USD unchanged | USD price unchanged | EUR gold unchanged. |
| EUR/USD falls 5% | USD price unchanged | EUR gold rises by roughly 5.26%. |
Conceptually, EUR gold return equals USD gold return plus the EUR/USD translation effect. If the euro weakens, EUR investors can gain even when USD gold is flat. If the euro strengthens, EUR investors can underperform the USD gold move.
Risks
- Higher real yields: the largest downside risk is a further rise in real yields. NAGA links higher policy rates and higher real yields directly to a higher opportunity cost for gold [T6].
- Hawkish central banks: CNBC reports that a more hawkish Fed, higher interest rates and a stronger USD weighed on gold as safe-haven appeal faded [T2].
- Stronger USD: USD strength can pressure USD gold. EUR investors may be partly cushioned if EUR/USD falls, but that is not guaranteed.
- Risk-on rotation: CNBC notes that investors had been taking profit and pivoting toward equities [T2]. If macro stress fades, gold allocation demand can weaken.
- Target downgrades and sentiment risk: CNBC notes that several Wall Street analysts had reduced gold target prices in recent weeks [T2].
- Drawdown risk: gold is already down 5.3843% over 30 days and 11.4172% over 200 days in EUR terms. Momentum remains negative.
- Event-risk reversal: geopolitical risk can support gold, but de-escalation can remove a safe-haven premium quickly.
- Proxy-data risk: market cap, supply and volume refer to the PAX Gold proxy, not total physical gold. Overstating these metrics would be misleading.
- Relative-analysis limitation: BTC and ETH spot prices, returns, volatility and drawdowns are unavailable in the bundle.
Appendix
Data and calculation notes
- Generated at: 2026-10-21T04:21:52.205599Z.
- Market data retrieved at: 2026-10-21T04:21:41.759880Z.
- Quote currency: EUR.
- Coingecko ID: pax-gold.
- Benchmark assets listed in bundle: gold and ethereum.
- Market overview errors: none reported.
- ATH drawdown: €3,676.01 / €4,688.32 – 1 = -21.59%.
- ATL gain: €3,676.01 / €1,265.28 – 1 = +190.53%.
- Implied USD gold proxy: €3,676.01 x 1.1227 = $4,127.06.
- WGC-style upside range: +5% = €3,859.81; +15% = €4,227.41.
- Euro Area AAA 10Y-2Y spread: 3.4691% – 3.0533% = 41.58 bp.
- Euro Area AAA 30Y-10Y spread: 3.7347% – 3.4691% = 26.57 bp.
- Proxy turnover: €109.504mn / €1.624bn = 6.74%.
- Proxy market cap as share of reported crypto market cap: €1.624bn / €2,483.820bn = 0.0654%.
Data limitations
US dollar index data, US nominal Treasury series, US TIPS real-yield series, breakeven inflation data, gold ETF flows, futures positioning, physical gold supply-demand data and direct BTC/ETH price-return series are unavailable in the supplied bundle. Scenario outputs are conditional frameworks, not point forecasts.
Compliance statement
This report is AI-generated, for informational purposes only, and does not constitute investment advice, a recommendation, an offer or a solicitation to buy or sell any financial instrument. Investors should conduct independent due diligence and consider their own objectives, constraints and risk tolerance.
Sources
- [T1] Outlook | Statement on Monetary Policy – August 2026 | RBA
- [T2] Gold at $4,000, silver below $60 – is precious metal rally over?
- [T3] Gold Outlook 2026: Push ahead or pull back | World Gold Council
- [T4] How Gold Imports Influence India’s Current Account Deficit (CAD) and Rupee
- [T5] Political Risk to Fed Independence Triggers Gold Repricing: Institutional Demand Anchors the Rally – Article | Crux Investor
- [T6] Gold Price Forecast Q4 2026: Will Gold Rate Decrease Below $4,000?
- [T8] Global economic outlook 2026
Important Note / Wichtiger Hinweis:
EN: This report may have been generated using AI. It processes data from publicly available sources. The content is provided for informational purposes only.DE: Dieser Bericht kann mithilfe von KI erstellt worden sein. Dabei werden Daten aus öffentlich zugänglichen Quellen verarbeitet. Die Inhalte dienen ausschließlich Informationszwecken.
* DE: Die ergänzenden Inhalte können KI-generiert sein. EN: The additional content may be AI-generated.