
Watch the video
This player shows only the Bitcoin chapter of the daily altii market briefing. Watch the full video on tube.altii.de.
Key Data Snapshot
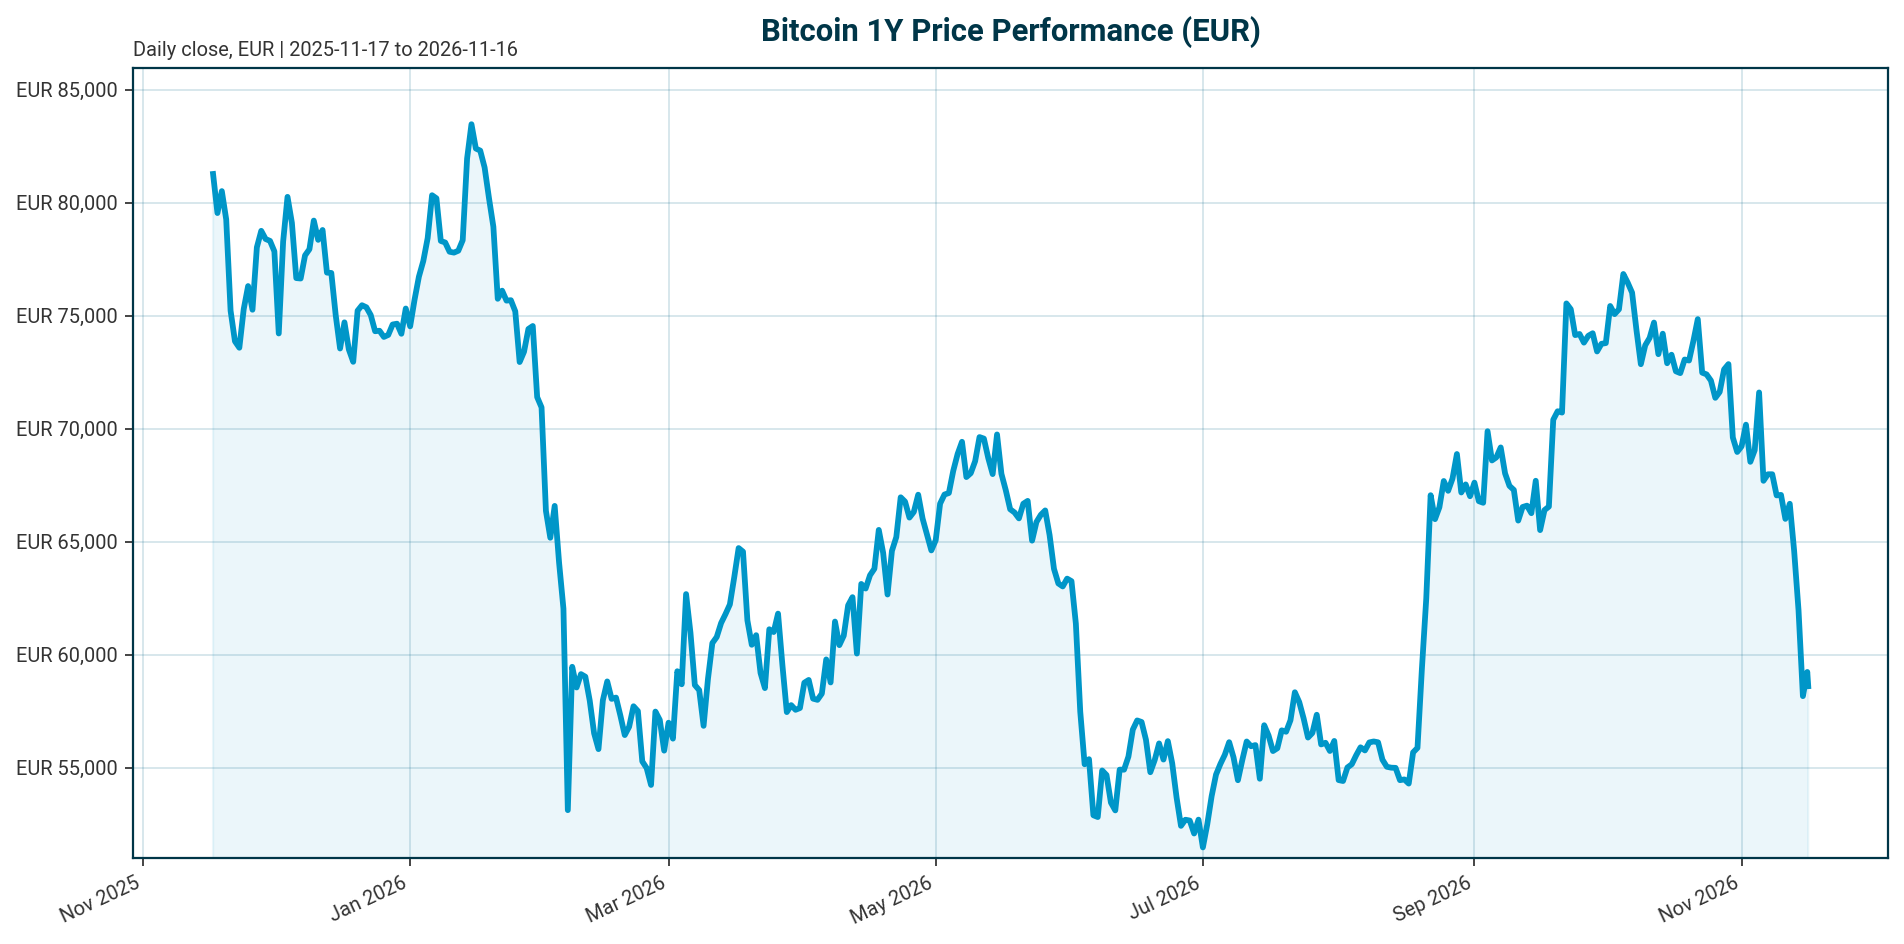
Bitcoin (BTC) trades at EUR 58,652 as of 16 November 2026, extending a deep multi-week drawdown. The table below anchors the quantitative picture.
| Metric | Value | Comment |
|---|---|---|
| Price (EUR) | 58,652 | 24h range EUR 57,875 to 59,874 |
| 24h change | -0.32% | 1h -0.46% |
| 7d / 14d / 30d | -13.39% / -17.55% / -20.51% | Accelerating drawdown across horizons |
| 200d / 1y | -14.67% / -32.33% | Full bear-phase regime, not a pullback |
| Market cap | EUR 1,179.56 billion | Rank 1; FDV EUR 1,179.56 billion |
| 24h volume | EUR 28.91 billion | Turnover ratio ~2.45% of market cap |
| BTC dominance | 59.36% | Total crypto market cap EUR 1,984.17 billion |
| Supply | 20,112,631 of 21,000,000 | 95.78% of max supply issued |
| All-time high | EUR 107,662 (6 Oct 2025) | Currently -45.52% below ATH |
Turnover calculation: 28,905,005,734 / 1,179,560,672,641 = 2.45%. Dominance cross-check: 1,179.56bn / 1,984.17bn = 59.44%, versus the reported 59.36%; the small gap reflects rounding and timing differences in the data feed.
Market Setup
The cross-asset backdrop is neutral in risk sentiment with moderately negative equity momentum globally. DACH indicators average +1.62% over five days versus -1.04% for global equity peers; the DAX posts the strongest five-day move at +1.84% and leads on a one-month basis at +5.74%, while the Hang Seng is the weakest at -2.89%. The S&P 500 is down 2.04% and the Nasdaq Composite down 5.83% over one month, so BTC’s -20.51% 30-day move represents amplified beta against an already soft global tape. Rates are a headwind: the euro area AAA 10Y yield sits at 3.37% (+8.2 bp over five days) with a 10Y-2Y spread of 29.2 bp, a flattening curve that keeps cash and bonds competitive with speculative assets. FX is mixed, with EUR/USD at 1.1071 (-0.30% over five days, -5.78% YTD). Policy is restrictive: the Fed funds target range stands at 3.75% to 4.00% after a 25 bp hike effective 17 September 2026, and the ECB deposit facility rate is 2.50% after a 25 bp hike effective 16 September 2026. Against this backdrop, BTC’s drawdown is consistent with a liquidity-constrained regime in which higher yields compete for capital [T3]. If inflation data softens and markets begin pricing easing from the current 3.75% to 4.00% Fed range, the historical pattern of easing supporting risk-asset recoveries [T1] could reverse the drawdown; that is a scenario assumption, not a current expectation.
Investment Thesis
Bitcoin has matured into an ETF- and macro-driven institutional asset. Price is now governed by regulated capital flows, policy liquidity and regulatory clarity rather than retail speculation. The current drawdown tests whether structural adoption outweighs cyclical outflows.
The evidence chain is clear. ETF flows became Bitcoin’s new macro indicator, with record Q4 2025 outflows coinciding with the breakdown of USD 98,000 support [T2]. Q2 2026 then delivered USD 4.67 billion in net spot Bitcoin ETF redemptions, the largest quarterly outflow since spot products launched in January 2024, with June alone a record month for redemptions; the pattern was read as profit-taking and rotation into traditional markets rather than a structural exit [T1]. The recovery attempt came in August 2026: a USD 517.2 million single-day BTC ETF inflow, the strongest in roughly three and a half months, led by BlackRock’s IBIT at USD 284.7 million, alongside a near-20% weekly price rebound from the low-USD 60,000s toward USD 80,000 [T5] [T6]. Cumulative 2026 BTC ETF flows were restored to positive after early withdrawals [T7], and JPMorgan raised its Strategy stake by 36% with Bitcoin ETF bets at USD 540 million [T8].
Structurally, volatility has roughly halved from 84% to 43% per the Glassnode x Fasanara report, supporting the institutionalization thesis even as price action remains macro-sensitive [T2]. The base case is a flow-dependent, range-bound market with ETF net flows as the leading indicator. The bull case requires sustained positive flows plus regulatory passage; one commentator sees a path toward USD 200,000 over a full cycle if macro conditions cooperate, a single strategist’s view rather than a consensus forecast [T2]. The bear case is a repeat of the Q2 2026 outflow pattern under restrictive policy, extending the -45.52% drawdown from ATH.
Bullish Drivers
- Regulatory clarity. The CLARITY Act would establish a federal market-structure framework and potentially unlock broader institutional participation [T1]. Progress on the Act could strengthen the institutional ETF outlook into late 2026 [T4].
- ETF flow recovery. The 19 August 2026 session drew USD 517.2 million into US spot Bitcoin ETFs, with broadening flows into ETH, SOL and XRP signaling widening risk appetite [T5] [T6].
- Institutional balance-sheet adoption. JPMorgan raised its Strategy stake 36% with Bitcoin ETF bets at USD 540 million, reinforcing confidence in regulated vehicles [T8].
- Structural adoption in Asia. Hong Kong’s Stablecoins Ordinance requires full reserve backing and redemption rights; tokenization and stablecoins act as entry points for banks and asset managers [T1].
- Attractive entry conditions. Lower prices, deep liquidity and mature infrastructure across ETFs, futures, custody and regulated venues are drawing institutions back [T7].
- Volatility compression. The decline from 84% to 43% volatility makes BTC more allocatable for institutional mandates [T2].
If CLARITY-style legislation passes and weekly ETF net flows turn sustainably positive, the institutional rotation flagged as the key signal in the Q2 review [T1] would be confirmed. These are conditional drivers, not guarantees.
Relative Positioning vs Gold and Ethereum
Current gold and ETH prices are not in the dataset, so cross-asset valuation ratios such as BTC/gold cannot be computed here; positioning must be framed through flows and narrative.
Versus Ethereum: Bitcoin remains the primary institutional asset while Ethereum builds its own ETF base at smaller scale. In Q2 2026, ETH ETFs saw USD 690 million in net outflows versus BTC’s USD 4.67 billion [T1], and during the August recovery ETH attracted only USD 17.7 million against BTC’s USD 517.2 million on the leading session [T5]. In a flow-led recovery, BTC captures the majority of regulated inflows first. In a broadening risk-appetite regime, altcoin flows (SOL, XRP) can grow faster in percentage terms [T6]. With 59.36% dominance and a EUR 1.18 trillion market cap, Bitcoin’s scarcity premium within the asset class is intact.
Versus gold: the debasement-trade narrative revived during the August 2026 rebound [T6], the framework in which BTC competes most directly with gold. Both assets benefit if fiscal and monetary concerns strengthen that trade, but BTC’s 43% volatility [T2] remains far above gold’s, a key caveat for conservative allocators. BTC’s higher beta implies larger drawdowns, currently -45.52% from ATH, alongside larger recovery potential.
Scenario Framework
Three variables drive the framework: ETF flow persistence, the CLARITY Act outcome, and central bank policy from the current hiked stance. USD-quoted reference levels are converted at EUR/USD 1.1071 (16 November 2026) for context; USD 60,000 to 80,000 maps to roughly EUR 54,200 to 72,300.
- Bull scenario. CLARITY-style legislation passes, ETF net flows turn sustainably positive, and markets price easing from the current 3.75% to 4.00% Fed range. BTC recovers meaningfully toward prior support zones; the commentator’s USD 200,000 full-cycle scenario [T2] sits at the aggressive end and is not a base-case forecast.
- Base scenario. Policy holds at current levels, ETF flows oscillate around flat as in late-September 2026 weeks [T3], and BTC consolidates in the EUR mid-50,000s to low-60,000s while structural adoption builds underneath.
- Bear scenario. Renewed record outflows, further CLARITY Act setbacks and restrictive policy extend the drawdown. A repeat of the Q2 2026 pattern (USD 4.67 billion quarterly redemptions [T1]) implies a retest of cycle lows; the September setback already saw BTC fall below USD 76,000 (about EUR 68,600 at the disclosed rate) with USD 450 million in daily outflows [T7].
Macro sensitivity cuts both ways: higher yields compete with speculative assets for capital, while softer conditions support institutional demand [T3]. The expectation under Fed Chair Kevin Warsh to hold rates through Q3 was stated in July 2026 [T1] and predates the September hike; it should be read as a dated expectation, not the current market view.
Valuation Discussion
Bitcoin has no cash flows, so valuation rests on scarcity, adoption and drawdown-relative framing. On scarcity: 20,112,631 of 21,000,000 coins are issued (95.78%), and the fully diluted valuation of EUR 1,179.56 billion is essentially equal to market cap, so dilution is negligible. On drawdown-relative positioning: the price is 45.52% below the October 2025 ATH of EUR 107,662 and 32.33% below its level of one year ago. If institutional adoption is structural rather than cyclical, as the Q2 2026 review concludes [T1], drawdowns beyond -40% from ATH have historically represented accumulation zones; this is a pattern observation, not a guarantee.
Valuation risk is equally explicit. If ETF flows prove cyclical and the institutional regime reverses, the 43% volatility regime [T2] implies EUR five-figure weekly swings remain possible, undermining static anchors. Data gaps constrain the analysis: no on-chain valuation metrics (MVRV, realized price, NUPL) are present in the dataset, and no gold or ETH prices are available, so cross-asset valuation ratios cannot be computed from the bundle. Any valuation view here is therefore market-structure based, not model based.
Risks
- Policy risk. The Fed funds target sits at 3.75% to 4.00% after a 25 bp hike effective 17 September 2026, and the ECB deposit rate at 2.50% after a 25 bp hike effective 16 September 2026. Higher yields compete with speculative assets for capital [T3].
- Flow-reversal risk. Q2 2026’s USD 4.67 billion in redemptions shows how fast institutional rotation can run [T1]; 16 September 2026 saw USD 296 million in single-day BTC ETF outflows [T3].
- Regulatory risk. The CLARITY Act setback drove BTC below USD 76,000 with USD 450 million in outflows, and regulatory uncertainty remains a major institutional barrier [T7].
- Volatility risk. Sharp swings trigger redemptions from crypto products and deter risk-managed allocations [T7].
- Structural and index risk. Potential MSCI treatment changes for Strategy could force passive-flow adjustments independent of BTC’s own price [T8].
- Divergence risk. ETF flows and price do not always move together; divergences can hide underlying weakness [T3].
Compounding risk: a second quarterly outflow record combined with another legislative setback would mirror the Q2-to-September 2026 sequence and likely extend the -45.52% drawdown. Containment: the reading of outflows as rotation rather than structural exit [T1] suggests flow-driven drawdowns have historically been contained once macro conditions stabilize.
Appendix
Methodology and timestamps. Market data retrieved 2026-11-16T05:15 UTC. Equity and rates data are as of 2026-11-12/13; FX data as of 2026-11-16. Policy rates come from the authoritative bundle block: the Fed funds target from FRED (as of 2026-11-15) and the ECB deposit facility rate from the ECB key rate (as of 2026-11-16).
Source dating caveats. T1 is a July 2026 Q2 review; T2 is a 2025 year-end review; T5 and T6 are August 2026; T3 and T4 are September 2026; T7 and T8 lack publication dates in the source list and carry lower recency confidence. USD-denominated flow figures are quoted as reported; converting them to EUR at the current EUR/USD 1.1071 introduces FX distortion, which is why conversions are labeled as indicative.
Data gaps. No current gold or ETH prices in the bundle; no on-chain valuation metrics; no live ETF flow data beyond the sourced articles; the ECB policy rate is stated, but no other central bank rates are in the dataset.
Sources
- [T1] Q2 2026 Digital Asset Review, CoinDesk Indices: link
- [T2] Crypto Market 2025: Year-End Review & Expert Insights, TradingView News: link
- [T3] Bitcoin ETFs Just Had Their Worst Day Since June: What Happened?, Bitcoin Foundation: link
- [T4] Crypto ETFs Enter a New Phase in September: Here’s What Investors Should Watch, Bitcoin Foundation: link
- [T5] Bitcoin ETF Inflows Hit $517M As Institutional Demand Returns, TradingView News: link
- [T6] Bitcoin Leads Broader Rebound, ETFdb: link
- [T7] Crypto Funds See $3.55B Inflows: Bitcoin Leads as Ethereum and Solana Surge, Bitcoin Foundation: link
- [T8] Strategy Stake Held by JPMorgan Jumps 36% as Bitcoin ETF Bets Hit $540M, Cryptonews: link
Disclaimer. This report is AI-generated, for informational purposes only, and does not constitute investment advice. Figures are drawn from the cited data bundle and sources as of the stated timestamps; readers should verify current market conditions before making any investment decision.
Important Note / Wichtiger Hinweis:
EN: This report may have been generated using AI. It processes data from publicly available sources. The content is provided for informational purposes only.DE: Dieser Bericht kann mithilfe von KI erstellt worden sein. Dabei werden Daten aus öffentlich zugänglichen Quellen verarbeitet. Die Inhalte dienen ausschließlich Informationszwecken.
* DE: Die ergänzenden Inhalte können KI-generiert sein. EN: The additional content may be AI-generated.