
Watch the video
This player shows only the Gold chapter of the daily altii market briefing. Watch the full video on tube.altii.de.
Key Data Snapshot
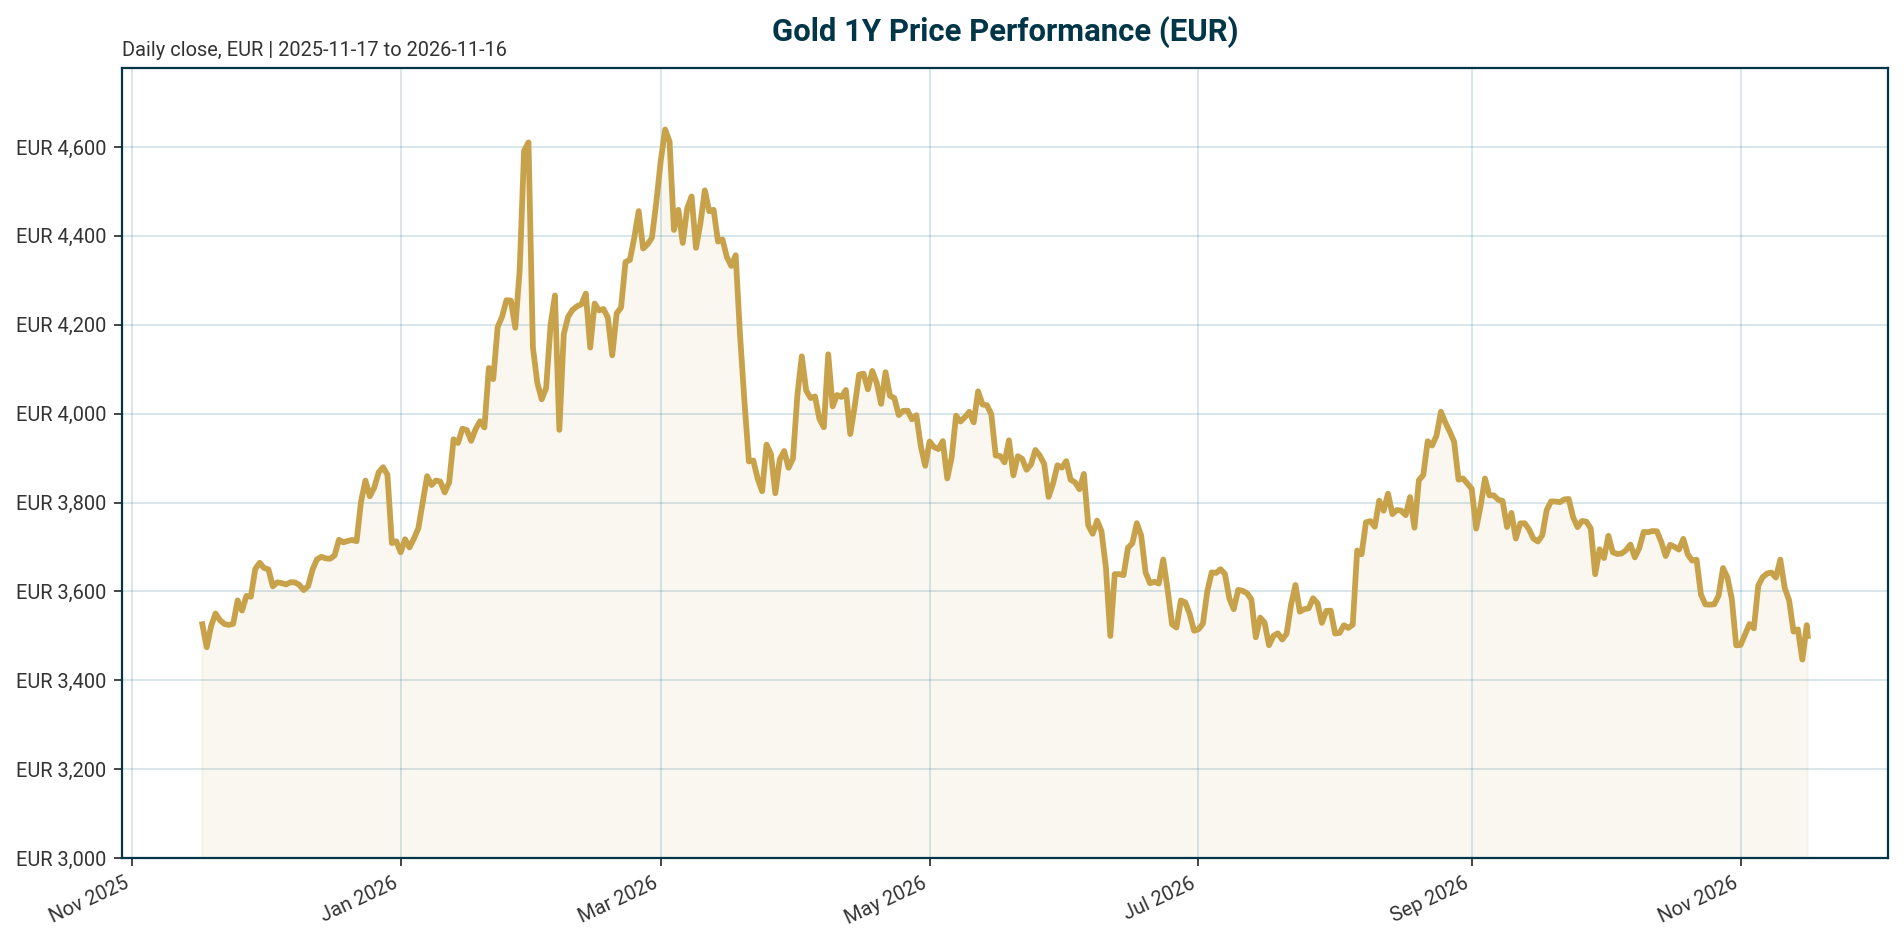
Gold (XAU), quoted in euro, trades at EUR 3,500.20 as of 2026-11-16 05:19 UTC (PAX Gold proxy, quote currency EUR). The 24-hour range spans EUR 3,458.42 to EUR 3,525.97, an intraday spread of roughly 1.91% ((3,458.42 / 3,525.97) – 1 = -1.91%), and the 24-hour change is +1.04%. That bounce sits against a clearly negative weekly trend, so the intraday gain should not be read as a trend reversal.
| Metric | Value | Note |
|---|---|---|
| Price (XAU/EUR) | EUR 3,500.20 | 24h range 3,458.42 to 3,525.97 |
| Change 24h / 7d / 14d | +1.04% / -6.06% / -1.44% | Intraday bounce vs weekly downtrend |
| Change 30d / 200d / 1y | -7.37% / -15.29% / -5.95% | Sustained medium-term drawdown |
| All-time high | EUR 4,688.32 (2026-01-28) | Current price -25.34% below |
| All-time low | EUR 1,265.28 (2019-11-17) | Current price +176.63% above |
| Fed funds target range | 3.75% to 4.00% | As of 2026-11-15; last change hike 25 bp, effective 2026-09-17 |
| ECB deposit facility rate | 2.50% | As of 2026-11-16; last change hike 25 bp, effective 2026-09-16 |
| Euro AAA 10Y yield | 3.37% | +8.2 bp over 5 days, +41.9 bp YTD (as of 2026-11-12) |
| Euro AAA 10Y-2Y spread | 29.2 bp | Curve flattening |
| EUR/USD | 1.1071 | -0.30% over 5 days, -5.78% YTD |
| BTC dominance | 59.36% | Total crypto market cap USD 1.98 trillion |
Distance calculations: (3,500.20 / 4,688.32) – 1 = -25.34% from the ATH. (3,500.20 / 1,265.28) – 1 = +176.63% above the ATL. The 24h trading volume stands at EUR 87.78 million. The EUR 1.57 billion market cap figure refers to the PAX Gold token only and does not represent the total value of above-ground gold.
Macro Backdrop
The cross-asset environment is neutral in risk sentiment, with moderately negative equity momentum globally but clear DACH outperformance: DACH indicators average +1.62% over five days versus -1.04% for global equity indicators. The DAX posts the strongest five-day move at +1.84% and leads on a one-month basis at +5.74%, while the Hang Seng is the weakest five-day performer at -2.89%. Euro rates are mixed with a flattening curve: the AAA 10Y yield sits at 3.37% (+8.2 bp over five days, +41.9 bp YTD), the 2Y at 3.08% (+96.7 bp YTD), and the 10Y-2Y spread at 29.2 bp. FX is mixed, with EUR/USD at 1.1071 (-0.30% over five days, -5.78% YTD) and EUR/CHF the strongest five-day mover at +0.28%.
For gold, the dominant macro force is restrictive monetary policy on both sides of the Atlantic. The Fed funds target range stands at 3.75% to 4.00% after a 25 bp hike effective 2026-09-17, and the ECB deposit facility rate is 2.50% after a 25 bp hike effective 2026-09-16. Per [T7] dated 2026-11-13, the US 10-year yield climbed back above 5.1% and hawkish Fed rhetoric continued, with New York Fed President Williams calling inflation “stubbornly persistent and elevated”. Per [T6] from 2026-11-13, traders assigned roughly a 91% probability to a further 25 bp December hike. That is a market expectation, not a decision. Rising euro nominal yields add a second, EUR-specific headwind, though the dataset lacks a euro-area inflation print, so a clean euro real-yield calculation is not possible here.
Investment Thesis
The core tension in gold today is structural demand versus cyclical headwinds. On the structural side, official-sector buying has re-rated the market: central banks purchased a record 1,082 tonnes in 2022 and sustained that pace through 2023 and 2024 [T1], the World Gold Council estimates 863 tonnes in 2025, down 20% from 1,092 tonnes in 2024 [T4], and official agencies now hold more than 36,000 tonnes, the highest level since 1975 [T5]. ECB research cited in [T5] shows gold is now 27% of official reserves, surpassing US Treasuries at 22%. Survey evidence supports continuation: a record 43% of 73 monetary authorities expect their gold reserves to rise over the next year [T1], and the WGC survey cites 45% [T5].
On the cyclical side, restrictive policy is the binding constraint. With the Fed at 3.75% to 4.00% and the ECB at 2.50%, the opportunity cost of holding a non-yielding asset is high, and the US 10-year above 5.1% per [T7] dated 2026-11-13 keeps real yields elevated. Should the market-priced December hike materialize per [T6] from 2026-11-13, EUR-gold could extend its drawdown. The constructive case requires a policy pivot: ING’s US economist expects easing in the second half per [T2] and cuts from the second quarter per [T3], which would lower real yields and reduce gold’s carry disadvantage. Note the explicit regime conflict in the sources: the WGC consensus baseline in [T8] assumes around 75 bp of additional Fed cuts, while [T6] and [T7] from 2026-11-13 report hawkish repricing toward a hike. These cannot be blended; the near-term tape currently favors the hawkish branch.
A further nuance matters for positioning: gold’s safe-haven profile works best in growth shocks with falling real yields. Supply-driven energy shocks do the opposite, pushing inflation up, keeping central banks on hold, and strengthening the dollar, all of which weigh on gold [T2].
Bullish Drivers
- Price-insensitive official demand. Central bank buying has proved steady and largely price insensitive [T3]. Per [T6] dated 2026-11-13, buying surged 42% as prices dipped below USD 4,000, and the WGC expects central banks to remain significant buyers through the remainder of 2026, with full-year purchases at least matching 2025 levels.
- Sanctions-risk diversification. Since 2022, emerging market central banks have accelerated reserve diversification in response to sanctions risk and dollar reliance [T3]. Countries facing elevated geopolitical risks are increasing gold reserves [T1], and gold now exceeds US Treasuries as a share of official reserves, 27% versus 22% [T5].
- Crisis-performance hedging. 90% of surveyed central banks cite gold’s performance during crises as a reason to hold it, alongside store-of-value and diversification motives [T5].
- Potential Fed easing. ING expects cuts from Q2 with policy becoming incrementally less restrictive [T3]; even a modest easing cycle would lower real yields and the opportunity cost of gold.
- Renewed ETF appetite. ETFs are showing renewed demand per [T3], adding a Western investor channel on top of official buying.
- Scenario upside. Per the WGC 2026 outlook [T8], gold could rise 5% to 15% in a growth-slowdown case and 15% to 30% in a pronounced flight-to-safety case. Applied to EUR 3,500.20, these map to roughly EUR 3,675 to 4,025 and EUR 4,025 to 4,550. These are scenario assumptions conditional on Fed easing beyond current hawkish pricing, not forecasts.
Relative Positioning vs Bitcoin and Ethereum
The comparison is constrained by the dataset: no Bitcoin or Ethereum price or momentum series are included, so a direct return comparison cannot be made and is not invented here. What the bundle does provide is crypto-structure context. BTC dominance stands at 59.36%, and total crypto market capitalization is USD 1.98 trillion with USD 64.3 billion in 24-hour volume. Elevated dominance with weak altcoin breadth suggests capital is consolidating in Bitcoin rather than rotating into gold tokens or Ethereum.
Structurally, gold and crypto compete for overlapping debasement-hedge and crisis-hedge flows, but only gold has an official-sector bid. 90% of central banks cite gold’s crisis performance as a holding rationale [T5], and no comparable sovereign demand exists for BTC or ETH. Gold’s EUR momentum baseline, -7.37% over 30 days and -15.29% over 200 days, reflects the rates headwind rather than a loss of its institutional franchise. In a risk-on rotation, a falling BTC dominance alongside the Fed easing scenario in [T3] could see gold and crypto compete more directly for the same flows; in a risk-off shock, gold’s historical crisis performance [T5] gives it a demand floor that crypto lacks.
Scenario Framework
Three scenarios anchor to the authoritative policy rates: Fed funds at 3.75% to 4.00% (hike 25 bp effective 2026-09-17) and the ECB deposit rate at 2.50% (hike 25 bp effective 2026-09-16).
- Scenario A, hawkish continuation. The December hike materializes as priced, with roughly a 91% market-implied probability per [T6] dated 2026-11-13, and the US 10-year holds above 5.1% per [T7]. EUR-gold extends losses toward the October 2025 lows near USD 3,850 referenced in [T7]. Euro nominal yields, already up 96.7 bp YTD at the 2Y point, reinforce the headwind. Qualitative probability: elevated, given current pricing.
- Scenario B, consensus normalization. Growth stabilizes near the 2.7% to 2.8% real GDP range assumed in WGC consensus [T8], and the Fed eventually delivers the around 75 bp of cuts in that baseline. EUR-gold ranges sideways with an upside skew. Note this consensus input predates the current hawkish repricing and would need to reassert itself.
- Scenario C, easing pivot or risk shock. A growth shock forces aggressive cuts, long yields fall sharply, and the dollar softens. Per [T8], gold could rise 15% to 30% from current levels, equivalent to roughly EUR 4,025 to 4,550. A moderately bullish variant, with cuts beyond expectations in a milder slowdown, implies 5% to 15%, or roughly EUR 3,675 to 4,025 [T8]. EUR/USD direction would amplify or dampen EUR-quoted gains and is not modelled here.
Only the roughly 91% December-hike figure in [T6] is a quantified market expectation. All other probabilities are qualitative judgments.
Valuation Discussion
At EUR 3,500.20, gold sits 25.34% below its January 2026 high of EUR 4,688.32 and 176.63% above its 2019 low of EUR 1,265.28. A 25% drawdown from an ATH is within historical bear-market depth for gold, so the price is not, by itself, evidence of a broken regime. On the WGC Gold Valuation Framework, consensus macro inputs produce rangebound fair-value estimates [T8], implying the pre-repricing price largely reflected macro consensus; the subsequent hawkish shift means the market has moved ahead of that consensus rather than against fundamentals.
The real-yield channel is the key valuation headwind. The US 10-year above 5.1% per [T7] dated 2026-11-13, sticky US inflation per the same source, and euro AAA 10Y yields at 3.37% keep nominal carry costs high. A euro real-yield calculation is not possible because the dataset lacks a euro-area inflation print; the 3.37% figure should be read as nominal only. On the demand side, central bank buying at an average of roughly 1,000 tonnes per year over the past four years [T5], described as largely price insensitive [T3], provides a valuation floor that pure investor-driven assets lack. Gold’s weight in global reserves, about 17% and potentially around a quarter at end-2025 on preliminary IMF data [T4], frames the scarcity context. Net assessment: not cheap on carry, but supported below by a structural bid; mean reversion higher requires falling real yields, a Scenario C condition.
Risks
Downside risks. First, policy: the roughly 91% market-implied probability of a 25 bp December hike per [T6] dated 2026-11-13, and hawkish rhetoric from Williams and Daly per [T7], could extend the drawdown. A larger 50 bp hike, flagged as a possibility in [T6], would be a materially negative surprise. Second, energy-shock dynamics: supply-driven shocks raise inflation, keep central banks on hold, and strengthen the dollar, historically pressuring gold [T2]. Third, liquidity risk: gold is often sold as a source of funds in liquidity squeezes [T2]. Fourth, euro rates: the AAA 2Y yield is up 96.7 bp YTD, eroding EUR-quoted gold’s appeal even if dollar gold stabilizes.
Upside risks. Geopolitical escalation and sanctions risk would accelerate reserve diversification [T1], [T5]. Uncertainty around Fed leadership adds a premium to non-sovereign stores of value [T2]. The WGC flags geopolitical uncertainty, inflation risks, and financial-market stress as offsets to the rate headwinds [T6]. A crisis or growth shock would trigger the flight-to-safety case in which gold historically outperforms, the top-cited rationale among central banks [T5].
Data risks. BTC and ETH price series are absent from the dataset, limiting the relative-positioning section. Sources T1 to T5 are undated and reference 2022 to 2025 conditions, so all news figures are quoted with explicit source context and treated as historical, not current state.
Appendix
Methodology and data notes. Price data comes from the bundle market_data block, retrieved 2026-11-16 05:19 UTC. XAU in EUR is proxied by PAX Gold (coingecko_id pax-gold); the EUR 1.57 billion market cap is the token’s capitalization, not the total value of above-ground gold. Policy rates are taken exclusively from the authoritative Policy Rates block: US Federal Funds Target Range 3.75% to 4.00% as of 2026-11-15, last change a 25 bp hike effective 2026-09-17; ECB Deposit Facility Rate 2.50% as of 2026-11-16, last change a 25 bp hike effective 2026-09-16. Market overview as-of dates: equities 2026-11-13 to 2026-11-16, euro yields 2026-11-12, FX 2026-11-16.
Source dating. Tavily sources T1 to T5 carry no publication dates and reference 2022 to 2025 data; they are used here as historical and structural context only. T6 and T7 are dated 2026-11-13. T8 is the WGC 2026 outlook. The approximate USD-equivalent gold price of EUR 3,500.20 / 1.1071 = USD 3,161.56 uses the 2026-11-16 EUR/USD fix and is an approximation; it differs from the USD 3,850 and USD 4,000 levels cited in [T6] and [T7], which reflect their own source dates and likely different EUR/USD conditions.
Limitations. No BTC or ETH price data in the bundle. No US CPI, payrolls, or US Treasury yield series in market_overview; US rate references rely on dated Tavily sources. No euro-area inflation print, so euro real yields are presented as nominal only. Scenario probabilities other than the [T6] December-hike expectation are qualitative judgments.
Sources
- [T1] Is it a golden era for gold? | J.P. Morgan Private Bank U.S.
- [T2] Why gold isn’t acting like a safe haven right now | ING THINK
- [T3] Why the gold rally isn’t over yet | ING THINK
- [T4] How important are central bank holdings of gold? | Brookings
- [T5] Central bank gold holdings are at a 50-year high. What’s behind the jump in reserves?
- [T6] Central Bank Gold Buying Surges 42% as Prices Dip Below US$4000
- [T7] Gold Forecast: Sellers dominate on hawkish repricing of Fed interest rate outlook
- [T8] Gold Outlook 2026: Push ahead or pull back | World Gold Council
Disclaimer. This report is AI-generated, for informational purposes only, and does not constitute investment advice. Figures should be verified against primary sources before any decision-making use.
Important Note / Wichtiger Hinweis:
EN: This report may have been generated using AI. It processes data from publicly available sources. The content is provided for informational purposes only.DE: Dieser Bericht kann mithilfe von KI erstellt worden sein. Dabei werden Daten aus öffentlich zugänglichen Quellen verarbeitet. Die Inhalte dienen ausschließlich Informationszwecken.
* DE: Die ergänzenden Inhalte können KI-generiert sein. EN: The additional content may be AI-generated.