
The altii-BTC-Report: Bitcoin in EUR
Listen to the summary
Key Data Snapshot
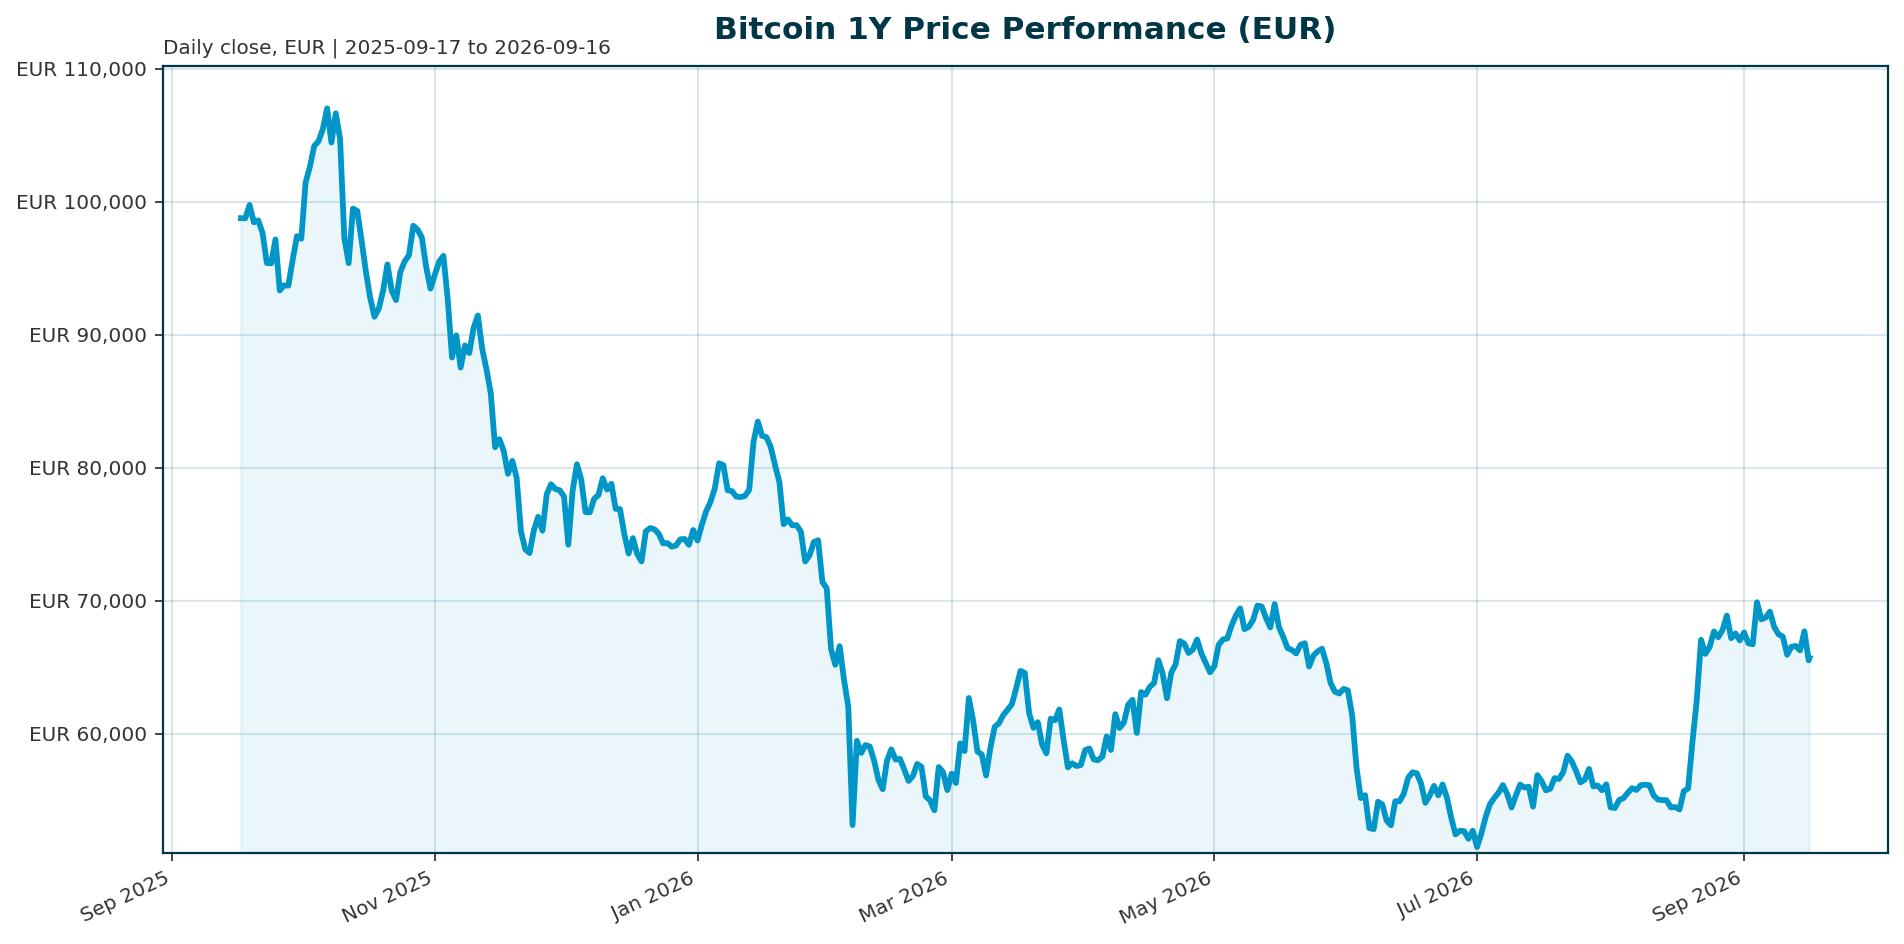
| Metric | Latest | Institutional read-through |
|---|---|---|
| BTC/EUR spot price | €65,697 | Near the lower end of the 24h range. |
| Market capitalization | €1.319tn | Rank 1 cryptoasset by market capitalization. |
| 24h volume | €34.38bn | Volume-to-market-cap turnover: €34.38bn / €1.319tn = 2.61%. |
| Performance | 1h -0.1%; 24h -2.39%; 7d -3.8%; 30d +19.6%; 200d +14.9%; 1y -34.2% | Short-term pressure, positive medium-term momentum, negative trailing 1-year trend. |
| 24h range | Low €65,012; high €67,320 | Range: €2,308, equal to 3.51% of spot. Current price is 29.7% up from the 24h low within the range. |
| Supply | 20,085,028 BTC circulating; 21,000,000 BTC max | Circulating supply is 95.64% of max supply. Remaining issuance: 914,972 BTC, or 4.36%. |
| Fully diluted valuation | €1.319tn | FDV premium to market cap is approximately 0.0001%, reflecting near-complete issuance. |
| All-time high | €107,662 on 2025-10-06 | Current drawdown: -38.98%. Upside to ATH: €107,662 / €65,697 – 1 = 63.9%. |
| BTC dominance | 58.49% | Bitcoin remains the sector benchmark and primary crypto reserve asset. |
Market Setup
Bitcoin trades at €65,697, down 2.39% over 24h and 3.8% over 7d, but still up 19.6% over 30d. The immediate price action is therefore corrective, not yet a full reversal of the one-month recovery.
The cross-asset backdrop is a headwind. Market risk sentiment is negative, equity momentum is moderately negative, and DACH indicators are broadly in line with global equities. The Euro Stoxx 50 has the strongest 5-day move at -0.60%, while the Nikkei 225 is weakest at -2.34%. Euro area AAA 10Y yields are 3.54%, up 16.2 bp over 5 days, with a 10Y-2Y spread of 31.3 bp. FX is mixed: EUR/USD is 1.1551, down 0.53% over 5 days. This rates and risk backdrop matters because Bitcoin now trades as both a scarce digital asset and a high-beta liquidity instrument.
The macro link is not theoretical. Recent market commentary states that Bitcoin remains tied to broader liquidity conditions and that inflation, Federal Reserve uncertainty, energy prices, geopolitics and fiscal pressure continue to influence risk assets [T2]. Even when ETF inflows revive confidence, the macro backdrop is not fully supportive [T2].
Investment Thesis
The institutional thesis for Bitcoin rests on four pillars: scarce supply, deepening liquidity, regulated access and macro sensitivity.
- Scarcity: 20,085,028 BTC are circulating against a fixed cap of 21,000,000 BTC. Only 914,972 BTC remain to be issued.
- Liquidity: 24h volume of €34.38bn supports institutional execution, although liquidity can deteriorate under stress.
- Regulated access: Spot ETFs, corporate treasuries and regulated vehicles have made BTC easier to integrate into workflows for advisers, private banks and institutions [T1].
- Macro sensitivity: ETF flows have effectively become a new macro indicator for Bitcoin, and 2025 was described as the first full year of an ETF-led and macro-led crypto regime [T1].
The bullish interpretation is that Bitcoin is moving from tactical crypto exposure toward a strategic portfolio allocation. One institutional overview argues that Bitcoin is no longer only a retail-driven speculative asset and now has recognition as a legitimate asset class, with institutional capital flows and macro forces increasingly rivaling halving-cycle supply shocks [T7].
The bearish interpretation is the mirror image: institutionalization increases Bitcoin’s sensitivity to risk budgets, ETF flows, portfolio rebalancing and macro liquidity. This broadens the buyer base, but it also imports traditional-market cyclicality.
Bullish Drivers
- ETF demand can return quickly: Nearly USD 2bn reportedly entered Bitcoin ETFs in one week, with around 70% going through IBIT [T4].
- Institutional spot demand remains visible: Cumulative August spot Bitcoin ETF inflows were reported above USD 3bn, including about USD 314mn of net inflows on 25 August [T5].
- Flow support can cushion deleveraging: Institutional spot demand was described as present while short-term leveraged traders reduced exposure [T5]. That is constructive if spot buying absorbs derivatives-driven selling.
- Supply remains structurally constrained: With 95.64% of max supply already circulating, incremental issuance is small relative to institutional allocation demand.
- Adoption base continues to broaden: Bitcoin’s 2026 trajectory is being reshaped by institutional capital flows, ETFs and its establishment as a legitimate portfolio allocation for traditional investors [T3].
- Regulatory clarity could unlock more demand: Commentary links renewed confidence to ETF inflows, visible institutional demand and a potentially improving regulatory backdrop [T2].
- Institutional ownership is meaningful: Institutional entities, including ETFs, governments and public and private companies, were estimated to hold about 18.5% of Bitcoin’s fixed supply cap [T7].
The balanced conclusion: ETF inflows and institutional accumulation improve Bitcoin’s downside absorption, but they do not eliminate volatility. If flows reverse, the same institutional channel can accelerate selling pressure.
Relative Positioning vs Gold and Ethereum
The portfolio comparison is conceptually clear but data-limited. The bundle identifies gold and Ethereum as benchmarks, but current gold price, Ethereum price, market capitalization, volatility and performance data are unavailable. Precise relative-return calculations versus gold and Ethereum are therefore unavailable.
Relative to gold, Bitcoin remains the higher-beta scarcity asset. It may benefit more from institutional risk appetite and currency-debasement narratives, but it can underperform during stress. In Q4 2025, Bitcoin’s correction lagged traditional assets such as gold and bonds, even as institutionalization continued [T1].
Relative to Ethereum, Bitcoin retains the clearer reserve-asset profile within crypto, supported by 58.49% BTC dominance and a fixed 21mn supply cap. Ethereum may offer broader smart-contract and staking-related utility, but current Ethereum market data are unavailable in this bundle. Firm relative valuation conclusions require live ETH price, ETH/BTC, ETH market cap, ETF flow and volatility data.
ETF flow sensitivity affects both Bitcoin and Ethereum. Record outflows from U.S.-listed BTC and ETH ETFs in Q4 coincided with Bitcoin breaking support around USD 98,000 and retesting the low USD 90,000 range [T1]. That underscores the shared institutional-flow risk across the largest cryptoassets.
Scenario Framework
Scenario levels below convert USD-based market commentary into EUR using EUR/USD 1.1551. Formula: USD target / 1.1551 = EUR target. These are reference scenarios, not forecasts.
| Scenario marker | USD level | EUR conversion | Upside vs €65,697 | Implied market cap using 20,085,028 BTC | Interpretation |
|---|---|---|---|---|---|
| Lower conservative 2026 range | USD 85,000 | €73,587 | +12.0% | €1.478tn | Cited as part of conservative 2026 ranges [T3][T6]. |
| Mid institutional marker | USD 100,000 | €86,573 | +31.8% | €1.739tn | Represents recovery toward round-number institutional targets [T3]. |
| Upper conservative 2026 range | USD 118,000 | €102,156 | +55.5% | €2.052tn | Upper end of one cited conservative model range [T6]. |
| Higher 2026 institutional range | USD 132,000 | €114,276 | +73.9% | €2.295tn | Upper end of another cited 2026 range [T3]. |
| Favorable adoption case | USD 150,000 | €129,858 | +97.7% | €2.608tn | Conditional on favorable regulation and continued institutional adoption [T3]. |
| Longer-horizon high case | USD 300,000 | €259,716 | +295.3% | €5.217tn | Longer-term scenario, conditional on favorable Federal Reserve policy shifts [T6]. |
| Longer-horizon extreme high case | USD 500,000 | €432,861 | +558.9% | €8.694tn | Highly conditional, not a base case [T6]. |
Base case: Bitcoin remains institutionally relevant, but negative risk sentiment and rising euro yields cap near-term upside. A return toward €73,587 to €102,156 would require continued ETF demand and no deterioration in liquidity conditions.
Bull case: Renewed ETF inflows, improving regulation and constrained supply support a move back toward the higher converted ranges. The prior EUR ATH of €107,662 sits between the converted USD 118,000 and USD 132,000 levels.
Bear case: ETF outflow risk remains material. One report noted ETF outflows crossing USD 2bn and argued that bulls need to show outflows are slowing, lower-level buyers are stepping in and macro conditions are not deteriorating [T8]. Under this scenario, Bitcoin remains vulnerable to renewed drawdowns despite structural adoption.
Valuation Discussion
Bitcoin does not fit a discounted cash-flow framework. Valuation is better assessed through network value, scarcity, liquidity, dominance, institutional ownership and scenario-implied market capitalization.
- Current network value: €65,697 spot price multiplied by 20,085,028 BTC circulating supply equals approximately €1.319tn, consistent with reported market capitalization.
- FDV versus market cap: Fully diluted valuation is €1.319tn versus market capitalization of €1.319tn. The negligible premium reflects issuance maturity.
- Dominance: BTC dominance is 58.49% versus total crypto market capitalization of €2.250tn. Reported BTC market cap divided by total crypto market cap equals roughly 58.6%, close to the stated dominance figure.
- Scarcity: Circulating supply is 95.64% of the 21mn cap, limiting future dilution.
- Institutional supply absorption: By year-end 2025, 6.7mn BTC reportedly sat across ETFs, exchanges and treasuries, described as Bitcoin’s “institutional supply era” [T1]. Separately, institutional entities were estimated to hold around 18.5% of the fixed supply cap [T7]. These figures should not be double-counted, but both point to a more institutional holder base.
The bullish valuation argument is that even small increases in institutional allocation can have a large price impact because new supply is limited. At the converted USD 150,000 level, implied market capitalization rises to about €2.608tn, nearly double current capitalization.
The bearish valuation argument is that market capitalization can compress quickly if ETF demand weakens, crypto allocations shrink, or capital rotates toward competing themes. Bitcoin remains a high-beta corner of global markets despite its institutional maturation [T1].
Risks
- Macro risk: Current risk sentiment is negative, and euro-area yields are rising with curve flattening. Higher real or nominal yields can pressure non-yielding high-beta assets.
- Flow dependency: Bitcoin’s balance of risks remains highly dependent on ETF flows and macro conditions [T2].
- ETF outflows: Record BTC and ETH ETF outflows in Q4 coincided with Bitcoin breaking key support levels and retesting lower ranges [T1]. More recent reports also state that ETF-driven demand is no longer moving in a straight line and that outflows intensified after months of support [T8].
- Volatility and drawdown risk: BTC is down 34.2% over 1 year and trades 38.98% below its EUR ATH. A Q4 2025 episode reportedly erased more than USD 1tn in market value as Bitcoin fell nearly 30% from its peak to below USD 90,000 [T1].
- Leverage and liquidation risk: ETF inflows can cushion declines, but they may not fully offset macro pressure, profit-taking and derivatives liquidations [T5].
- Sentiment reversal: A rapid move from fear to greed can support momentum but also increase vulnerability to profit-taking if price fails to break resistance [T5].
- Relative capital competition: Bitcoin must compete for capital against AI and other high-growth themes [T8].
- Data limitations: Live gold and Ethereum benchmark data, ETF flow time series, on-chain balances, realized volatility, futures funding and options skew are unavailable in this bundle.
Appendix
Data and methodology
- Report generated at: 2026-09-16T04:15:20.855719Z.
- Market data retrieved at: 2026-09-16T04:15:06.323641Z.
- Asset: Bitcoin, symbol BTC, CoinGecko ID bitcoin.
- Quote currency: EUR.
- Report profile: crypto_institutional.
- Market overview errors: none reported.
- USD scenario conversions use EUR/USD 1.1551. Calculation: USD target / 1.1551 = EUR target.
- Implied market capitalization uses circulating supply of 20,085,028 BTC. Calculation: EUR target price x 20,085,028.
Key calculations
- 24h range: €67,320 – €65,012 = €2,308.
- 24h range as percentage of spot: €2,308 / €65,697 = 3.51%.
- Position within 24h range: (€65,697 – €65,012) / €2,308 = 29.7%.
- Volume-to-market-cap ratio: €34.38bn / €1.319tn = 2.61%.
- Circulating supply as percentage of max supply: 20,085,028 / 21,000,000 = 95.64%.
- Remaining issuance: 21,000,000 – 20,085,028 = 914,972 BTC, or 4.36% of max supply.
- Upside to EUR ATH: €107,662 / €65,697 – 1 = 63.9%.
- Drawdown from EUR ATH: €65,697 / €107,662 – 1 = -38.98%.
Unavailable data
Current gold market data are unavailable. Current Ethereum market data are unavailable. ETF flow time series, on-chain exchange balances, realized volatility, futures funding, options skew and wallet-level institutional balances are unavailable. These missing inputs limit precision in relative positioning and market-structure analysis.
Sources
- [T1] Crypto Market 2025: Year-End Review & Expert Insights
- [T2] Bitcoin Holds Near $80K-$81K as ETF Inflows Revive Bullish Sentiment: | HedgeCo Insights
- [T3] menu
- [T4] Bitcoin ETFs attract $2 billion in inflows | Charles-Henry Monchau …
- [T5] Bitcoin (BTC) Daily Market Analysis 27 August 2026
- [T6] menu
- [T7] The End of Bitcoin’s Four-Year Cycle? How ETFs and Institutions Are Reshaping the Market – Wolf & Company
- [T8] Bitcoin Opens June Under Pressure as ETF Outflows Cross $2B: | HedgeCo Insights
This report is AI-generated, for informational purposes only, and does not constitute investment advice, financial advice, trading advice or a recommendation to buy or sell any asset.
Important Note / Wichtiger Hinweis:
EN: This report may have been generated using AI. It processes data from publicly available sources. The content is provided for informational purposes only.DE: Dieser Bericht kann mithilfe von KI erstellt worden sein. Dabei werden Daten aus öffentlich zugänglichen Quellen verarbeitet. Die Inhalte dienen ausschließlich Informationszwecken.
* DE: Die ergänzenden Inhalte können KI-generiert sein. EN: The additional content may be AI-generated.